TreeProfiler is a command line tool designed to automate the annotation of large phylogenetic trees with corresponding metadata. It also facilitates the visual exploration of these annotations as phylogenetic profiles, making it a powerful resource for researchers working with complex biological data.
- TreeProfiler Overview
- Key Features
- Gallery of Interactive Examples
- Documentation and Citation
- Installation
- Basic Usage
- Full Tutorial
- Getting Support and Issues
- Automated Annotation that integrates metadata into phylogenetic tree, and summarizes annotation in internal nodes, including:
- Categorical/Numerical metadata in TSV/CSV format
- Taxonomic Annotation of NCBI/GTDB taxonomy database
- Functional Annotation from eggnog-mapper output
- Domain annotation from pfam/smart
- Multiple Sequence Alignment annotation
- Visual Exploration that allows for the detailed examination of annotated trees, aiding in the interpretation and presentation of data.
- Analytic Methods for computing analysis from leaf nodes:
- Ancestral Character Reconstruction for both discrete and continuous traits.
- Phylogenetic Signal Delta Statistic
- Lineage Specificity Analysis
Here is some examples figure from treeprofiler paper to demonstrate the scalbility and use case. For full code and figure reproduction instructions, please check at https://github.com/dengzq1234/treeprofiler_paper.

- Figure 1A–E Layout Demos and Figure 1F–H Trait Types & Features. General overview.

- Figure 2: POR_N Domain Family. Visualization of POR_N family phylogenetic tree across 13,297 sequences with taxonomic annotation, KEGG KO profiling and Pfam domain architectures.

- Figure 3: mOTUs Abundance Profiles. Visualization of the mOTUs reference taxonomy tree with 124,295 leaves annotated with 51 habitat-specific abundance profiles.

The official documentation of TreeProfiler is in https://dengzq1234.github.io/TreeProfiler/ where provides detailed instructions with examples.
If you have any doubts, please drop a line in issue or contact https://x.com/deng_ziqi
Full manuscript of TreeProfiler is in https://doi.org/10.1101/2023.09.21.558621
If you use TreeProfiler, please cite:
Ziqi Deng, Ana Hernández-Plaza, Adrian Arellano Davin, Jaime Huerta-Cepas.
"TreeProfiler: A command-line tool for computing and visualizing phylogenetic profiles against large trees"
bioRxiv (2023) doi: 10.1101/2023.09.21.558621
# create environment
conda create -n treeprofiler python=3.10
conda activate treeprofiler

# dependencies for ETE Toolkit v4 (optional)
conda install conda-forge::gcc

# Install ETE Toolkit v4 for treeprofiler
pip install "git+https://github.com/etetoolkit/ete.git@ete4_treeprofiler"

# Install custom pastml package for treeprofiler
pip install "git+https://github.com/dengzq1234/pastml.git@pastml2ete4"

# Install treeprofiler
pip install treeprofiler
TreeProfiler provide various example dataset for testing in examples/ or https://github.com/compgenomicslab/TreeProfiler/tree/main/examples,
each directory consists a demo script *_demo.sh for quick starting different functions in TreeProfiler which alreadyh as annotate-plot pipeline of example data. User can fast explore different example tree with different visualizations. Here is the demonstration:
# execute demo script of example1
cd examples/basic_example1/
sh ./example1_demo.sh

Annotate example tree with two metadata tables
start parsing...
Time for parse_csv to run:  0.001968860626220703
Time for load_metadata_to_tree to run:  0.0003094673156738281
Time for merge annotations to run:  0.05160331726074219
Time for annotate_taxa to run:  4.76837158203125e-07
Visualize properties categorical data random_type in rectangle_layout, numerical data sample1, sample2 in heatmap_layout and barplot_layout.
Current trees in memory: 0
Added tree example with id 0.
 * Serving Flask app 'ete4.smartview.gui.server' (lazy loading)
 * Environment: production
   WARNING: This is a development server. Do not use it in a production deployment.
   Use a production WSGI server instead.
 * Debug mode: on
 * Running on http://127.0.0.1:5000/ (Press CTRL+C to quit)
Detailed steps in example1_demo.sh is:
#!/bin/bash

# *Annotate multiple metadatas into tree, seperated by ,
echo "Annotate example tree with two metadata tables"
treeprofiler annotate \
--tree basic_example1.nw \
--input-type newick \
--metadata basic_example1_metadata1.tsv basic_example1_metadata2.tsv \
-o ./

echo "Visualize properties categorical data random_type in rectangle_layout, numerical data sample1, sample2 in heatmap_layout and barplot_layout."
treeprofiler plot \
--tree basic_example1_annotated.ete \
--input-type ete \
--rectangle-layout random_type \
--binary-layout bool_type \
--heatmap-layout sample1 sample2 sample3 \
--barplot-layout sample4 sample5 \
--profiling-layout random_type \
--column-width 40 \
--padding-x 3

....
As the session starts in local server http://127.0.0.1:5000, annotated tree and selected properties are visualized at the interactive session.
 Here is detailed introduction of interactive session of visualization(here)
Check other tutorial scripts
# display demo script of each example
./examples/basic_example1/example1_demo.sh
./examples/automatic_query/highlight_demo.sh
./examples/automatic_query/collapse_demo.sh
./examples/automatic_query/prune_demo.sh
./examples/basic_example2/example2_demo.sh
./examples/taxonomy_example/ncbi/ncbi_demo.sh
./examples/taxonomy_example/gtdb/gtdb_demo.sh
./examples/pratical_example/progenome3/progenome_demo.sh
./examples/pratical_example/gtdb_r202/gtdbv202full_demo.sh
./examples/pratical_example/gtdb_r202/gtdbv202lite_demo.sh
./examples/pratical_example/emapper/emapper_demo.sh
Once installed ete4 and pastml as previous step, users can install latest version of treeprofiler for local development
# install TreeProfiler
git clone https://github.com/compgenomicslab/TreeProfiler
cd TreeProfiler/
pip install -e .
or
# install directly
pip install https://github.com/compgenomicslab/TreeProfiler/archive/main.zip
TreeProfiler takes following file types as input
| Input | Filetype |
|---|---|
| Tree | newick, ete |
| Metadata | tar.gz, tsv |
-
ete format is a novel format developed to solve the situation we encounter in the previous step, annotated tree can be recover easily with all the annotated data without changing the data type. Besides, the ete format optimized the tree file size after mapped with its associated data. Hence it's very handy for programers in their own script. At this moment we can only view the ete format in treeprofiler, but we will make the ete format more universal to other phylogenetic software.
-
Metadata input could be single or multiple files, either tar.gz compressed file(s) which contains multiple .tsv or plain .tsv file(s). Ideally with Column names and first column is the name of nodes.
TreeProfiler has two main subcommand:
- annotate
- plot
The first one annotate is used to annotate your input tree and corresponding metadata, TreeProfiler will map all the metadata into corresponding tree node. In this step, annotated tree will be generated in newick and ete format
treeprofiler annotate --tree tree.nw --input-type newick --metadata metadata.tsv --outdir ./
The second subcommand plot is used to visualize tree with associated metadata. By default, treeprofiler will launch an interactive session at localhost for user to explore input tree.
treeprofiler plot --tree tree_annotated.nw --input-type newick
or
treeprofiler plot --tree tree_annotated.ete --input-type ete
TreeProfiler also provide a local GUI interface for annotation and visualization. Simply execute
treeprofiler-desktop
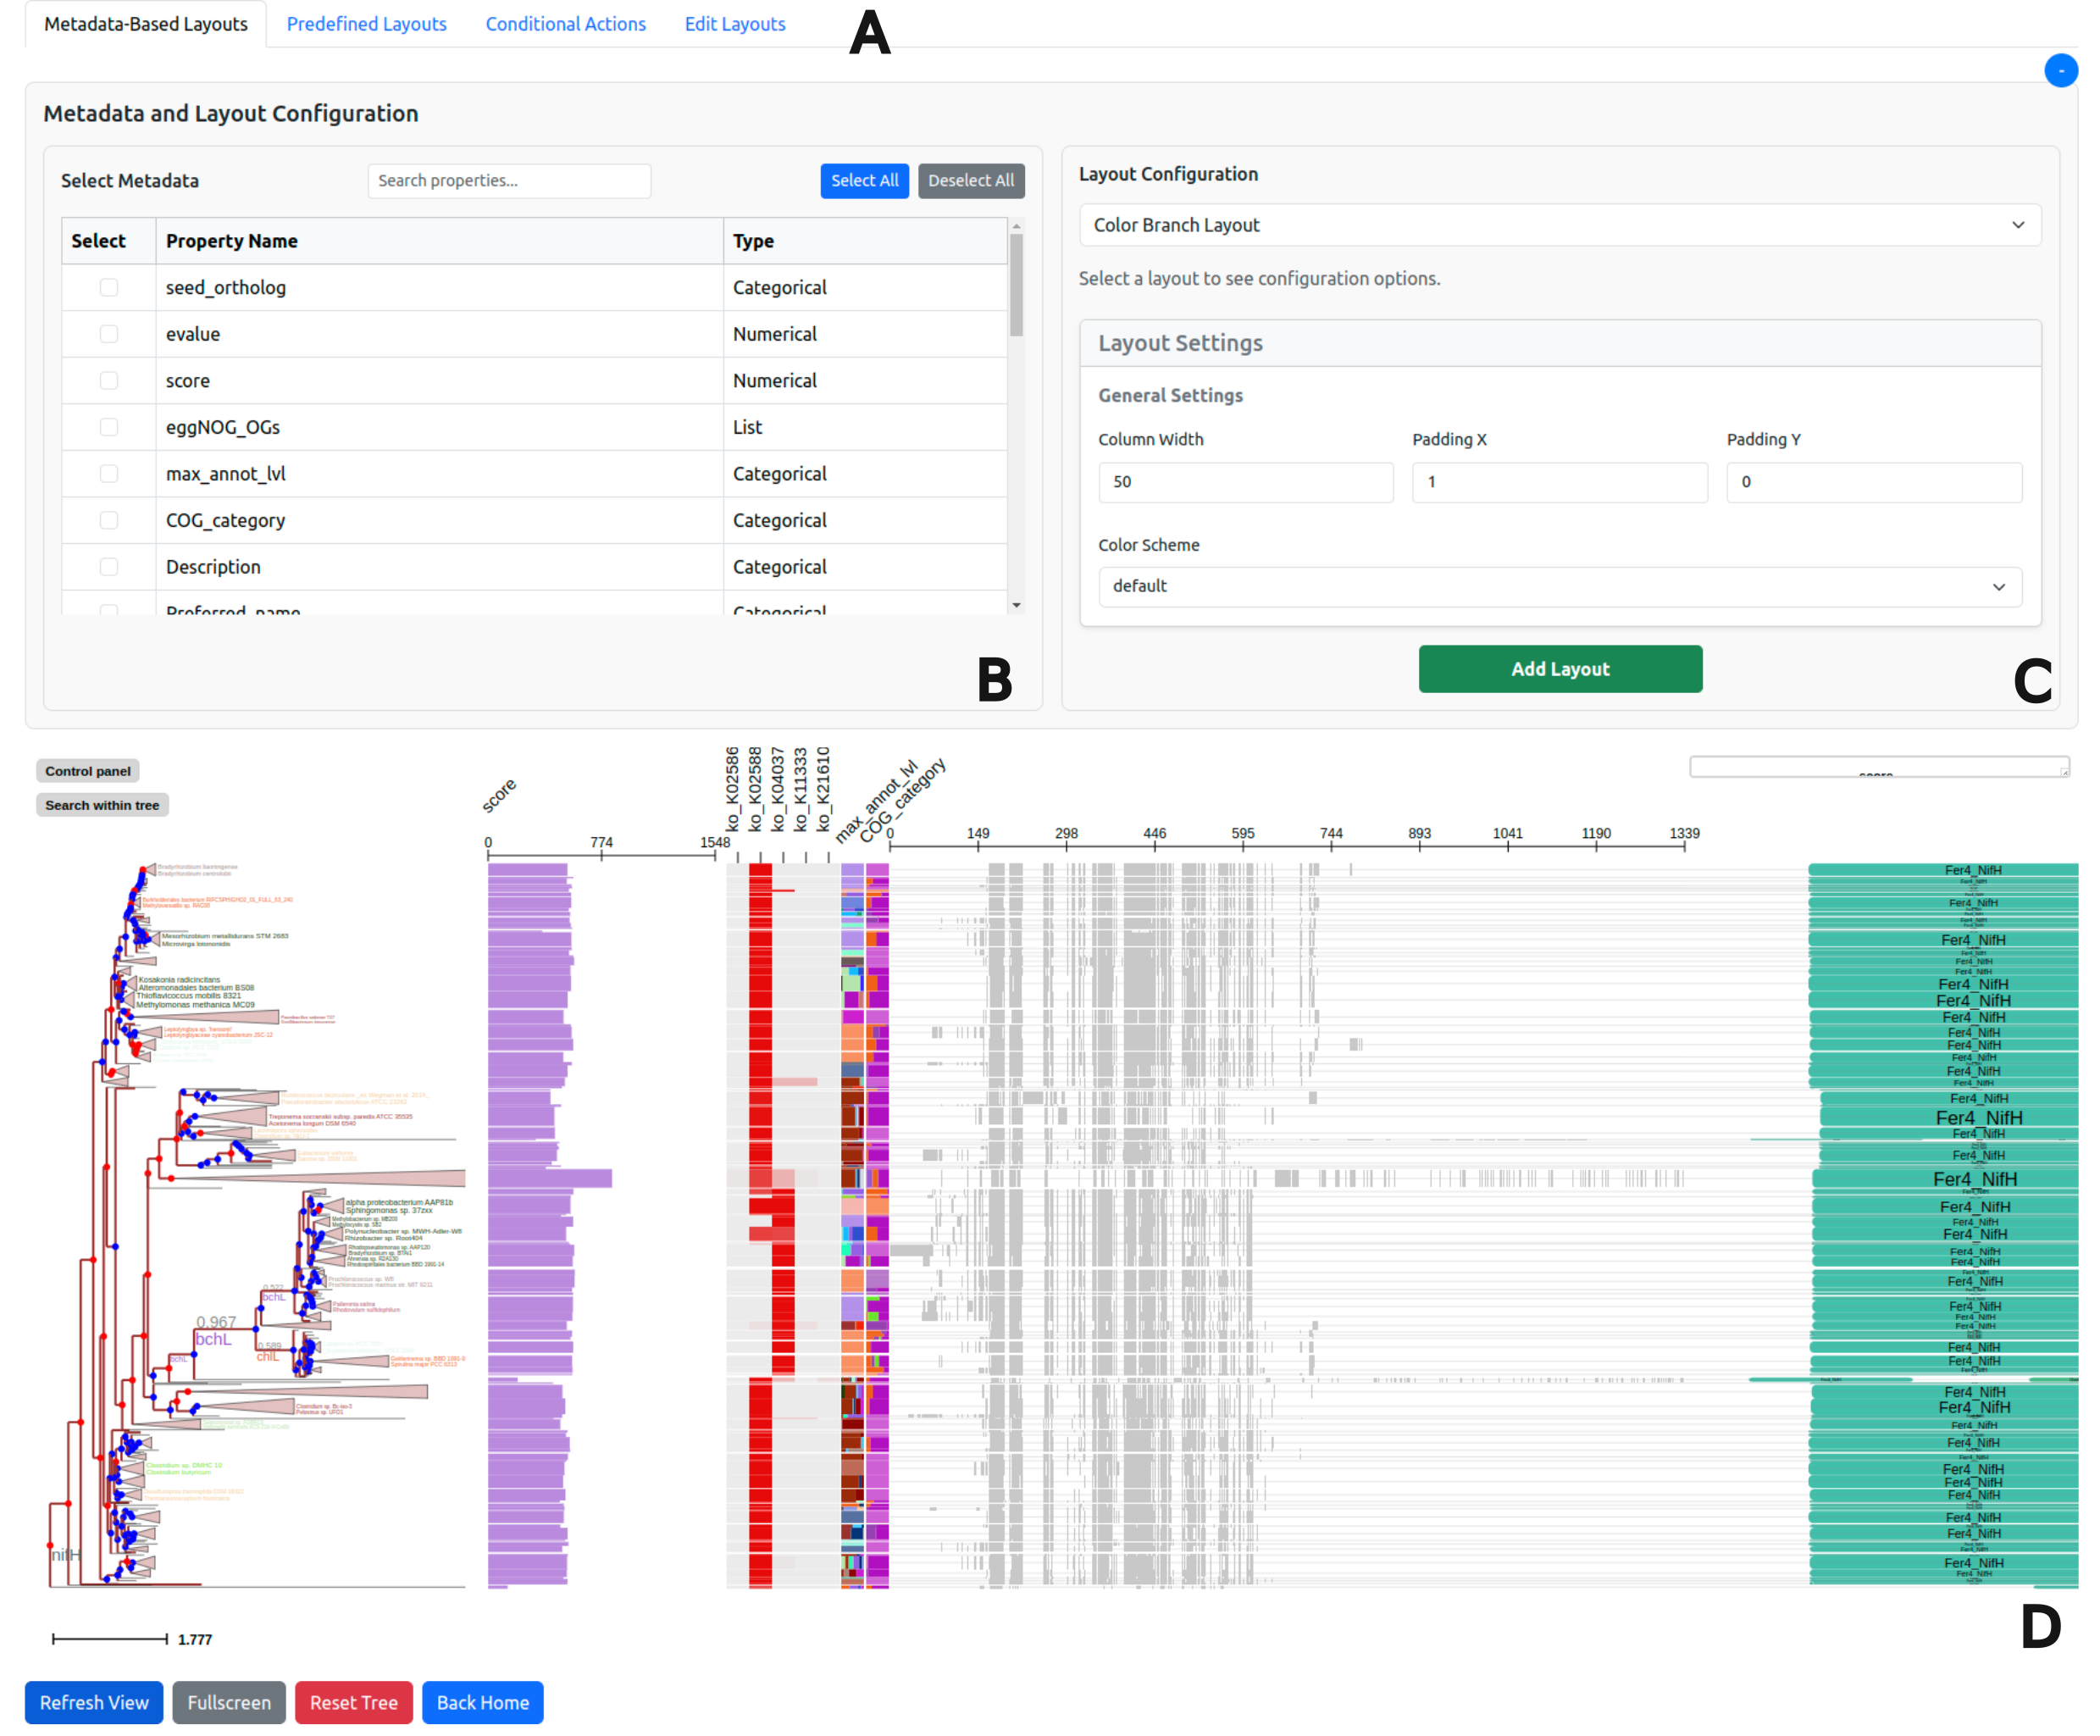
Input panel to upload the tree and metadata, click the botton button for annotation and visualization.
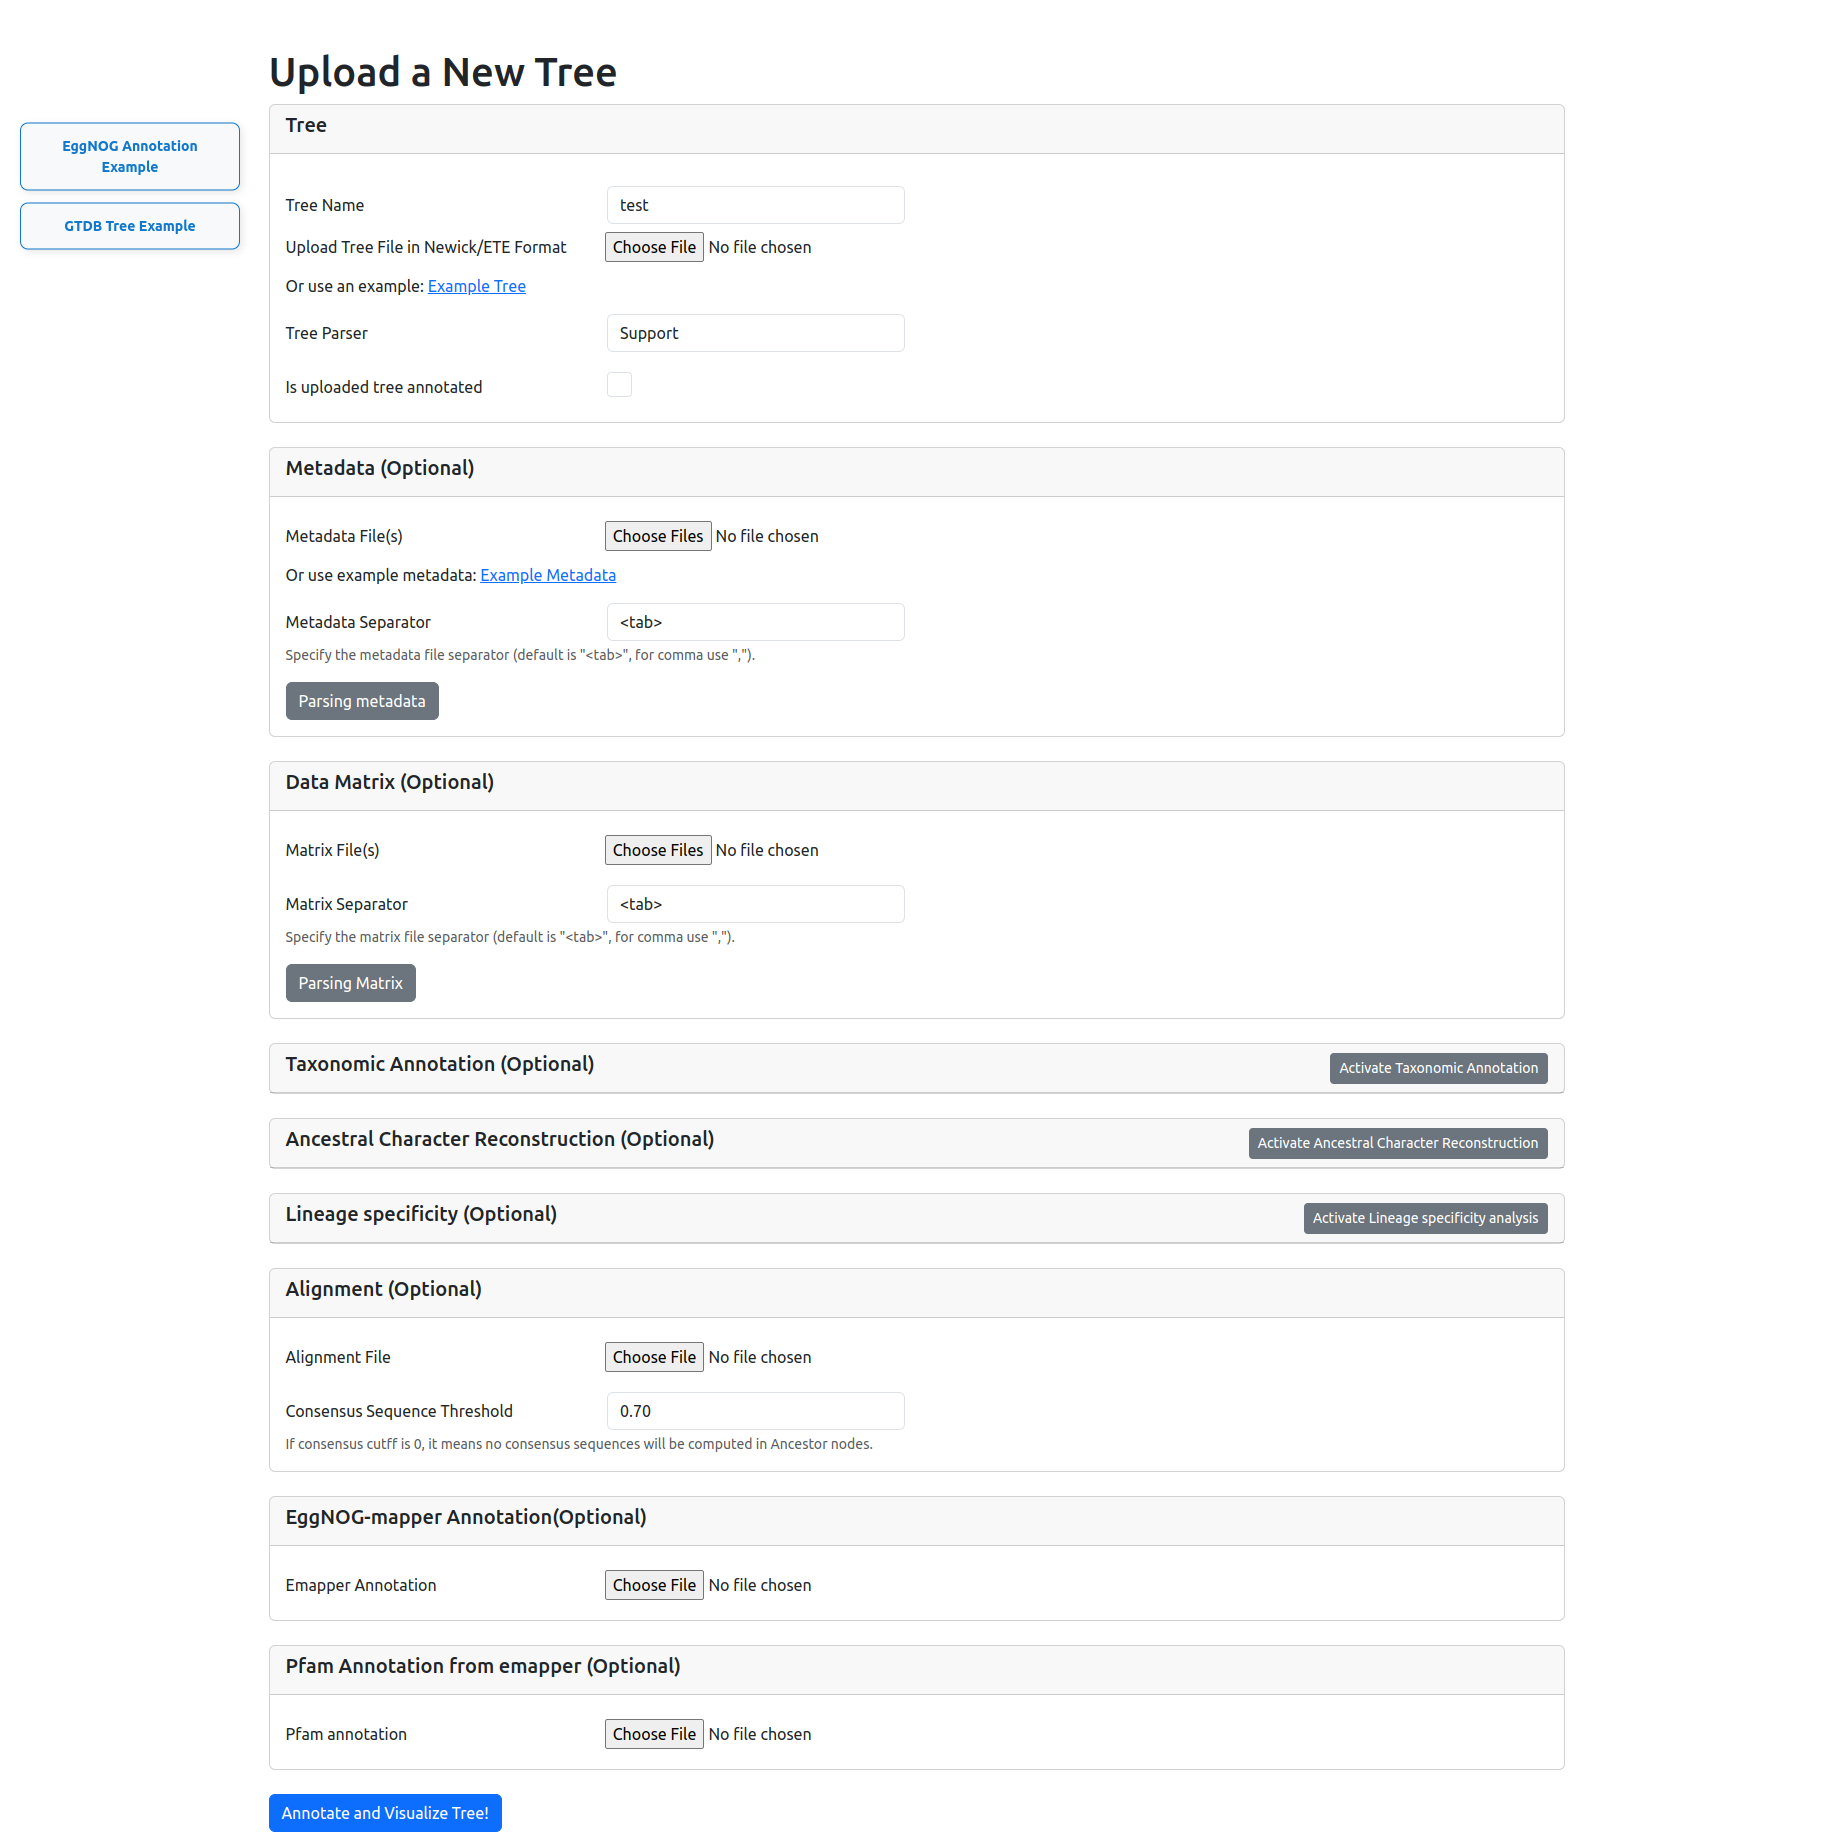
Result visualization demo
We provided detailed step-by-step instructions covering most of the options with examples in the official documentation, and is available in:
https://dengzq1234.github.io/TreeProfiler/
For bug reports, feature requests and general discussion, use https://github.com/compgenomicslab/TreeProfiler/issues
For any other inquiries (collaborations, sponsoring, etc), please contact https://x.com/deng_ziqi or dengziqi@gmail.com