This is a repository for Udacity's Computer Vision course on radar object detection.
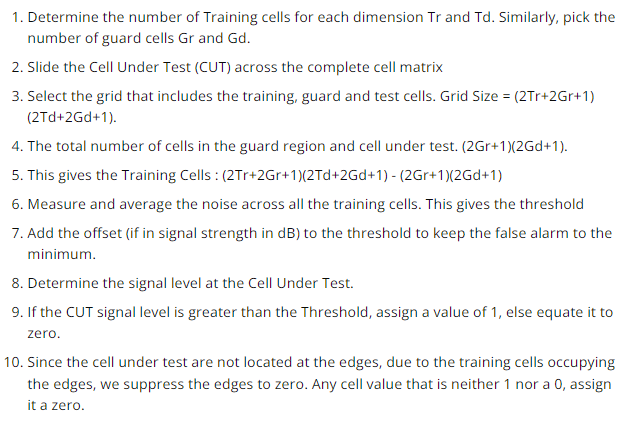
To apply 2D CFAR into to locate a moving target is the following:
- 1D CFAR is a method used for object detection in our radar output. A quick summary on how this works is by converting our output signal from the radar into an array. Thus then choosing something called "Guard Cells" and "Training cells" and cell under test or "Cut". In terms of an array we would just use a sliding window and make sure that in the left and right of the CUT or cell under test can fit the amount of guard and training cells we chose to use. Such as in the picture below:
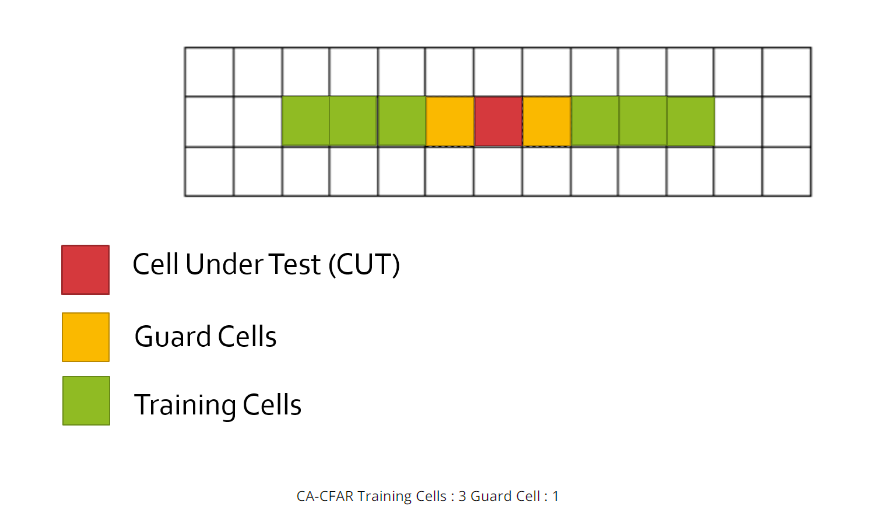
This image shows how this would be implemented in terms of a 1D array. The point of using this is to average the noise level around the cell under test and measure the signal to noise ratio. We take the noise levels throughout the chosen training cells not the "guard cells" since these are used to just pad the cell under test for the noise to not impact our value. We measure the noise in the training cells and then average out or normalize the result. This allows of to choose a certain threshold that if the signal in the cell under test is above this "threshold" then we can assume that this is an actual object detected and not just some random noise from the background. In terms of cars for example the intentisty of a car or reflected signals from it would be greater than the reflection of objects on the road or trees in the background thus we would be able to detect a vehicle. Now for a 2D CFAR the same method is implemented but with a complex 2D matrix.
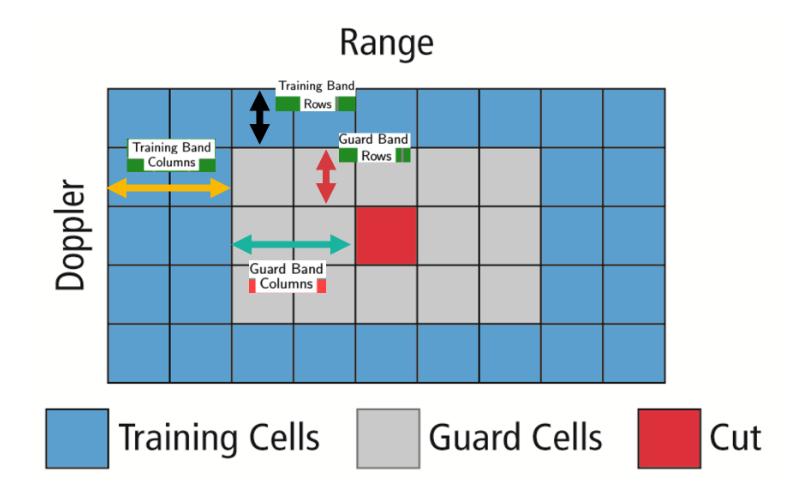
As the methods state choosing the amount of training and guard cells is arbitrary and should be chosen by the user according to the amount of noise in the background. The more training cells the more noise one would be averaging out thus the threshold might become more stable. The steps to do a 2D CFAR are first choosing the amount of guard, and training cells per cut. In this case the amount for these variables chosen was:
Training Cells range or in the x-axis. Range is in meters Tr=11; Training cells in the doppler frequency in the y-axis direction Td=9; Guard cells in the range axis. Gr=5; Guard cells in the dopler axis. Gd=3; Offset value to add to noise level. Offset=12
Knowing these values allows me to calculate the size of the matrix I will be building or using to calculate the noise level threshold. I also need to use an offset value which will be added to the average noise level to increase the threshold value to make it higher than the average noise level to make sure to not count noise. The offset value chosen in this instance was "12".
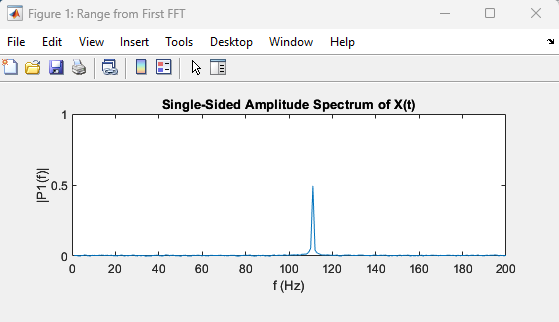
1D fast fourier transform on range axis or range data.
We then loop through the 2D matrix and only count the training cells to measure the noise since we are technically doing a sliding window through out our captured waveform from the radar which was converted to a matrix from a mixed singal by reshaping and applying fast fourier transform to convert it to the frequency domain to be able to see the different types of signals that combined make the overall complex signal. This way it makes it easy to understand which lobes or peaks represent a possible obtject in our data and then converting it to logarithmic scale to be able to see the data easier.
2D fast fourier transform on both range data and doppler data.
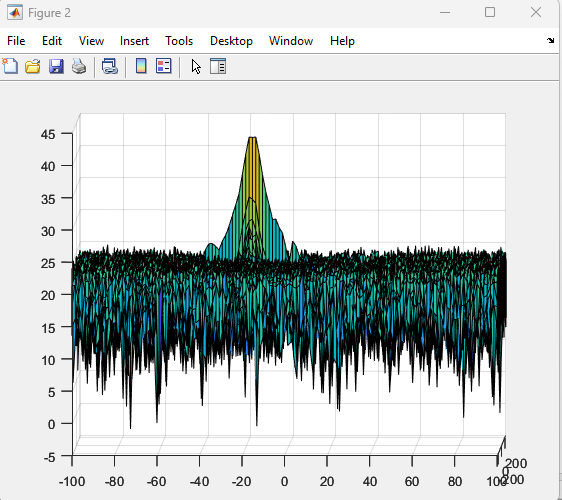
Upon doing this I designed a loop which would apply a sliding window throughout every possible CUT cell in our created Matrix and calculate the average threshold counting all the noise on the training cells.
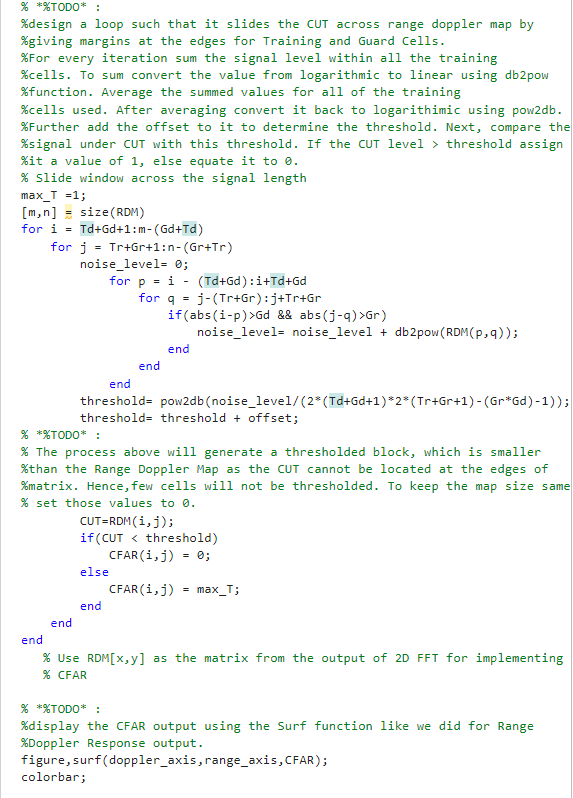
This allows us to see if the CUT or cell under test is an actual object and not noise in the background which is what we don't want. For anything above the threshold we gave it a value of 1 while anyting less than the threshold we gave it a value of 0. This way it's easier to see where the object detected resides in a graph such as below.
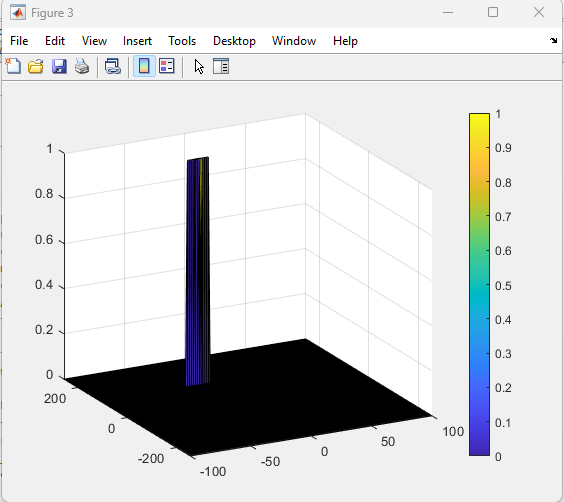
Any non-threshold cells at the edges or training cells were suppressed to be given a value of 0 in a new matrix. This way we supress nonwanted cells that do not meet the critera or are above the threshold chosen. Anything above the threshold was given a value of 1 which means a possible object has been detected that is not noise.
FMCW Waveform Design: -U sing the given system requirements, design a FMCW waveform. Find its Bandwidth (B), chirp time (Tchirp) and slope of the chirp. Bandwidth, chirp time and slope are in code.
Bandwidth : 150000000 Slope Value Calculated: 2.0455e+13 Chirp Time: 7.3333e-06
Simulation Loop:
- Simulate Target movement and calculate the beat or mixed signal for every timestamp. Done in code lines 64 to 97.
Range FFT (1st FFT):
- Implement the Range FFT on the Beat or Mixed Signal and plot the result. Implemented in lines 98 to 130
2D CFAR:
- Implement the 2D CFAR process on the output of 2D FFT operation, i.e the Range Doppler Map. Lines 162 to 230.