All the charts are made on Spyder using the Plotly function.
The following images show the output of the files
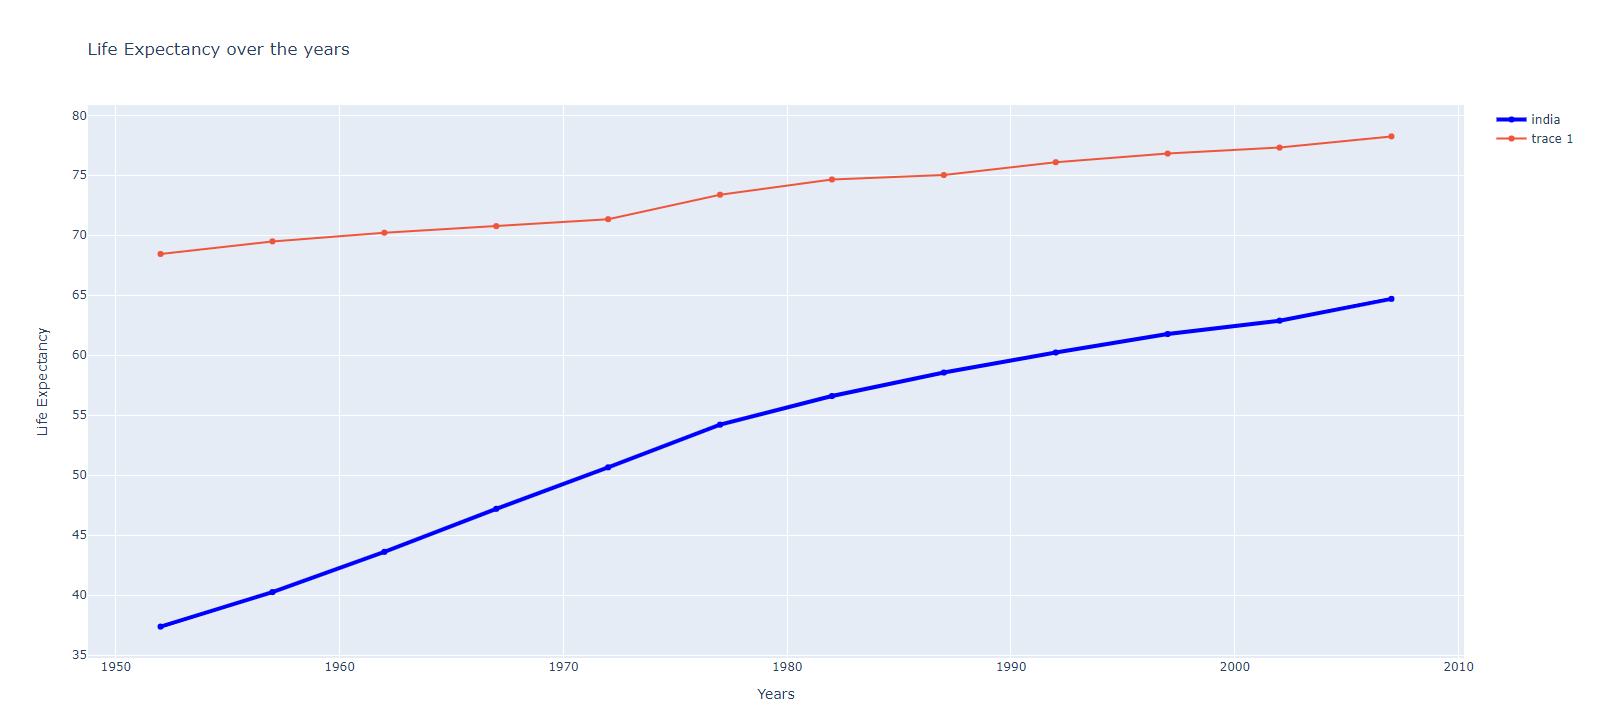
Line Chart
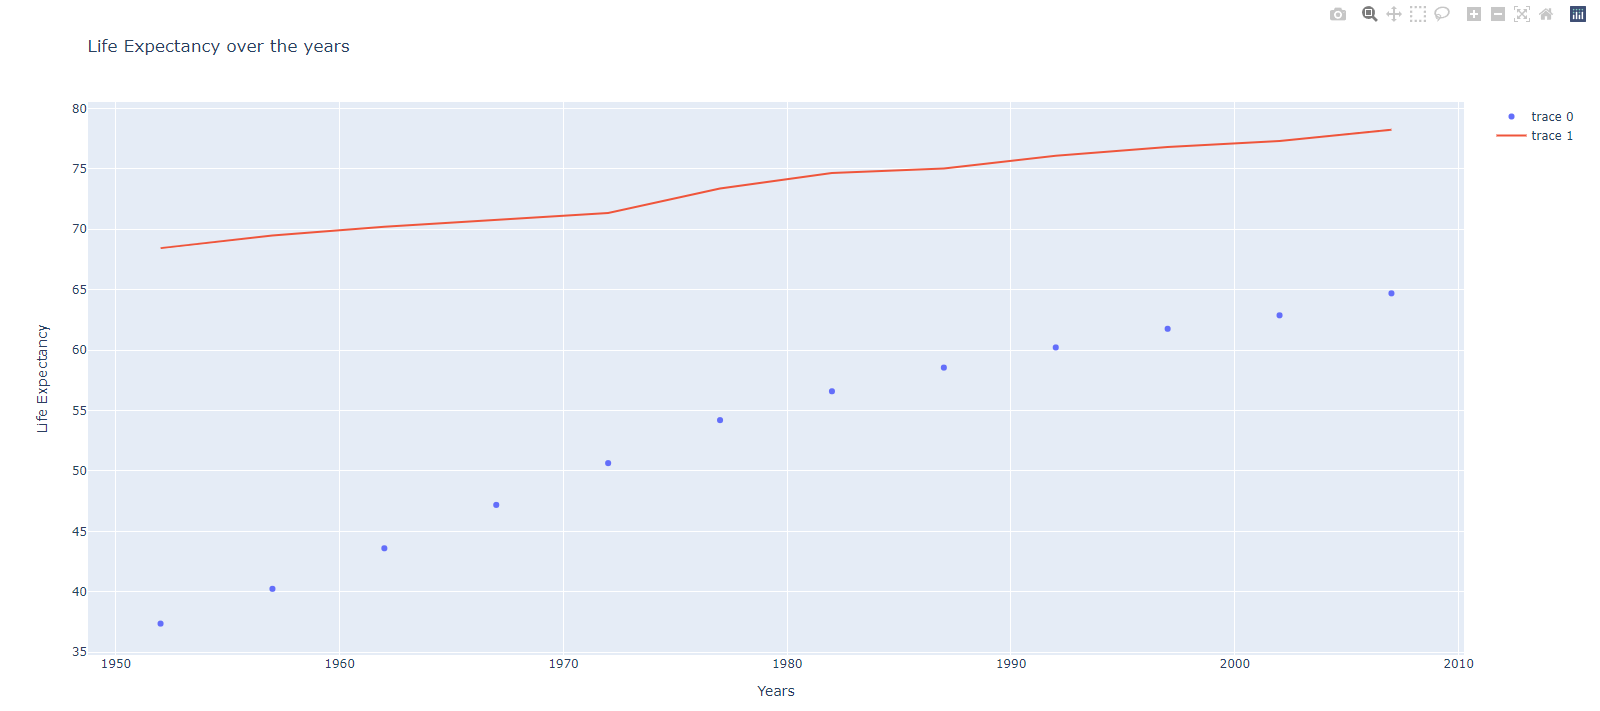
Scatter Chart
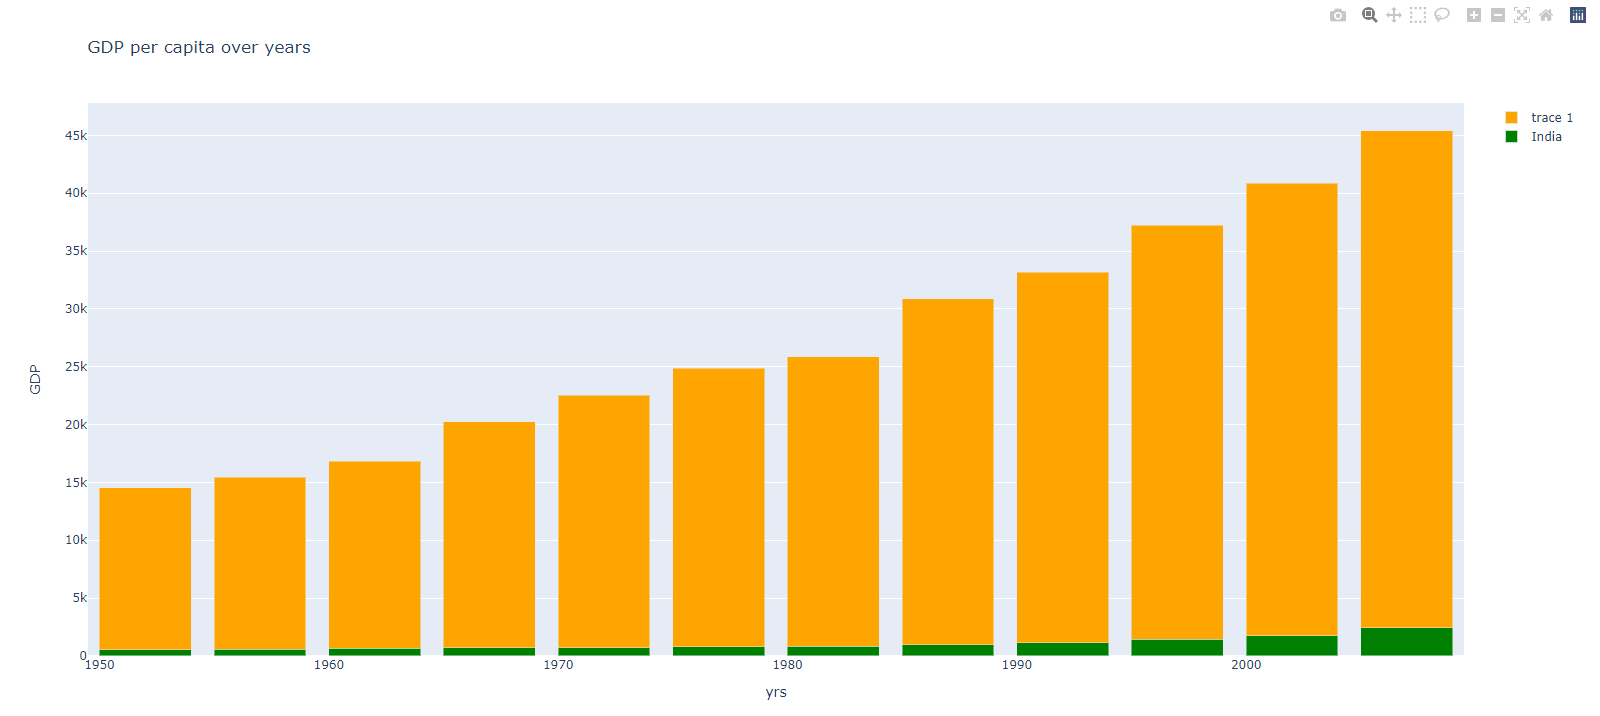
Bar Chart
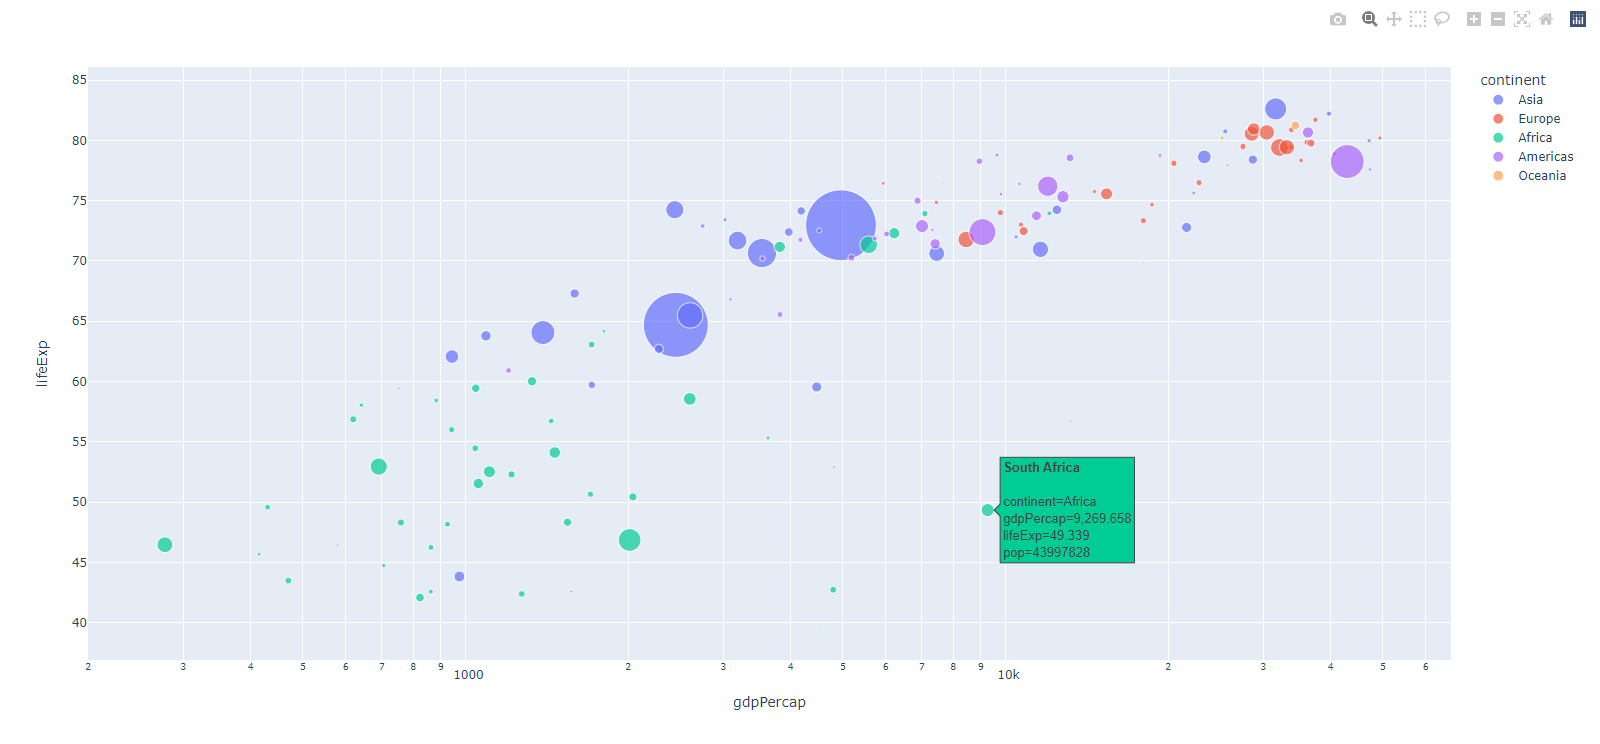
Bubble Chart
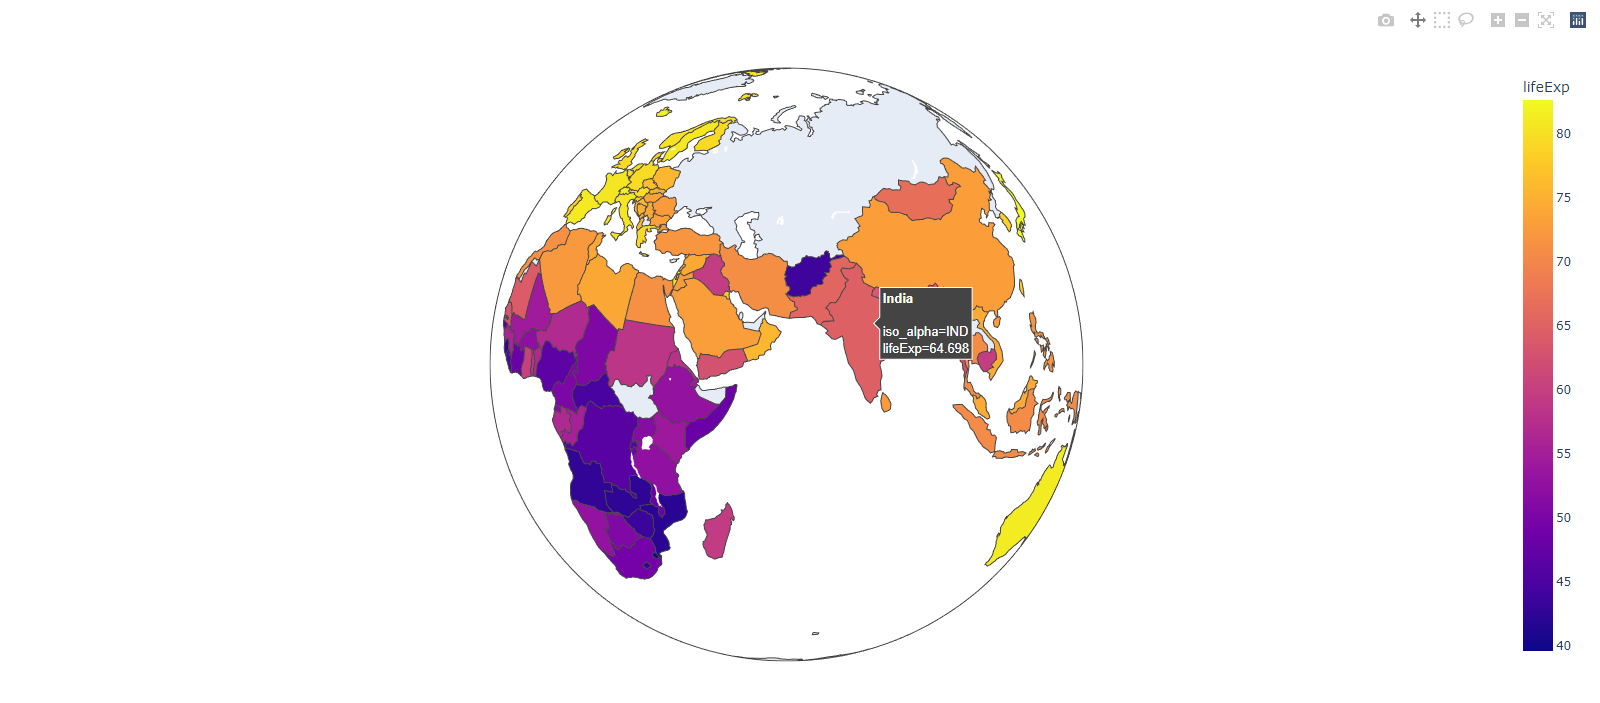
Maps
I learnt these on udemy course : Interactive python dashboards | Plotly Dash 2022 by Anmol Tomar