Python script for scraping electricity scooter subsidy data from Taiwan government websites, cleaning collected data, and analysis.
The repository is for my research on The Effect of Government Subsidy Program on Consumer Behaviours: A Case Study of Electric Scooters in Taiwan. To improve air quality and recude emissions, Taiwan government started providing subsidy to encourage consumers to adopt electric scooter, over gasoline ones.
I want to use data from administration to examine whether electric scooter sales increased after the policy is implemented and whether high subsidy amount correlated with more electric scooter purchase. While the data is available online, I had difficulty extracting the information in desired format (monthly number by city).
The scripts are for automating the data collection process and exporting the results for analysis and visualisation. Getting Started section lists the required software and libraries for running the scripts. Running Scripts explains the function and order of the scripts, as well as the output files. Analysis provides explanations on the policy, including duration, types, eligibility, and more, and summarises the findings from visualisation.
- Subsidy Results from Low Emission Vehicle by the Ministry of Economic Affairs
- Subsidy Results from Environmental Protection Administration
- List of Administrative Divisions of Taiwan from Wikipedia
- Vehicle Registration from the Transportation Highway Bureau
Python is required for running the scripts. In addition, some common libraries, such as csv, time, and calendar, are used. In addition, you should have jupyter notebook or similar interpreter available to be able to run the visualisation script in .ipynb format.
$ pip install <library>I use virtualenv to isolate the environment for the project. However, this is not required to run the script.
$ pip install virtualenv #install
$ mkdir ~/Desktop/Scooter #create project folder
$ touch moea.py #create python script
$ virtualenv venv #create virtual environment
$ source venv/bin/activate #activate virtual environmentDownload ChromeDriver from Choromium, unzip the file and move it from ~/Downloads/chromedriver to /usr/local/bin (mac os) with the following command.
$ mv ~/Downloads/chromedriver /usr/local/binI use pip and install the library with Terminal. Alternatively, you can download the source distribution from PyPI.
$ pip install seleniumFor visualisation, I use plotly to construct my initial interactive graphs. However, since Github renders my script to static html and my graphs were not displaying, I had to install psutil, requests, and orca to export the graphs to png format.
$ pip install plotlyThe scripts can be categoried into three topics, data collection, cleaning, and visualisation. It would be the best to start from data collection, however, I provided a copy of my results in the output folder, and it's possible to skip the initial steps.
If you don't speak Mandarin, the data collection process might be confusing. But this does not affect the scripts and, in clean.py, I translate everything in Mandarin to English. In addition, I have a detailed explanation for subsidy programs in analysis section as the policy is complicated and can be confusing.
Data Collection: MOEA Subsidy moea.py
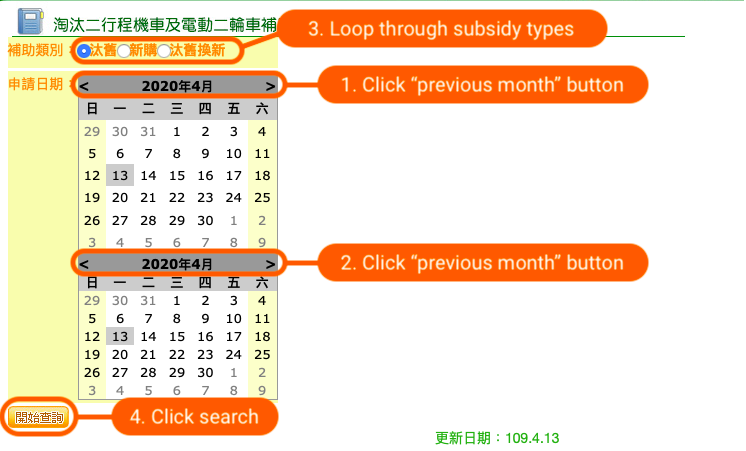
moea.py script automates the process of collecting subsidy application information from MOEA. As shown in graph, the script selects table for output format, iterates through cities, chooses beginning year and month, and clicks research. Once the result is available, iterate through the output HTML table to collect information. After gathering information from all cities, export data to csv file named moea.csv to output folder.
I provided a copy of my result moea.csv, which was done on April 13th, 2020. Please note that dates in time column are placeholder for future aggregation. The data collected are sum of monthly total.
Data Collection: EPA epa.py
epa.py collects subsidy information from EPA. Starting from beginning date and end date datepickers, the script continues to click <, the previous month button, until it reaches August 2015, which is when the policy was implemented. Once done, iterate through three types of subsidy and export data to csv.
I provided a copy of my result epa.csv, which was done on March 31st, 2020. Please note that dates in time column are placeholder for future aggregation. The data collected are sum of monthly total.
Data Collection: City Names Translation city_name.py
city_name.py collected the English and Mandarin name for every city in Taiwan from Wikipedia.
Provided: Subsidy Amount subsidy_amt.csv
subsidy_amt.csv provides the subsidy amount from three administrations. The data was manually collected from the Law and Regulation Database and the Deparment of Environmental Protection (or equivalent agency) of every city.
Data Collection: Scooter Registration registration.py
registration.py collects scooter registration count information by fuel type. Output is available in reg_long.csv and reg_wide.csv formats.
Cleaning: clean.ipynb
clean.ipynb provides details of my data cleaning process to merge moea and epa data and translation.
Visualisation: visual.ipynb & visual_interactive.ipynb
visual.ipynb provides a static version of the visualisation. As Github renders the notebook to static html, the interactive dashboard is not available on Github. The images exported are available in the output directory.
However, you can view visual_interactive.ipynb notebook in nbviewer and enjoy the interactive dashboard.
Two-wheelers are important transportation instrument in urban areas for their flexibility, versatility, and low costs. In Taiwan, scooters became the most popular form of transportation because majority of the commute distance is short, the year-round climate is suitable for riding, the parking is convenient. With 23 millions occupants and nearly 14 million registered scooters, Taiwan has the highest scooter density in the world. The exhausts from scooters, particular gasoline-fuelled scooters, have posed significant threat to the environment and public health.
To encourage adoption of electric scooters (ES), two central government agencies, the Ministry of Economic Affairs (MOEA) and the Environmental Protection Administration (EPA) implemented subsidy programs offering rebatements for ES purchase. That is, new purchases of gasoline scooters (GS) are not eligible for receiving subsidy. MOEA started in September 2012 and EPA started in August 2015. The amount from these two entities are the same across all cities, however, the level changed overtime. In addition, local government started providing extra bonus in August 2015 as well, however, the amount differed across cities.
For the research, I want to find out whether ES sales increased and whether the subsidy influenced the sales.
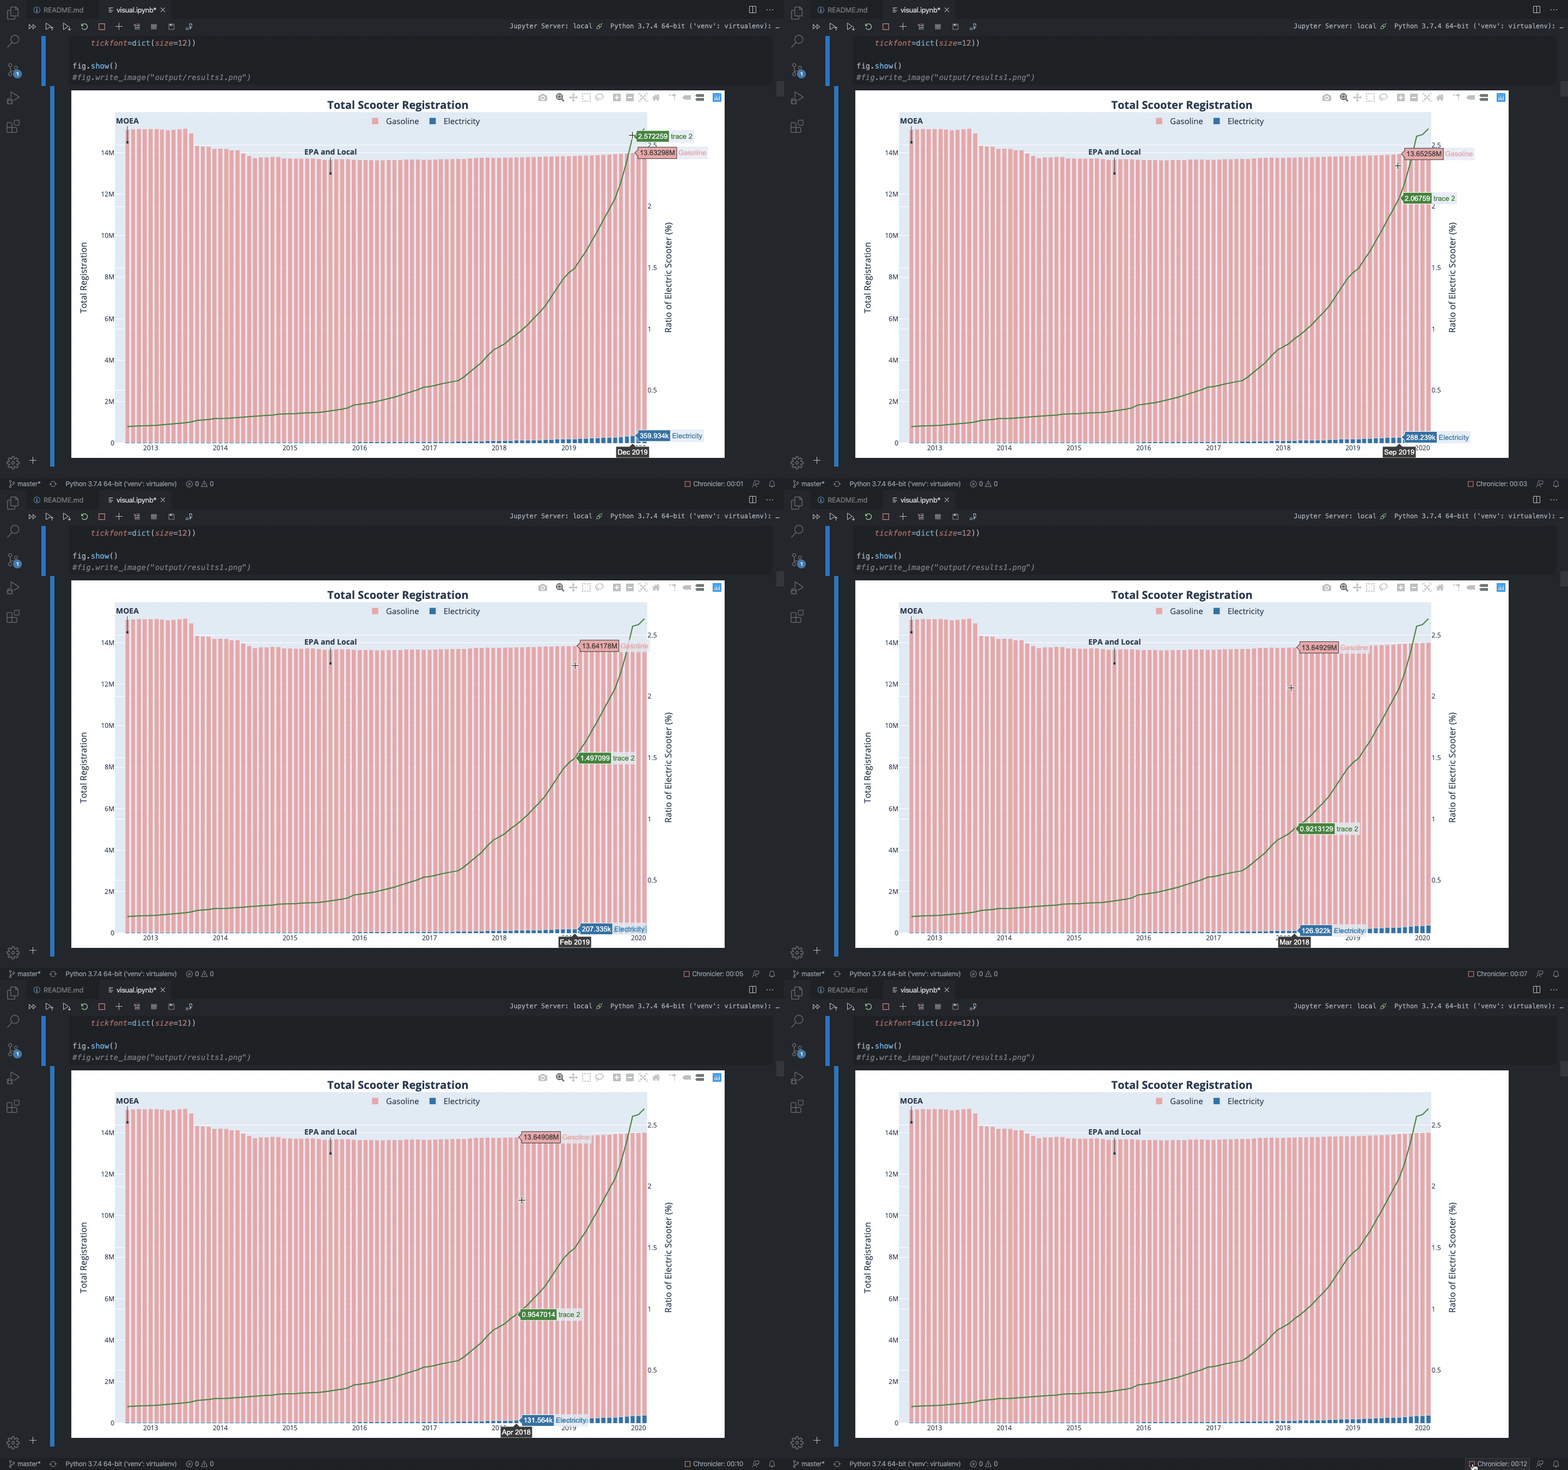
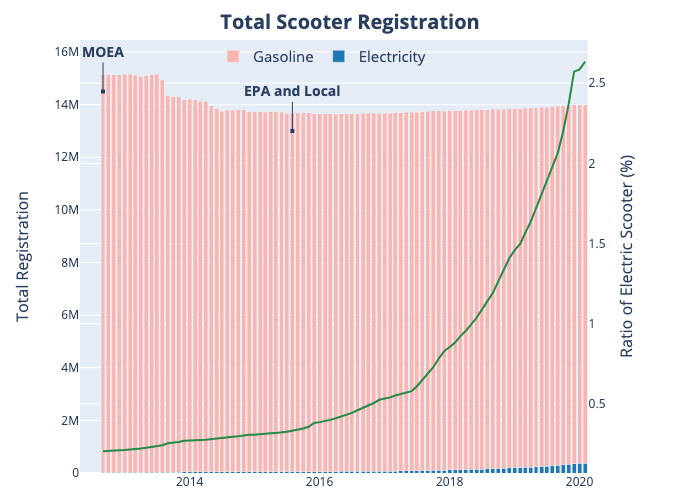 The graph outlines the nationwide monthly number of scooter registration by fuel type from September 2012 to Feburary 2020. The bars represent the count and the line illustrates the proportion of ES of all scooters. Ideally, I have access to data from even earlier time, but prior numbers do not include fuel types.
The total number experienced a sharp decline in 2013, the reason for which is unclear. I believe the government may change the requirement for scooter registration at the time. For example, a scooter registration that had not been renewed for ten years would be cancelled. The number remains stable afterwards.
Looking at the ES proportion, the ratio consistently increase at an increasing rate until Janurary 2020. The line got much flatter. As the subsidy amount was reduced to half of the original in 2020, many consumers decided to purchase new scooter at the end of 2019.
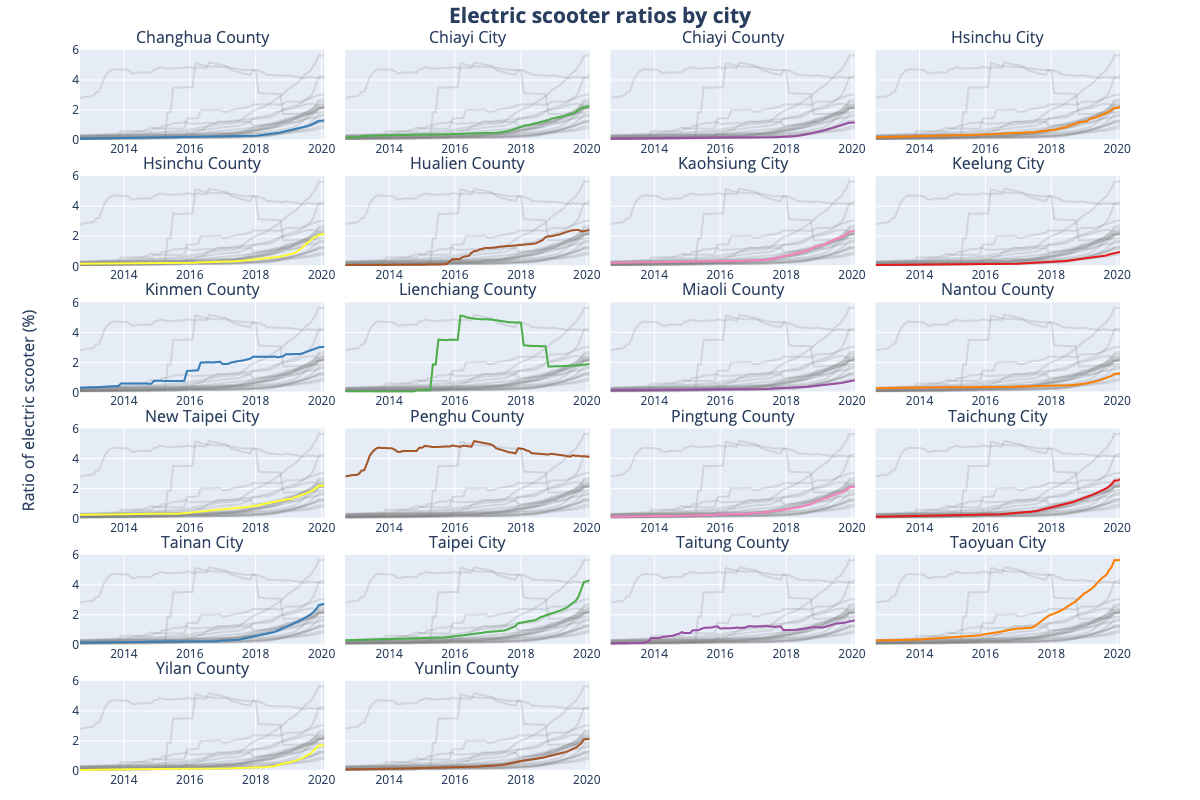
If I look at the ratio for each city, majority followed a similar upward trends. Lienchiang County, Penghu County, and Kinmen County are noticeably different, all of which are outlying islands.
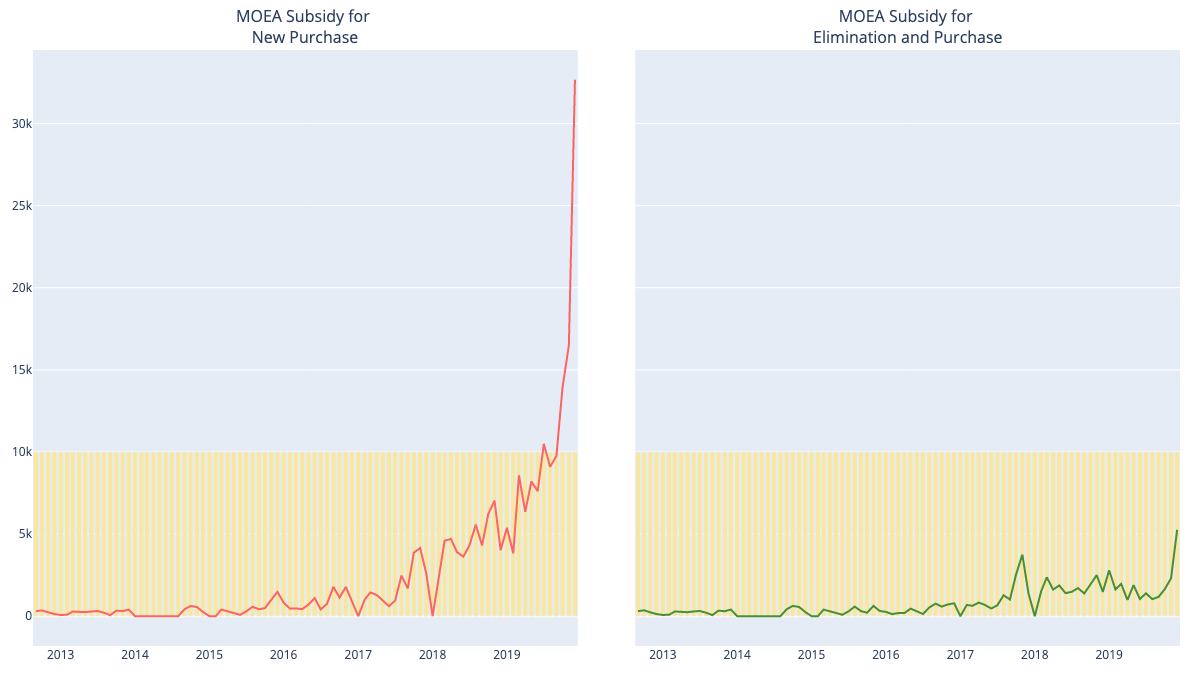
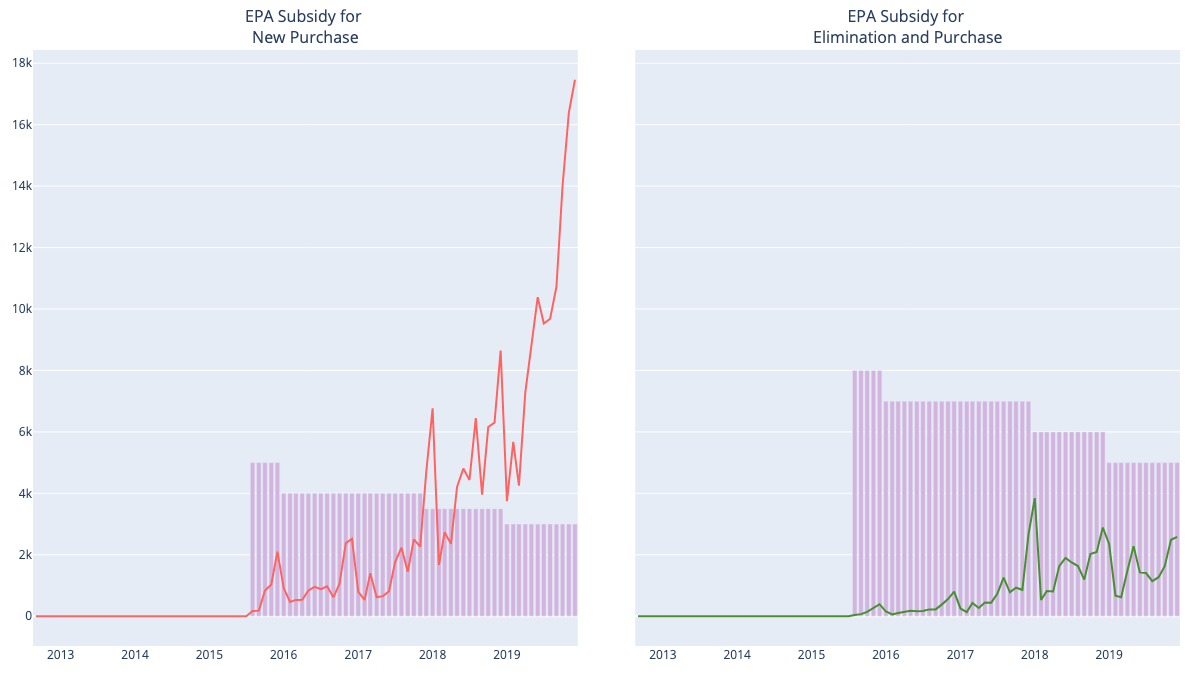
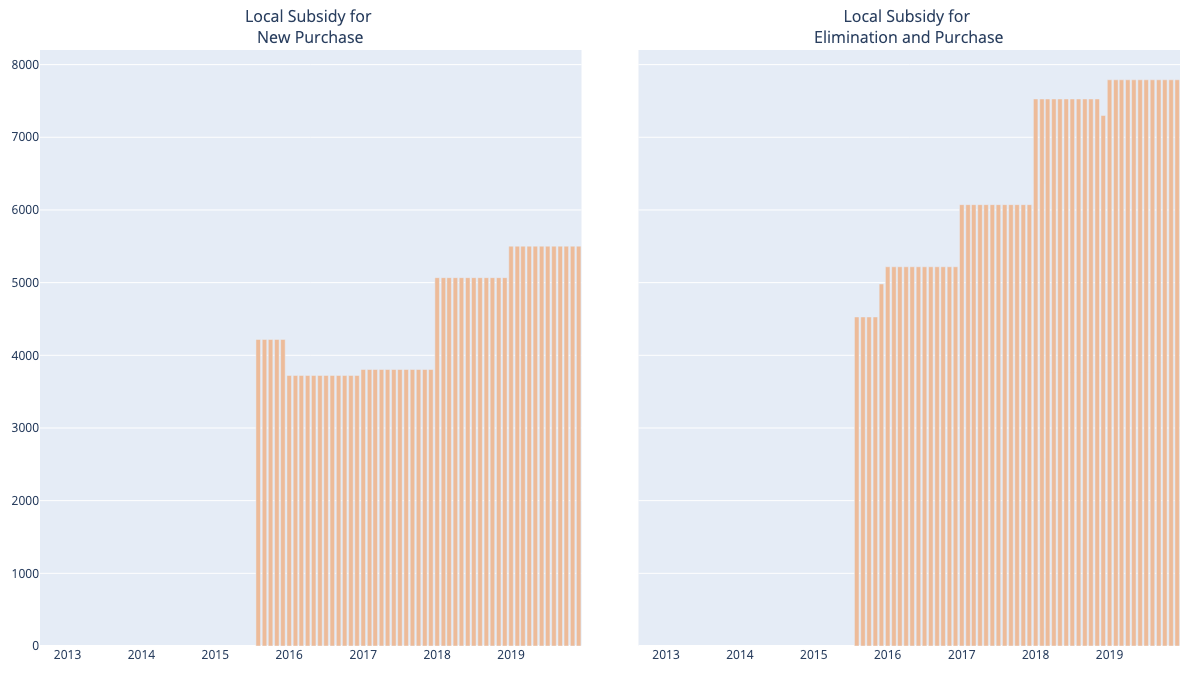
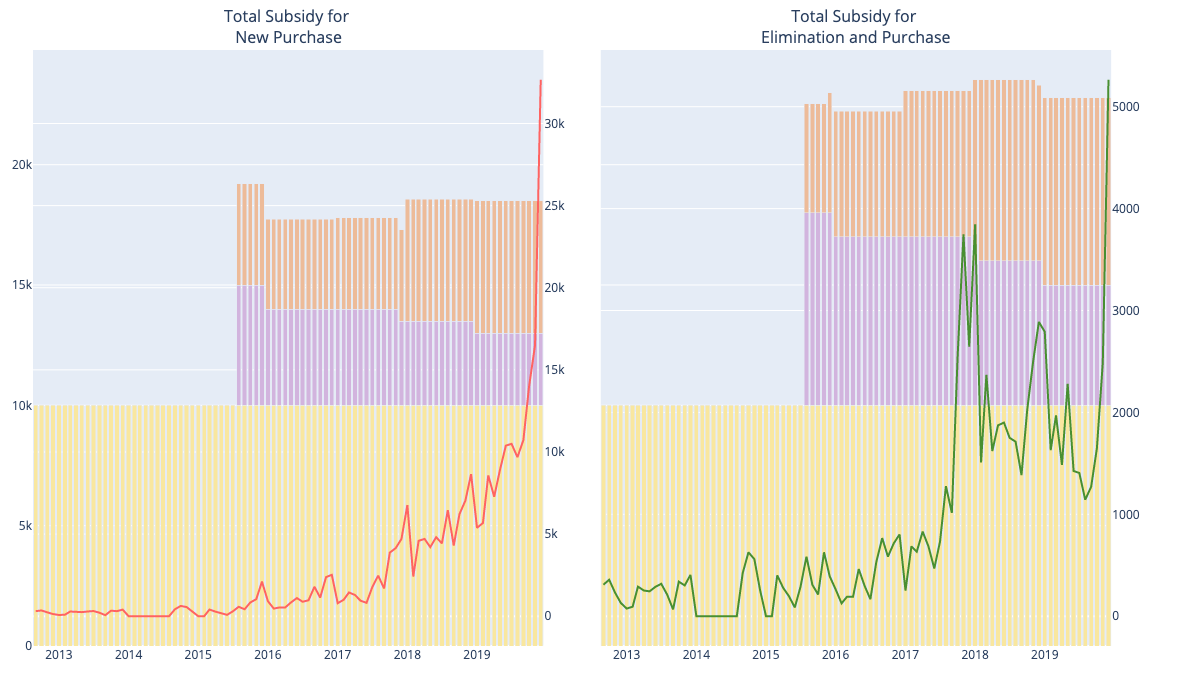
Three graphs above show the subsidy amount and application number from MOEA, EPA, and local government, respectively. Combing all three together, I get the graph below. The bars are the sum of rebatement from three sources and the line is the maximum number of applications between MOEA and EPA, based on the assumption that each eligible purchases apply for all programs.
For New Purchase, the subsidy amount remained relatively stable after August 2015, but the application number continuously climbed to over 30,000 per month. For Elimination and New Purchase, the total amount stayed constant after August 2015, and the number of application fluctuated but generally followed an upward trend. From the graph, I do not think there is a correlation between the amount of subsidy and ES sales. However, as the graph shows the status on a national level, I decided to examine the pattern in each city.
Still, I do not observe a positive correlation between two variables. But without subsidy or only one, the ES sales are low. Thus, I believe the subsidy program can stimulate interest to purchase ES. However, financial incentives are not the only variable.
As the graphs are sufficient for my research paper, I stop exploring the data and visualisation further. However, I would like to examine the relationship between the subsidy and ES sales statistically. With more data on population, income, oil price, and others, I should be able to do a regression analysis. Furthermore, I want to see whether replacing GS with ES reduces pollutants and eventually improves air quality.
- Yu En Hsu, Master of Public Administration Candidate at Maxwell School at Syracuse University - Author and Researcher - Portfolio
- Pete Wilcoxen, Professor, Public Administration and International Affairs at Maxwell School at Syracuse University - Advanced Policy Analysis Instructor - Portfolio
- David Popp, Professor, Public Administration and International Affairs at Maxwell School at Syracuse University - The Economics of Environmental Policy Instructor - Portfolio


