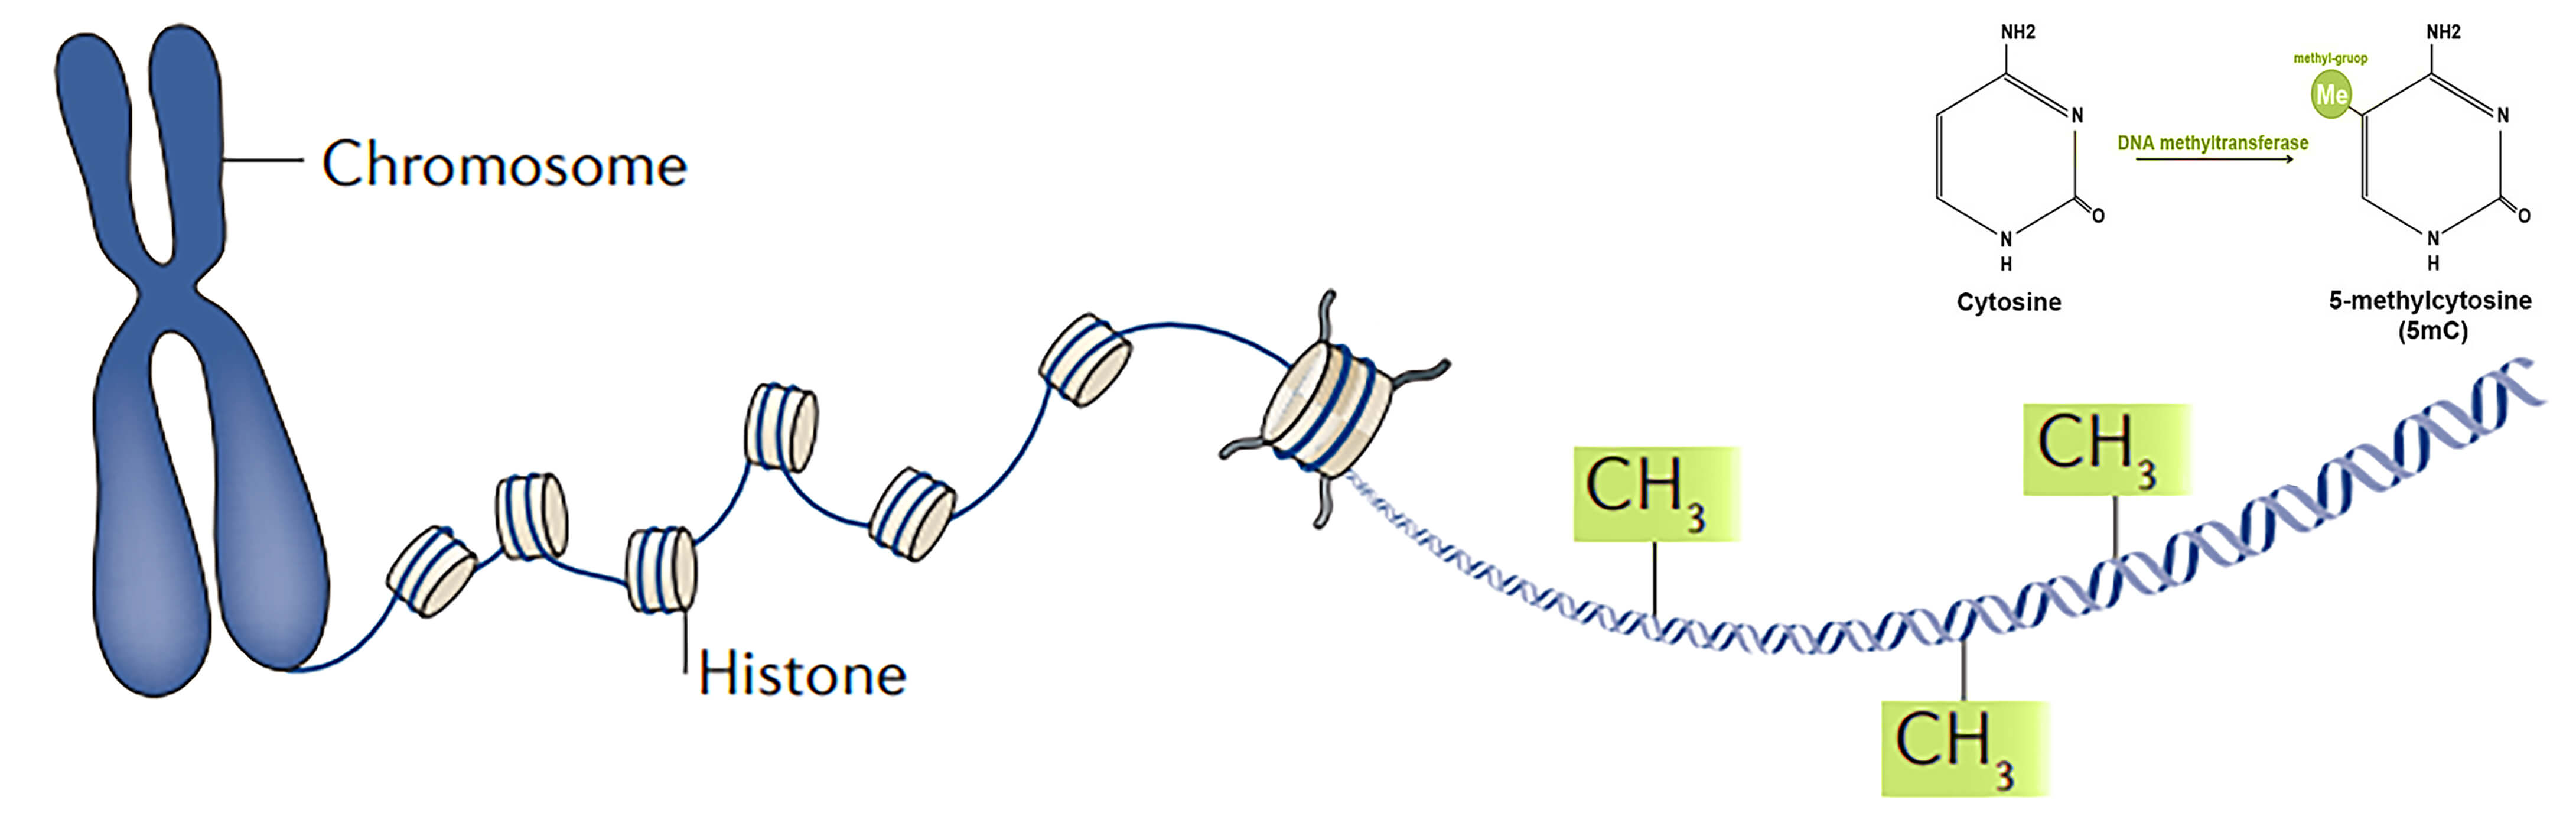
Oncogenic transformation of normal cells often involves epigenetic alterations, such as histone modification and DNA methylation. For this analysis, we obtained a subset of the whole genome bisulfite sequencing (WGBS) data to analyse the pattern of DNA methylomes of normal breast and cancerous breast cells. This workflow is a complete reproduction of the workflow mentioned in the Galaxy training material on Methyl-Seq Analysis.
The datasets we used are mainly a subset of the data from the publication "Hierarchical Clustering of Breast Cancer Methylomes Revealed Differentially Methylated and Expressed Breast Cancer Genes" (10.1371/journal.pone.0118453).
wget https://zenodo.org/record/557099/files/subset_1.fastq?download=1 wget https://zenodo.org/record/557099/files/subset_2.fastq?download=1- Download the FastQC module
Note: FASTQC requires java and javac installed for implementation and you need to run the fastqc file from the folder (using the relative/absolute links to the sequence reads)
sudo apt install default-jre sudo apt install default-jdkMake the “fastqc” an executable file
chmod 755 fastqc- Run the fastqc on all sequenced reads from its folder
fastqc subset_1.fastq?download=1 subset_2.fastq?download=1If you open the html files you will see the result as follows-
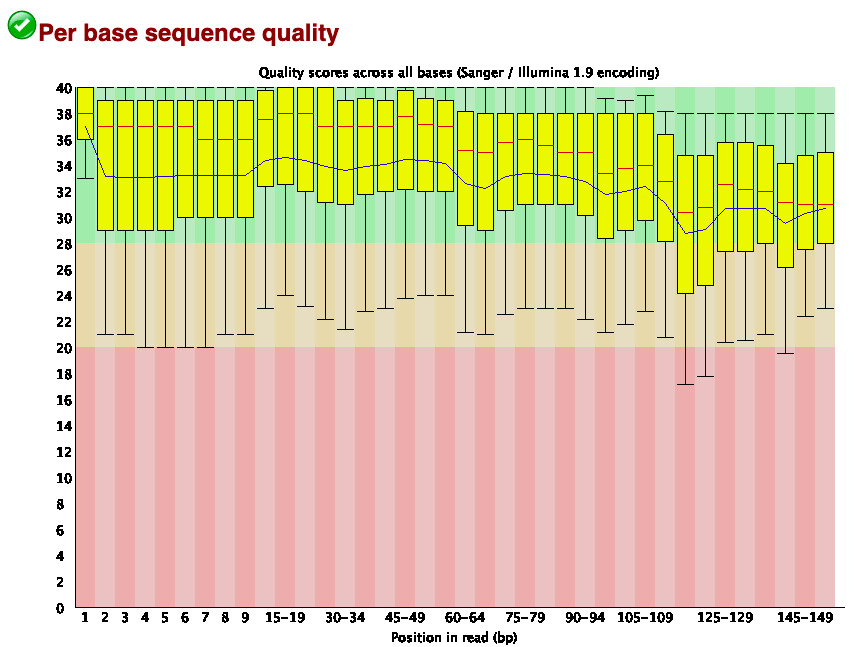
This tells that the per base sequence quality was quite good for the datasets. The mean quality of reads (indicated by the blow lines) showed that even the lowest score is above 28.
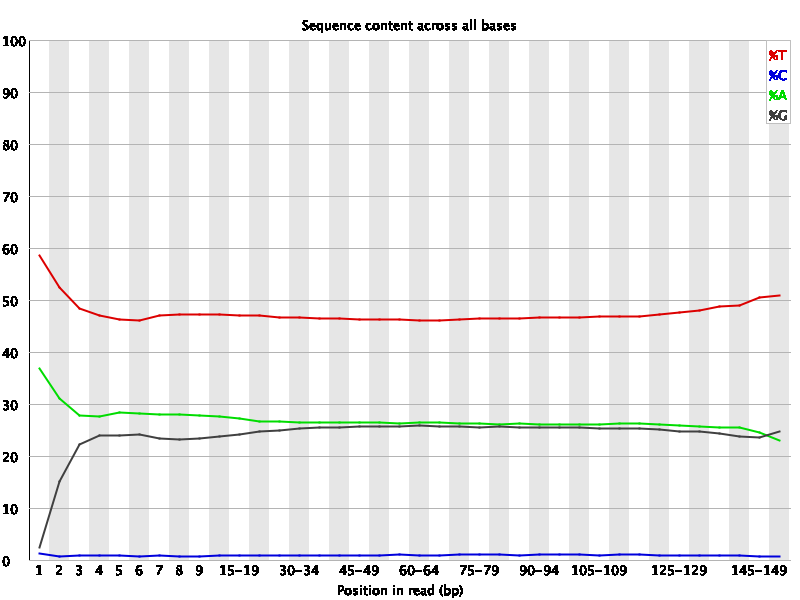
The “per base sequence content” segment from the fastq reports shows a drop of “C” and a rise of “T” bases. It’s because- Every C-meth stays a C and every normal C becomes a T during the bisulfite conversion.
Mapping of bisulfite-sequencing reads needs different aligners from the normal NGS sequencing read aligners. As in a BS-seq reads, all the C’s are C-meth’s and a T can be a T or a C, the mapper for methylation data needs to find out what is what. Bismark is such a suitable aligner for BS-seq reads. Due to the memory shortage of our device, we will use only Chromosome_1 as our reference genome for aligning reads.
Download reference genome
wget http://ftp.ensembl.org/pub/release-104/fasta/homo_sapiens/dna/Homo_sapiens.GRCh38.dna.chromosome.1.fa.gzDownload Perl (a prerequisite for Bismark)
conda install -c bioconda perl-lwp-simpleDownload Bismark
conda install -c bioconda bismarkCreate a folder for moving the chr1 reference genome into that
mkdir genome_folderNow move the chr1 reference genome file
mv Homo_sapiens.GRCh38.dna.chromosome.1.fa.gz genome_folder/Create indexing of chromosome 1 using bismark
bismark_genome_preparation --verbose genome_folder/Time for mapping
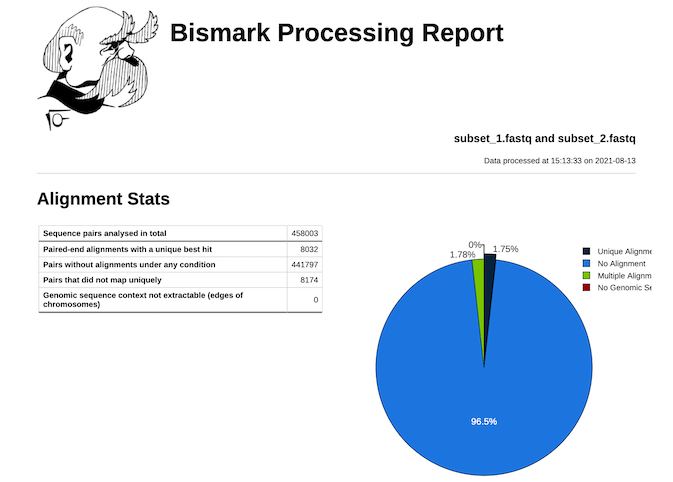
Bismark -genome genome_folder/ -1 subset_1.fastq?download=1 -2 subset_2.fastq?download=1bismark_methylation_extractor -p -- no_overlap file_1.fastq_bismark_pe.bamBismark generates a .bam file as its final output. The alignment stats from the Bismark tool is as follows. As we used only Chr1 as our reference genome, it is showing the largest part of the reads for no alignment.
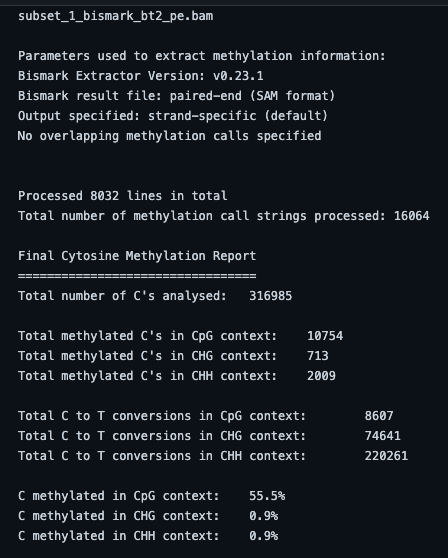
MethylDackel needs a sorted bam file for its execution. For that, Samtools is used to generate a sorted bam file from the output bam file of aligner.
Install SamTools
conda install -c bioconda samtoolsSort the output file from alignment with Samtools
samtools sort subset_1_bismark_bt2_pe.bam -o bam_sorted_by_samtools.bamMethylation bias plot is helpful for looking at the distribution of methylation and searching for any possible bias.
Install MethylDackel
conda install -c bioconda methyldackelNow Plot the Methylation Bias
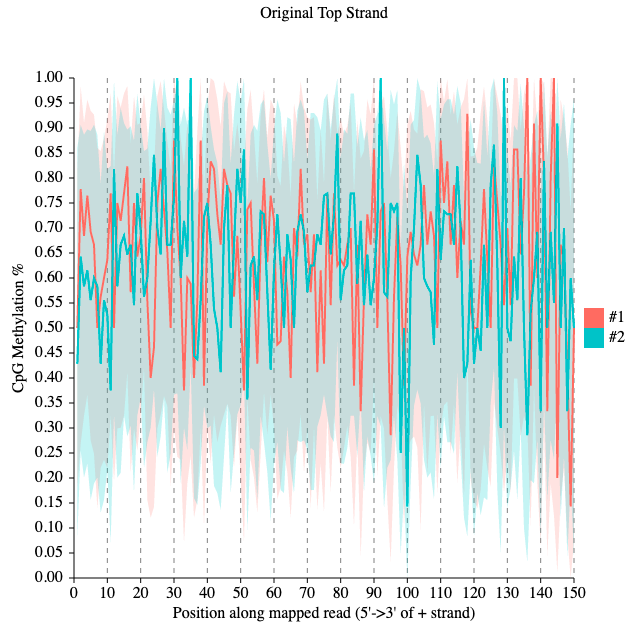
MethylDackel mbias Chr1_ref.fa.gz bam_sorted_by_samtools.bam methylation_bias_by_methylDackelThis plot shows distribution of the CpG methylation here is a bit biased along the genome which is not expected. If we were to trim the reads, we would include roughly the positions 0 to 134, for the both strands just to exclude the most biased part from the 3' end. The difference of DNA methylation pattern between the two datasets are clearly visible.
To extract the methylation on the resulting BAM file of the alignment step
MethylDackel extract --mergeContext Chr1_ref.fa bam_sorted_by_samtools.bamBedGraph-to-bigWig was used to convert the Bedgraph file containing methylation level to a bigwig file
Install bedGraphtoBigWig
conda install -c bioconda ucsc-bedgraphtobigwigNow run the following commands-
awk 'NR!=1' bam_sorted_by_samtools_CpG.bedGraph > out_from_bigwig.deheader.bedGraph sort -k1,1 -k2,2n out_from_bigwig.deheader.bedGraph sort -k1,1 -k2,2n out_from_bigwig.deheader.bedGraph > sorted.bedGraphCreate a file named Chr1.chrom.sizes and write the size of Chromosome 1 in that in a tab delimited style
nano Chr.chrom.sizesCopy chr1 249250621 to the file, save and exit. And then run-
awk '{print $1,$2,$3,$4}' sorted.bedGraph > final_sorted_with4.bedGraph bedGraphToBigWig final_sorted_with4.bedGraph Chr1.chrom.sizes final_output_from_bigwig.bwDeeptools contains several helpful tools for helpful visualization, including ComputeMatrix and plotProfile. With CpG islands data as regions to plot, ComputeMatrix helps to convert the bigwig file into a matrix file.
conda install -c bioconda deeptools computeMatrix scale-regions -S final_output_from_bigwig.bw -R CpGIslands.bed -b 1000 -out output_from_ComputeMatrixFinally, the methylation level of our data around the transcription start site (TSS) was plotted with plotProfile.
plotProfile --matrixFile output_from_ComputeMatrix --outFileName output_from_plotProfile 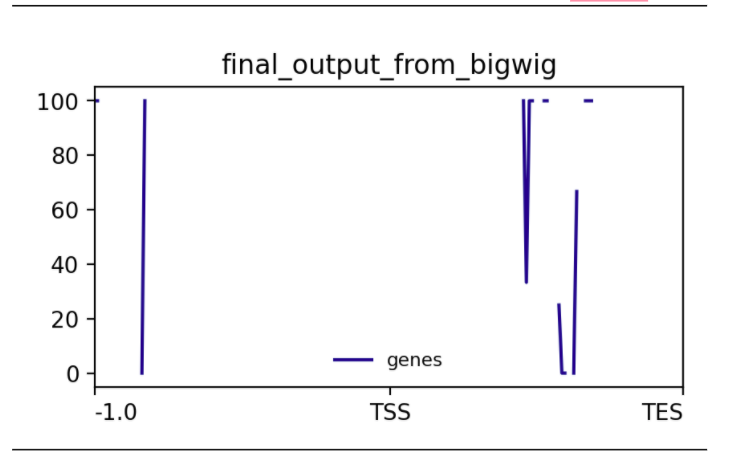
This plot shows the methylation level around all Transcription Start Sites of chrosome_1. When located at gene promoters, DNA methylation is usually a repressive mark.
- Lin, I.-H., D.-T. Chen, Y.-F. Chang, Y.-L. Lee, C.-H. Su et al., 2015 Hierarchical Clustering of Breast Cancer Methylomes Revealed Differentially Methylated and Expressed Breast Cancer Genes (O. El-Maarri, Ed.). PLOS ONE 10: e0118453.
- Ramírez, Fidel, Devon P. Ryan, Björn Grüning, Vivek Bhardwaj, Fabian Kilpert, Andreas S. Richter, Steffen Heyne, Friederike Dündar, and Thomas Manke. deepTools2: A next Generation Web Server for Deep-Sequencing Data Analysis. Nucleic Acids Research (2016). doi:10.1093/nar/gkw257.
- Joachim Wolff, Devon Ryan, 2019 DNA Methylation data analysis (Galaxy Training Materials). https://training.galaxyproject.org/training-material/topics/epigenetics/tutorials/methylation-seq/tutorial.html Online; accessed Mon Aug 23 2021
- Batut et al., 2018 Community-Driven Data Analysis Training for Biology Cell Systems 10.1016/j.cels.2018.05.012
- Krueger, Felix, and Simon R. Andrews. “Bismark: A Flexible Aligner and Methylation Caller for Bisulfite-Seq Applications.” Bioinformatics, vol. 27, no. 11, 2011, pp. 1571–1572., doi:10.1093/bioinformatics/btr167
- Devon Ryan, 2021 dpryan79/MethylDackel: A (MOSTLY) UNIVERSAL METHYLATION extractor For BS-seq experiments, https://github.com/dpryan79/MethylDackel
We acknowledge the HackBio Team for the platform created to bring us all together learning and working as a team progressively on a bioinformatics track.