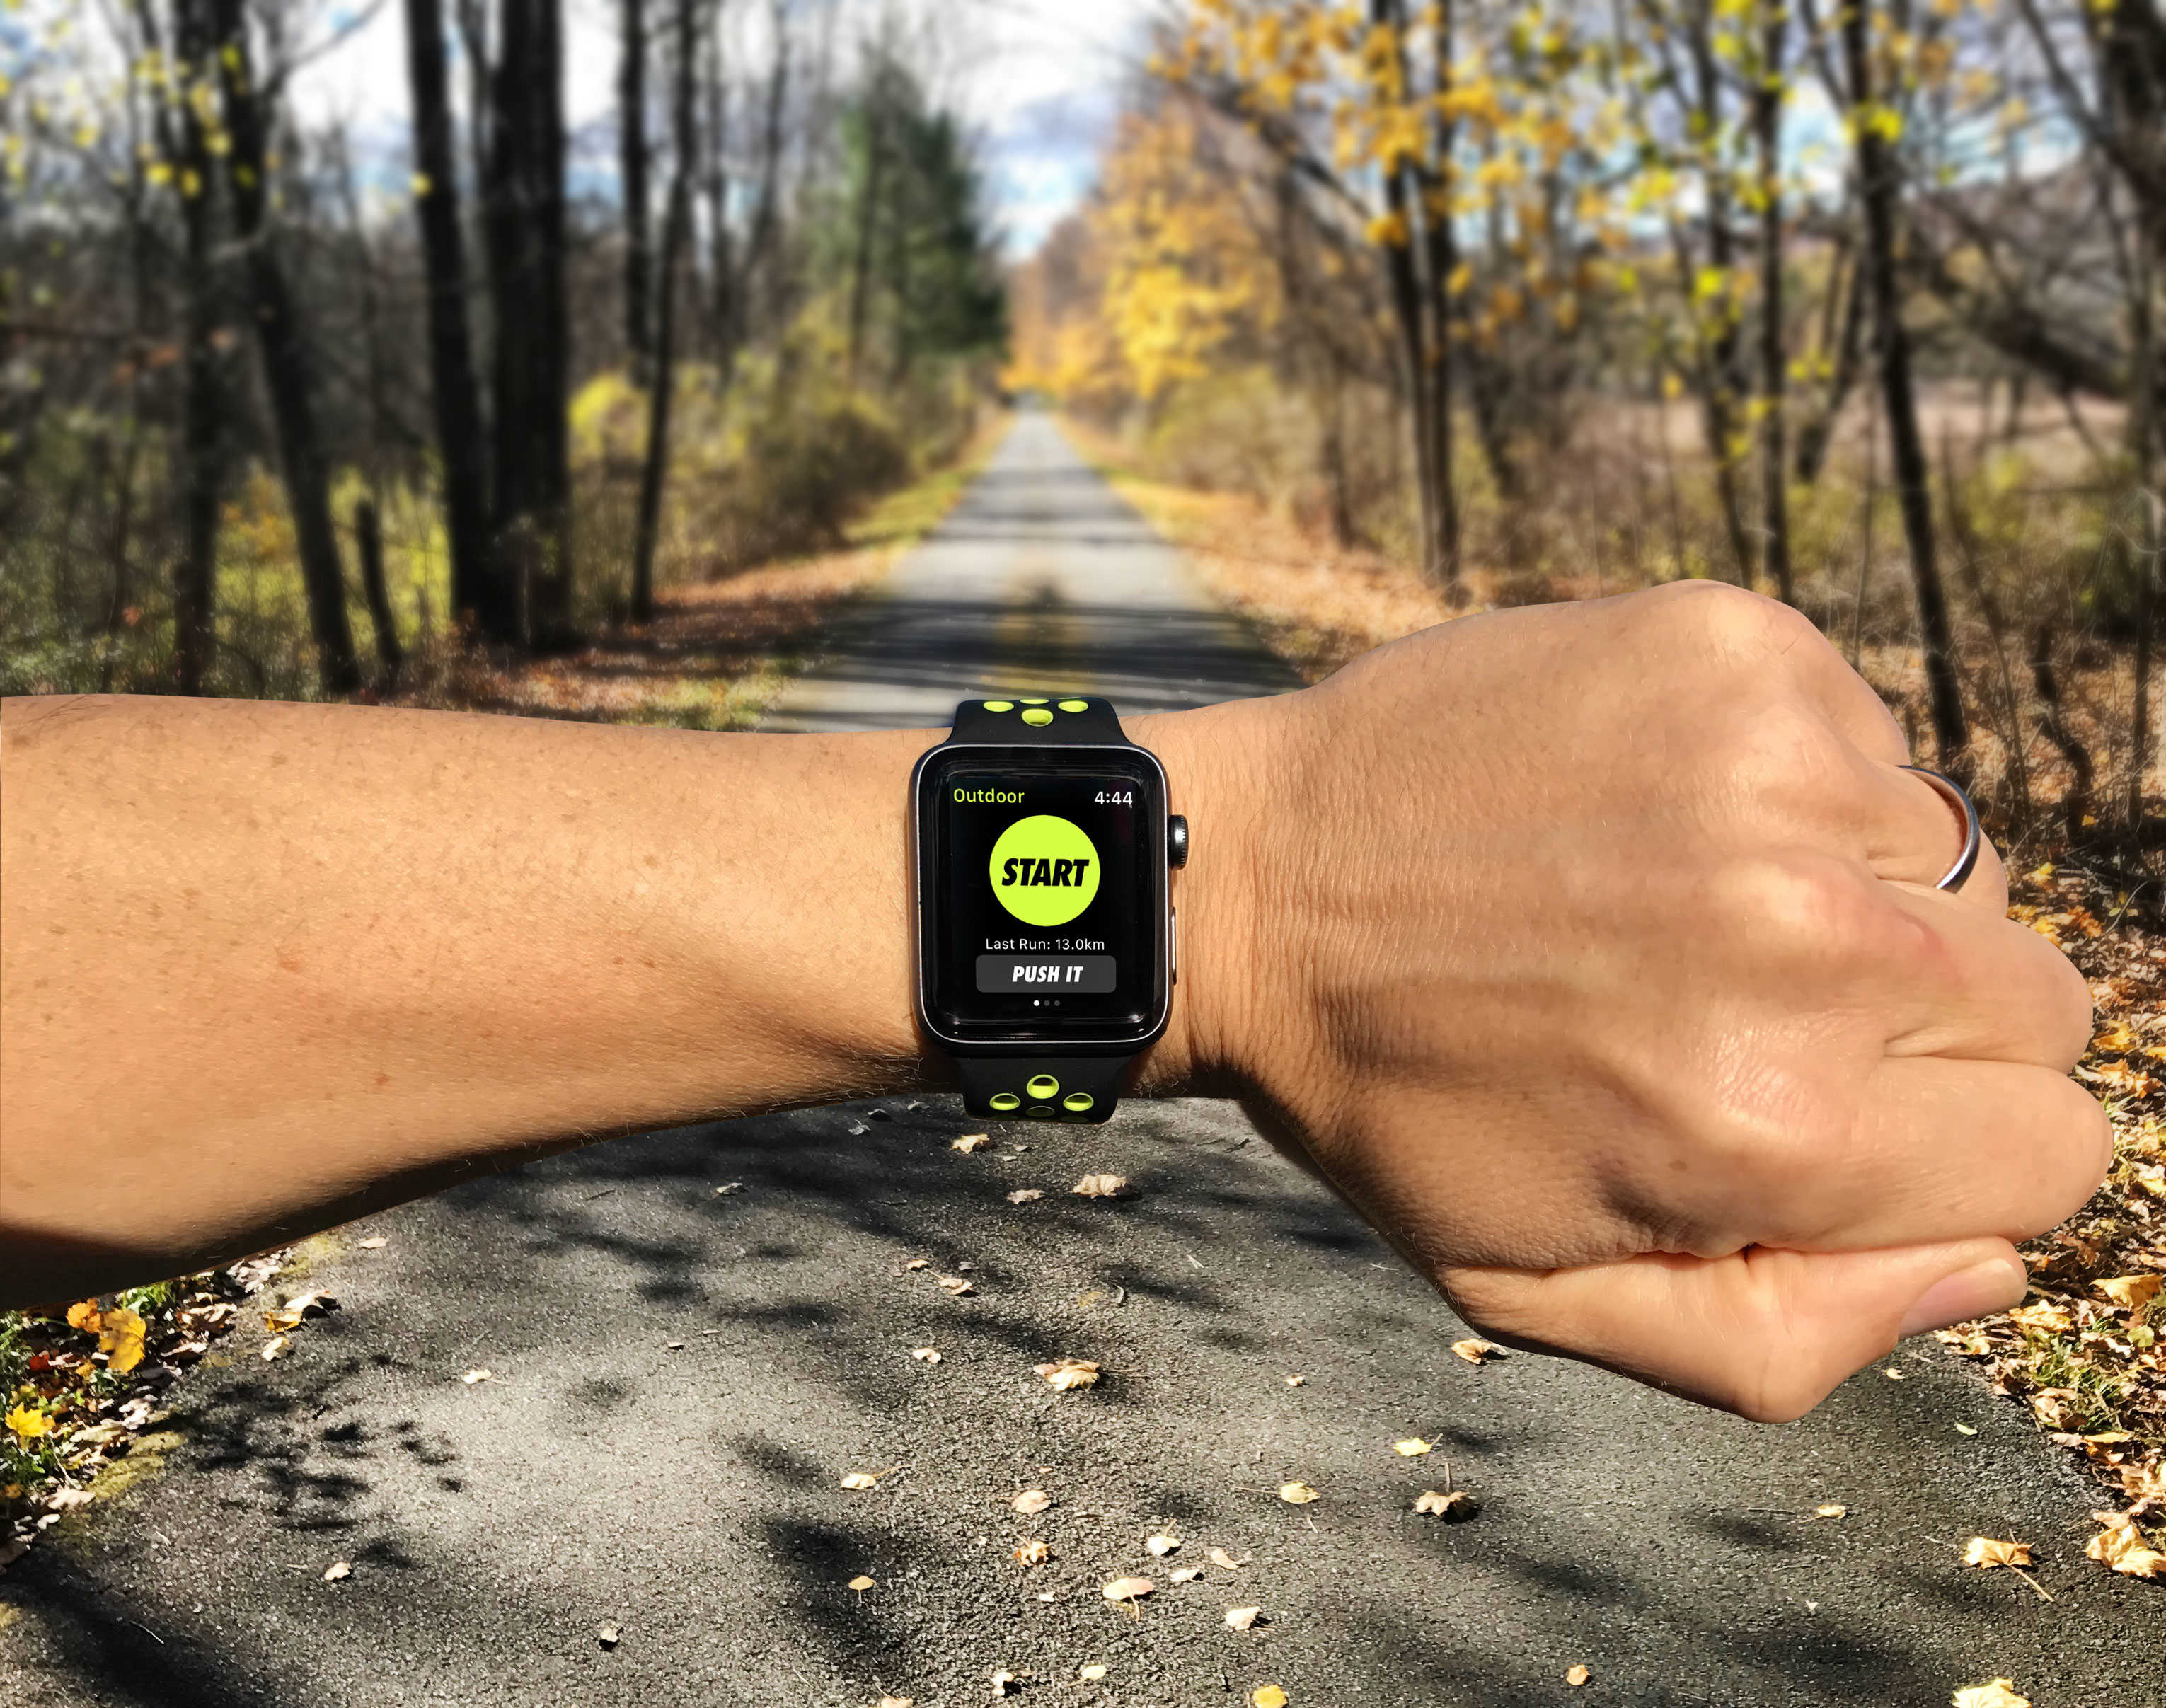
In nearly every smartphone or smart watch, you can find either an accelerometer or a gyroscope that is used to collect health data. They are how a Fitbit or Apple’s health app track your steps and other met. Using data from accelerometers and gyroscopes from those devices, this project creates a model to detect what activity someone is doing at a point in time. Two different model architectures were employed, one to classify a type sereis as its correct class, one to predict changes in action along a single time series.
This project addresses the growing use of electronic means of tracking exercise. It uses a multifeature approach to detect different human activities in time series data. This type of model is crucial to the growing field of exercise tracking widely used today by our smart devices to accurately log time spent doing different exercises and tasks.
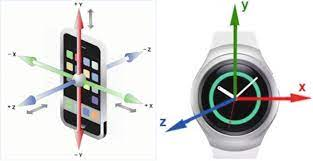
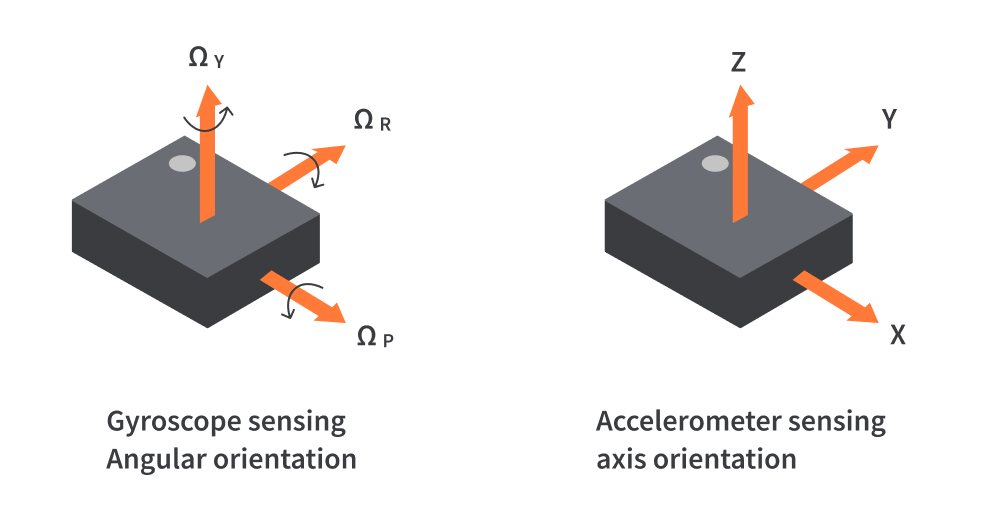
The data is from a the WISDM (Wireless Sensor Data Mining) Lab at Fordham University and is collected from accelerometers and gyroscope sensors from a smartphones and a smartwatch equipped with both. There were 51 participants, which each participant performing 18 different activities for roughly 3 minutes each for a total of 54 minutes of data per participant. Each participant’s data was stored in .txt files, one for each sensor per device. Each device captures a numeric reading in the X, Y, and Z planes. Accelerometers measure acceleration, while gyroscopes measure angular velocity.
Activities included both hand-oriented activities (typing) and non-hand-oriented activities (jogging ) from a diverse selection of actions. The accelerometers and gyroscopes were programmed to sample at a rate of 20Hz (20 readings per second), but upon looking at the data, there is much inconsistency in the individual sampling rates among the four sensors.
For instance, for a particular participant, there would be variation in the amount of individual data points among the samples from the same device (smartphone, smartwatch) and across decides (gyroscope in the smartwatch vs gyroscope in the smartphone). Additionally, the timestamps did not align between the phone and the watch data, although the experiment documentation clearly states that the data was collected synchronously between the two. Additionally, the time stamps were incorrectly encoded in Unix time, as conversion to DateTime format would have indicated them occurring in different years.
To address these inconsistencies, I looked at the Unix timestamps at which number indicated one second by referring to the 20Hz frequency rate, and averaged to a fraction of a second across each of the sensors. This method standardized the length of each participant’s data so that across each sensor (e.g. phone accelerometer and gyroscope), there were the same amount of data points, while between devices (phone vs watch) there were roughly the same amount of entries.
At this point, as the project used two different model architectures, data preparation was split.
The aim of this model is to predict which activity a time series demonstrates, one time series per action. Each participant’s data was subdivided into a separate time series for each distinct activity they performed, and then these were zero padded to the length of the max sequence, leading to a total of 907 unique sequences. Softmax functions were used in the final dense layer of each model because this is a classification problem.
The aim of this model was to predict which activity someone is doing at each point in time along a series. The key difference is that activities change within an individual time series entry. After standardizing the length among each participant with zero padding, I divided each participant’s data into 9 equal length sequences, leading to a total of 459 individual sequences.
For both models, activity labels were One Hot Encoded, though the first model has one matrix for each sequence, while the second model has a matrix for each timestamp.
LSTM (Long Short Term Memory) models were used for both tasks, in slightly different forms. LSTM layers work by using forget gates to determine which information is relevant and forgetting the nonessential information, and then learns from these determinations by updating the cell state. Categorical crossentropy loss functions were used because this is a multiclass classification problem.
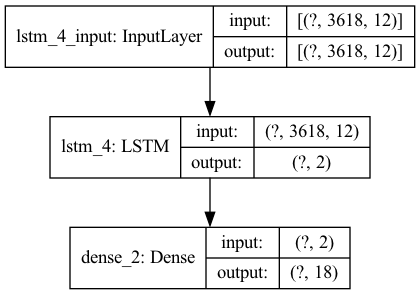
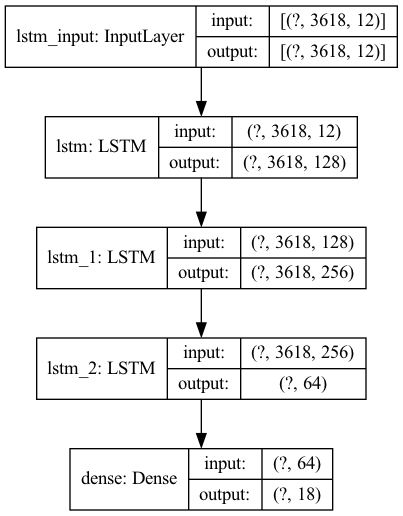
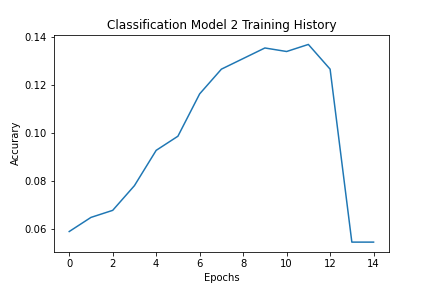
Data was train and test split, then scaled using Standard Scaler fit to the training set. A baseline Sequential model was created with a LSTM layer into a dense layer, and then a more robust model using more LSTM layers was created. Below is the final model architecture. The highest accuracy achieved in training the model was 0.1265, but the final did overtrain as seen in the graph before the callback function stopped it at a decrease in accuracy of 0.0544. Surprisingly, the more basic model performed better than the more complex one on both the test data (0.0617 vs. 0.0396) and the training data (0.2088 vs 0.0544). This is likely due to overfitting, perhaps due to the significant increase in complexities because of the greater number of LSTM layres with larger values.
Model 1
Model 2
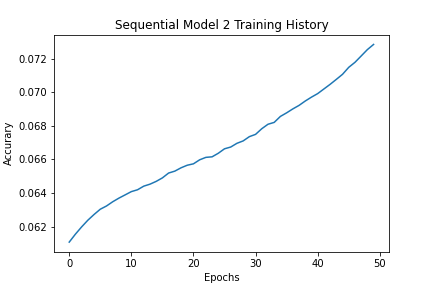
Model 2 Accuracy
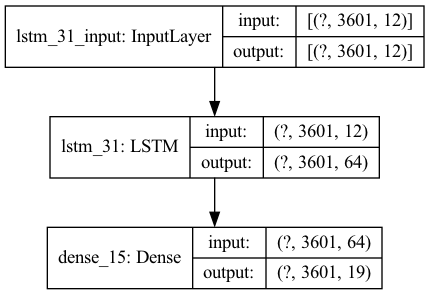
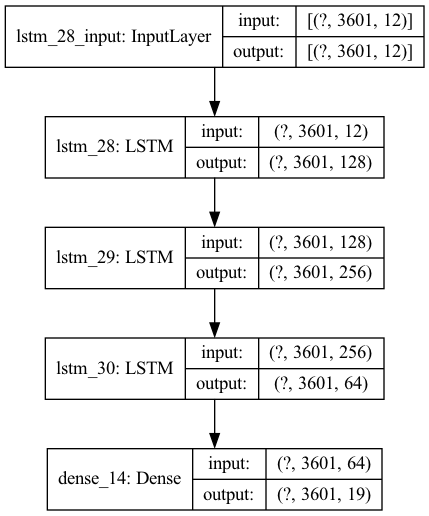
The data preparation followed the same workflow as in the classification model, but this model was state prediction at each point in time, rather than on an entire time series. Both a basic LSTM and a more robust LSTM model were created. Once again, the more complicated model performed less well than the simpler model with one LSTM layer and one Dense layer. The training and test scores decreased from 0.0846 and 0.0531 to 0.0728 and 0.0410, respectively. And as opposed to the classificaiton model, the callback funciton stopped the more complex model before it significantly overtrained.
Model 1
Model 2
Model 2 Accuracy
Overall, the models performed significantly less well than expected. My hypothesis is that the data lost too much granularity when it was downsampled and average to fractions of second in order to address the inconsistencies of the sampling rates. The more complex ones were not as successful as more simple LSTM model archiectures.
In order to improve results, next steps include either resmapling the WISDM dataset choosing a sampling rate to standardize lenght instead of an aggregation method OR testing the model with different accelerometer and/or gyroscope data.
For the classification and state prediection models, a model more complex than the simple one but still less complicated than the final model should be constructed and evaluated. Hopefully this would avoid overtraining but capture more of the data's patterns.