This project has three distinct parts.
Part 1 utilizes the Alpaca API to retrieve data for stocks, bonds, oil, gold, ETF's and cryptocurrencies. It returns the closing day prices for all of the predetermined assets. Once the data is retrieved it is fed into Panda's dataframes and various assets classes are combined into their own dataframe to represent a portfolio of those given assets. This represents the input for the second part of the project.
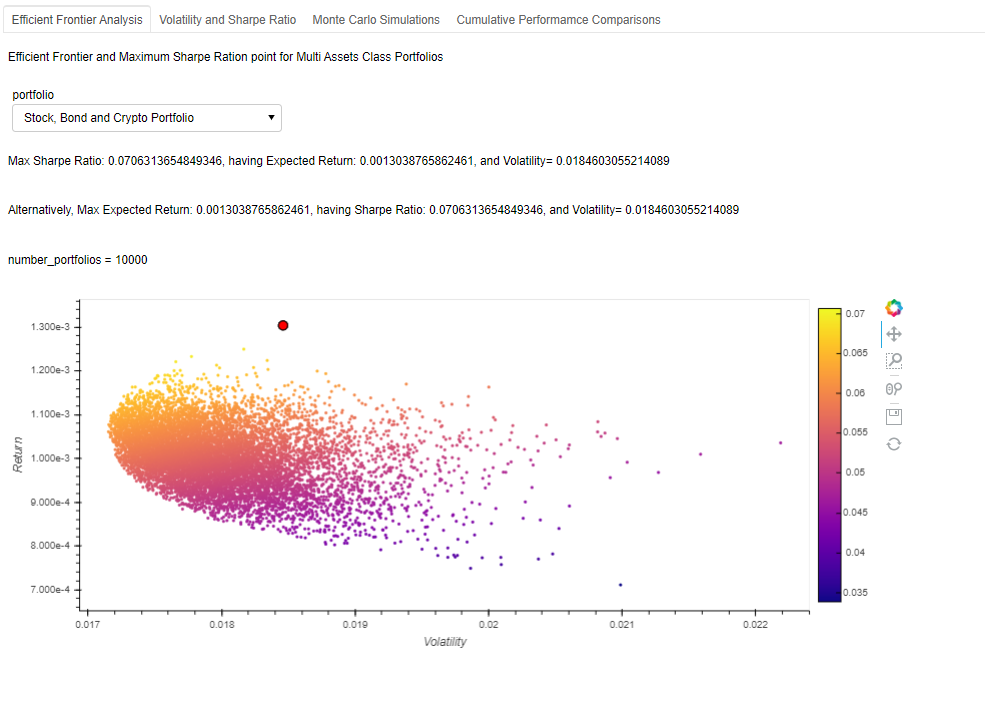
Part 2 utilizes the input from part 1 to perform an Optimal Portfolio analysis using the Efficient Frontier. This piece of code inputs various combination of assets and return an "optimized" portfolio or in this case a weighted portfolio that maximizes the Sharpe's Ratio. It runs a simulation of various weighted portfolio combinations to determine the weights of each asset needed to maximize the Sharpe's ratio. It outputs the weights of each asset in each optimized portfolio, the expected return and expected volatility of each simulation.
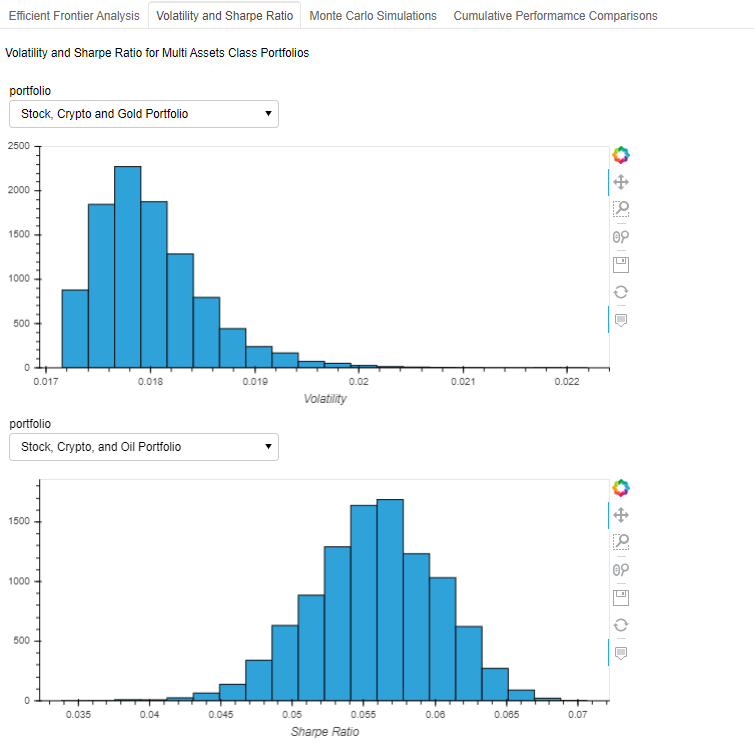
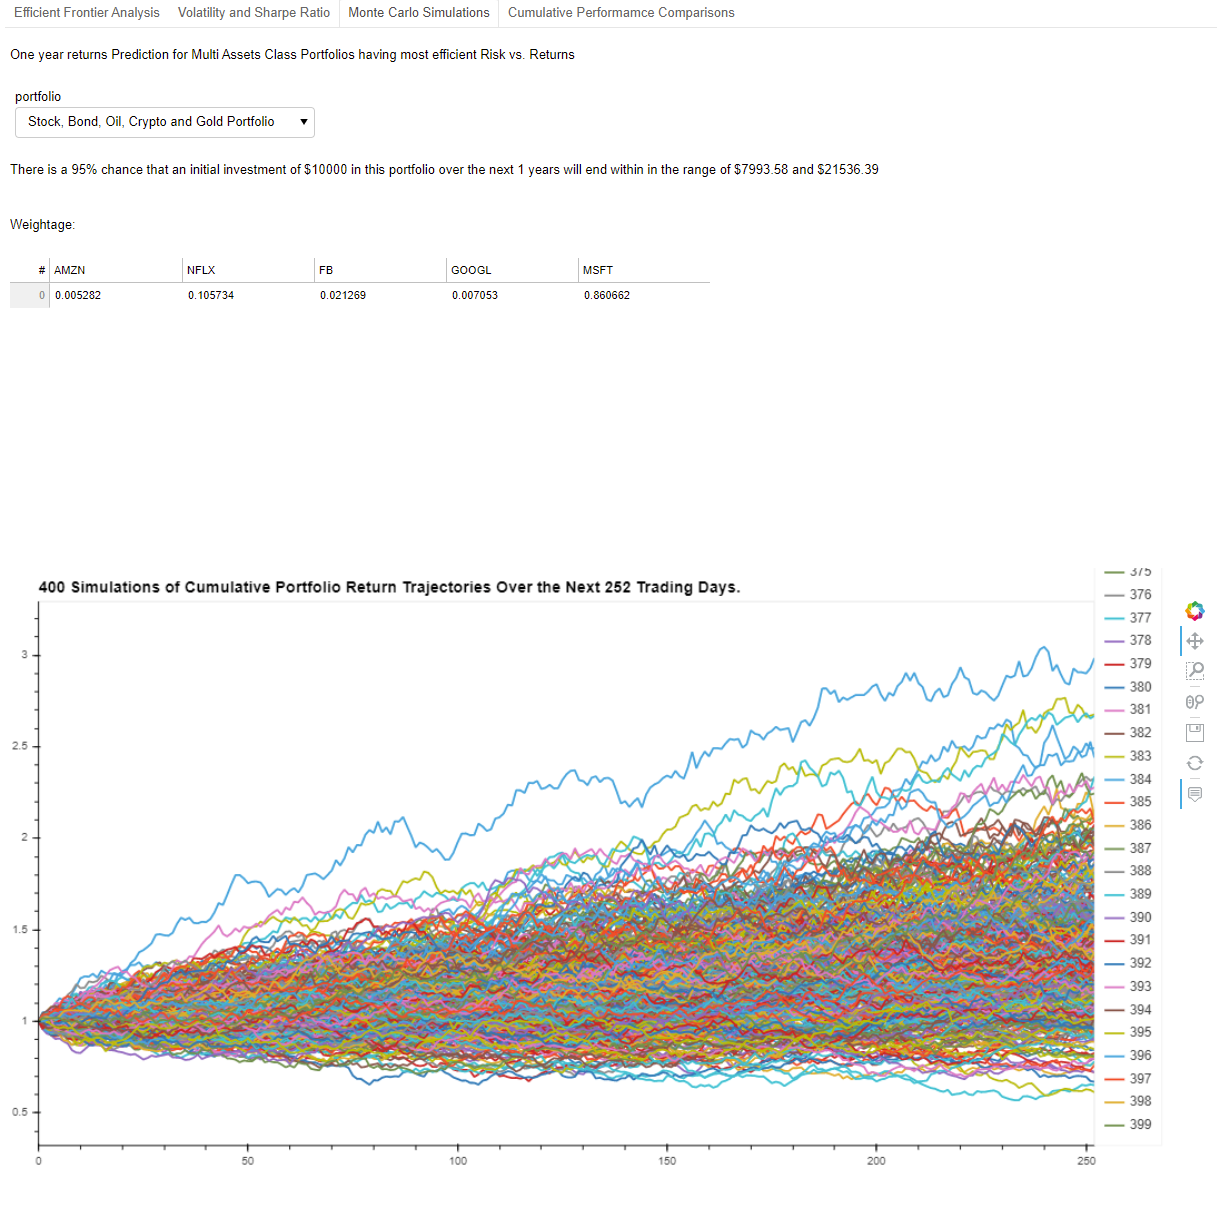
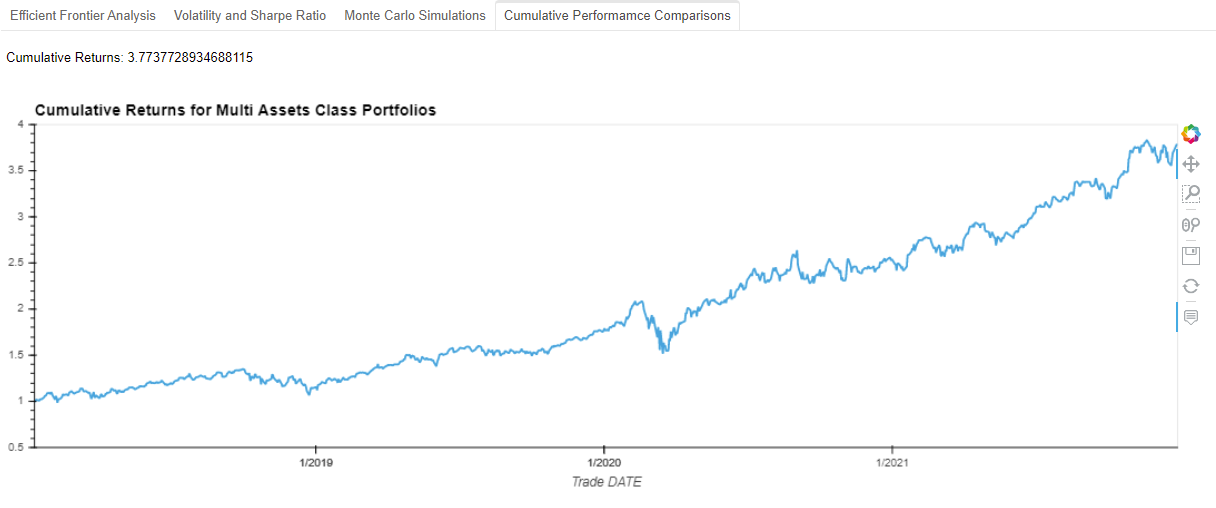
Part 3 uses the output from part 2 to create an interactive dashboard. In addition, to the interactive dashboard that visualizes the simulations from the Efficient Frontier analysis, it performs a Monte Carlo simulation on each of our portfolios based on the respective weights from part 2. The dashboard also displays cumulative return analysis of a handpicked portfolio against the weighted portfolios from the Efficient Frontier analysis.
This project used Python 3.7 and iPython in Jupyter Lab. It utilizes API's to fetch financial data.
1. os - used to access operating system
2. requests - used to pull API data
3. pandas - used to to read data into dataframes
4. load_dotenv - loads environment files
5. alpaca_trade_api - used to get API files from Alpaca
6. MCSimulution - used to run Monte Carlo simulation
7. matplotlib - used to create graphs and plots
8. Panel - used to create our dashboard
9. Interact - used to create a drop down menu to display multiple graphs
   as one
10. Numpy - used for financial calculations in part 2
11. Hvplot - used to create interactive graph
12. Holoviews - used to enhance graph display
This project requires the latest version of Anaconda with development environment with Pyviz and Alpaca Trade API.
In succession, run the API notebook, Efficient Fontier Notebook, and then the Visual Reports notebook. Then use the tabs and drop down menus to navigate the graphs and simulations in the dashboard. Use the API notebook to change the assets by inserting or deleting tickers from the ticker list used for each asset class and use the start and end date variables to change the date range for the dataframes. To change the number of weighted portfolio simulations, do this in the Efficient Frontier notebook by changing the number_of_portfolios variable. Finally, to change the number of Monte Carlo simulation, do this in the Visual Reports notebooks by changing the num_simulation variable.
Efficient Frontier Analysis - https://www.youtube.com/watch?v=f2BCmQBCwDs Crypto Historical Data - https://www.investing.com/crypto/bitcoin/historical-data Legacy Market Data - Alpaca and Quandl API MCSimulation Package
Anthony Tilotta, Abrar Aman, Ryan Dibeler, Shishir Suman, Sujit Subhash
MIT License
Copyright (c) [2021] [Anthony Tillotta, Abar Aman, Ryan Dibeler, Shishir Suman, Sujit Subhash]
Permission is hereby granted, free of charge, to any person obtaining a copy of this software and associated documentation files (the "Software"), to deal in the Software without restriction, including without limitation the rights to use, copy, modify, merge, publish, distribute, sublicense, and/or sell copies of the Software, and to permit persons to whom the Software is furnished to do so, subject to the following conditions:
The above copyright notice and this permission notice shall be included in all copies or substantial portions of the Software.
THE SOFTWARE IS PROVIDED "AS IS", WITHOUT WARRANTY OF ANY KIND, EXPRESS OR IMPLIED, INCLUDING BUT NOT LIMITED TO THE WARRANTIES OF MERCHANTABILITY, FITNESS FOR A PARTICULAR PURPOSE AND NONINFRINGEMENT. IN NO EVENT SHALL THE AUTHORS OR COPYRIGHT HOLDERS BE LIABLE FOR ANY CLAIM, DAMAGES OR OTHER LIABILITY, WHETHER IN AN ACTION OF CONTRACT, TORT OR OTHERWISE, ARISING FROM, OUT OF OR IN CONNECTION WITH THE SOFTWARE OR THE USE OR OTHER DEALINGS IN THE SOFTWARE.