- Project Description
- Simplifying Assumptions
- Trace files
- Tracking Dependencies
- Running the project
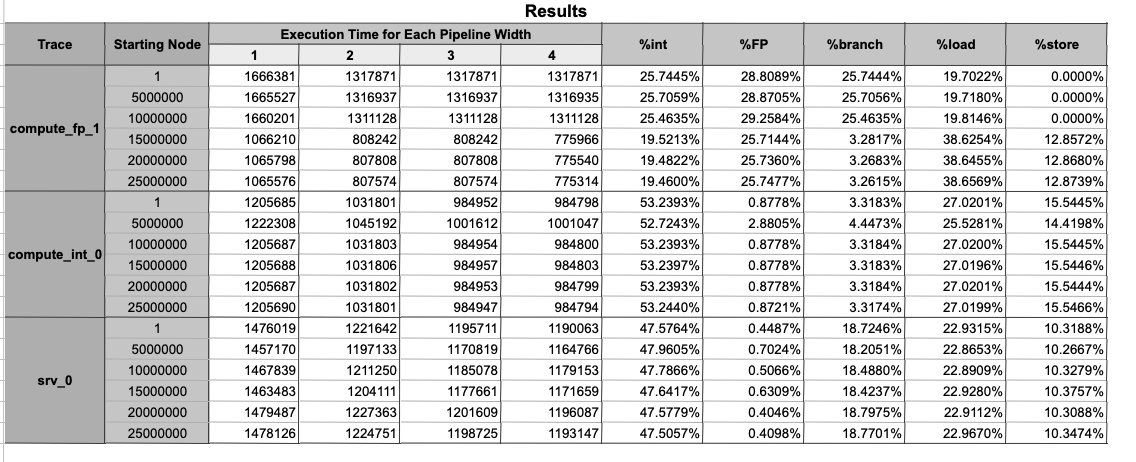
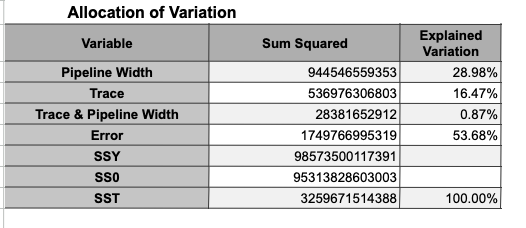
- Results
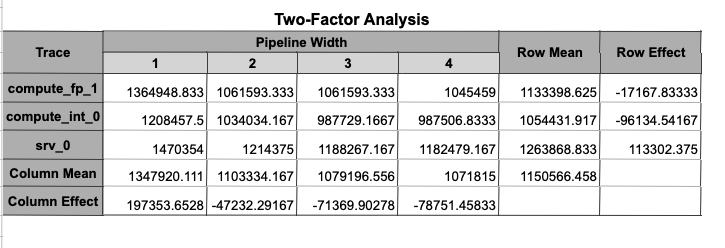
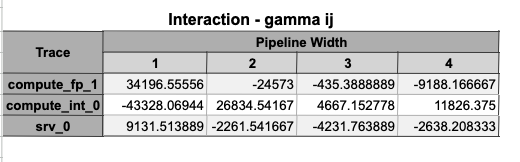
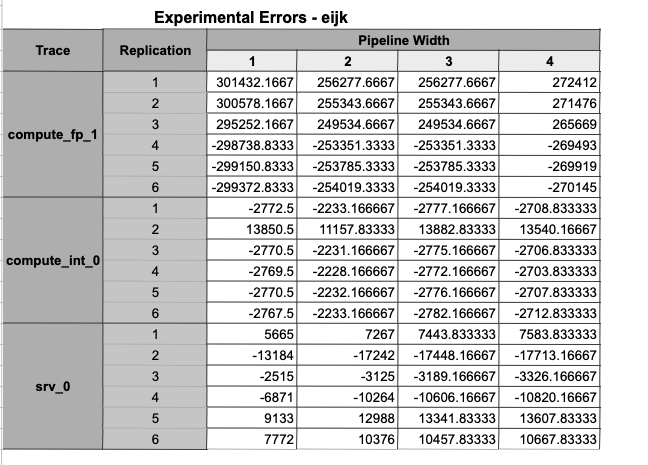
- Two factor analysis
A trace driven processor pipeline simulator which was designed and implemented as part of our Computer Simulation and Modeling course at Simon Fraser University. Our goal was to experiment with a simplified processor pipeline using trace-driven methods. The project was implemented in C++ and was tested using valgrind.
This project is not a full processor simulator. It is a simplified simulator that includes key parts of the pipeline stages in a processor. The following simplifying assumptions are made:
- No branch prediction.
- All instruction fetches hit in the L1 instruction cache and don’t need to read from memory.
- All memory operations (loads and stores) hit in the L1 data cache and don’t need to read/write from/to memory.
- Integer and floating point operations execute in 1 cycle.
- Any branch instruction delays instruction fetch until after the branch executes. The next instruction(s) to be fetched will go to the IF stage in the cycle after the branch finishes the EX stage.
- All loads and stores access the L1 data cache in 1 cycle.
This simulator will consume a trace with the following format: Each line represents an instruction with comma separated values representing the following:
- Instruction program counter (PC): A hexadecimal value representing the instruction address.
- Instruction type: A value between 1 and 5: - Integer instruction: An instruction that uses the integer ALU - Floating point instruction: An instruction that uses the floating point unit - Branch: An instruction that transfers control to the next instruction in the trace. - Load: An instruction that reads a value from memory. - Store: An instruction that writes a value to memory.
- A list of PC values for instructions that the current instruction depends on. Some instructions don’t have any dependences, so this list will be empty. Other instructions depend on 1-4 other instructions. Note that PC values correspond to static instructions, and the trace could have multiple dynamic instructions with the same PC value. For dependences, an instruction is dependent on the last instance of the dynamic instruction with that PC value.
Provided trace files can be found under the traces/ directory. There are 3 trace provided trace files:
srv_0.gz- server trace
compute_int_0.gz- trace that contains predominantly integer instructions
compute_fp_1.gz- trace that contains predominantly floating point instructions
The trace files are compressed using gzip. You can decompress them using the following command:
gunzip trace_file.gz
Each instruction can execute as long as its dependences are satisfied. The simulator tracks for each instruction that fall into the following three categories:
- Structural hazards: Another instruction in the same cycle is using the same functional unit. An integer instruction cannot execute in the same cycle as another integer instruction. A floating point instruction cannot execute in the same cycle as another floating point instruction. A branch instruction cannot execute in the same cycle as another branch instruction. A load instruction cannot go to the MEM stage in the same cycle as another load instruction. A store instruction cannot go to the MEM stage in the same cycle as another store instruction.
- Control hazards: A branch instruction halts instruction fetch until the cycle after the branch executes (finishes EX stage).
- Data hazards: An instruction cannot go to EX until all its data dependences are satisfied. A dependence on an integer or floating point instruction is satisfied after they finish the EX stage. A dependence on a load or store is satisfied after they finish the MEM stage.
-
Clone the repo
-
Open the project is VS code (or your favorite editor)
-
Setup your traces files as outlined in the Trace files section above.
-
Run
maketo compile the project -
Run the project with the following launch parameters
./proj path_to_trace_file start_instruction_# instruction_count pipeline_width