I enjoy watching the weather, analyzing data, and looking at pretty pictures, so I though I'd start this project.
This is for data from the IBTrACS-All which includes basically every peice of tropical cyclone data from around the globe. The original source file from https://www.ncdc.noaa.gov/ibtracs/index.php?name=ibtracs-data-access was pretty messy so edit.py cleans it up and arranges it neatly. Data, especially wind intensity data, is generally limited before 1945 in the west pacific. All data is limited before 1980 because of a lack of satellites.
This is for data from Hurdat2 which is for the North Atlantic basin only. This data has been reanalyzed and includes much more detail than the IBTrACS data set. Much of the data before the 1960s is from ships, aircraft, and weather stations.
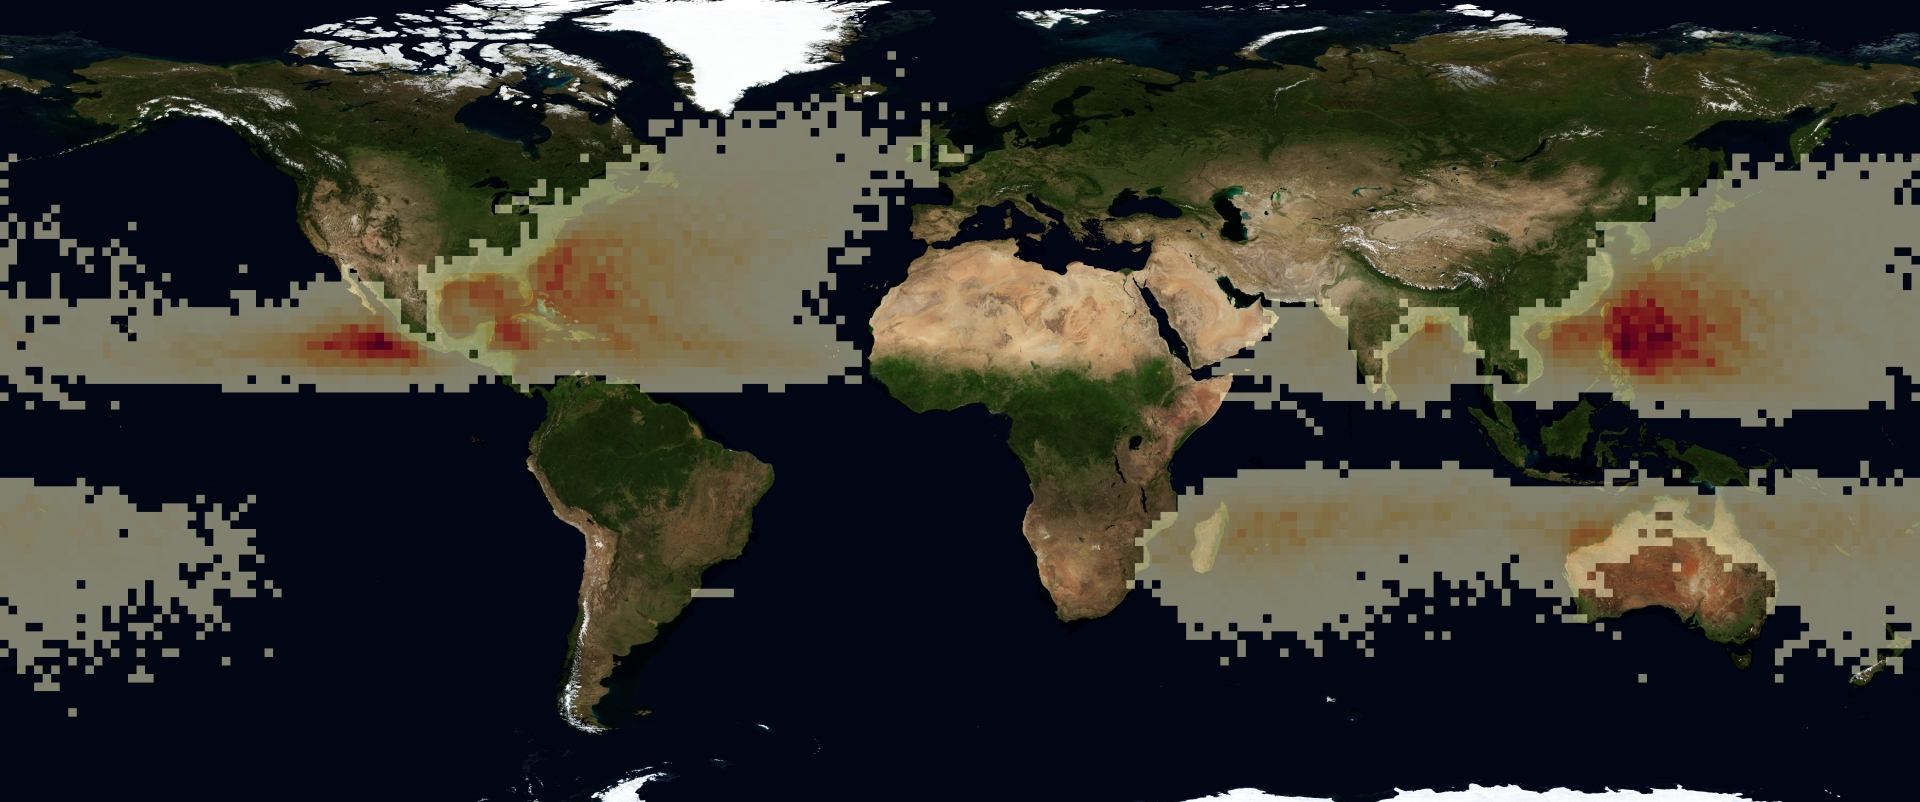
Can edit heatmap.py to look at all sorts of different data. It takes it and maps it on the worldMap image provided. Data needs to be compressed by some factor, otherwise it is too spread out. Can also look at basins separately.
This image is a heatmap of the accumulated cyclone energy (wind*wind/100000) for storms with winds >34kt
Command Looks like: python -m AllStorms.heatmap all.csv 16 ACE.jpg
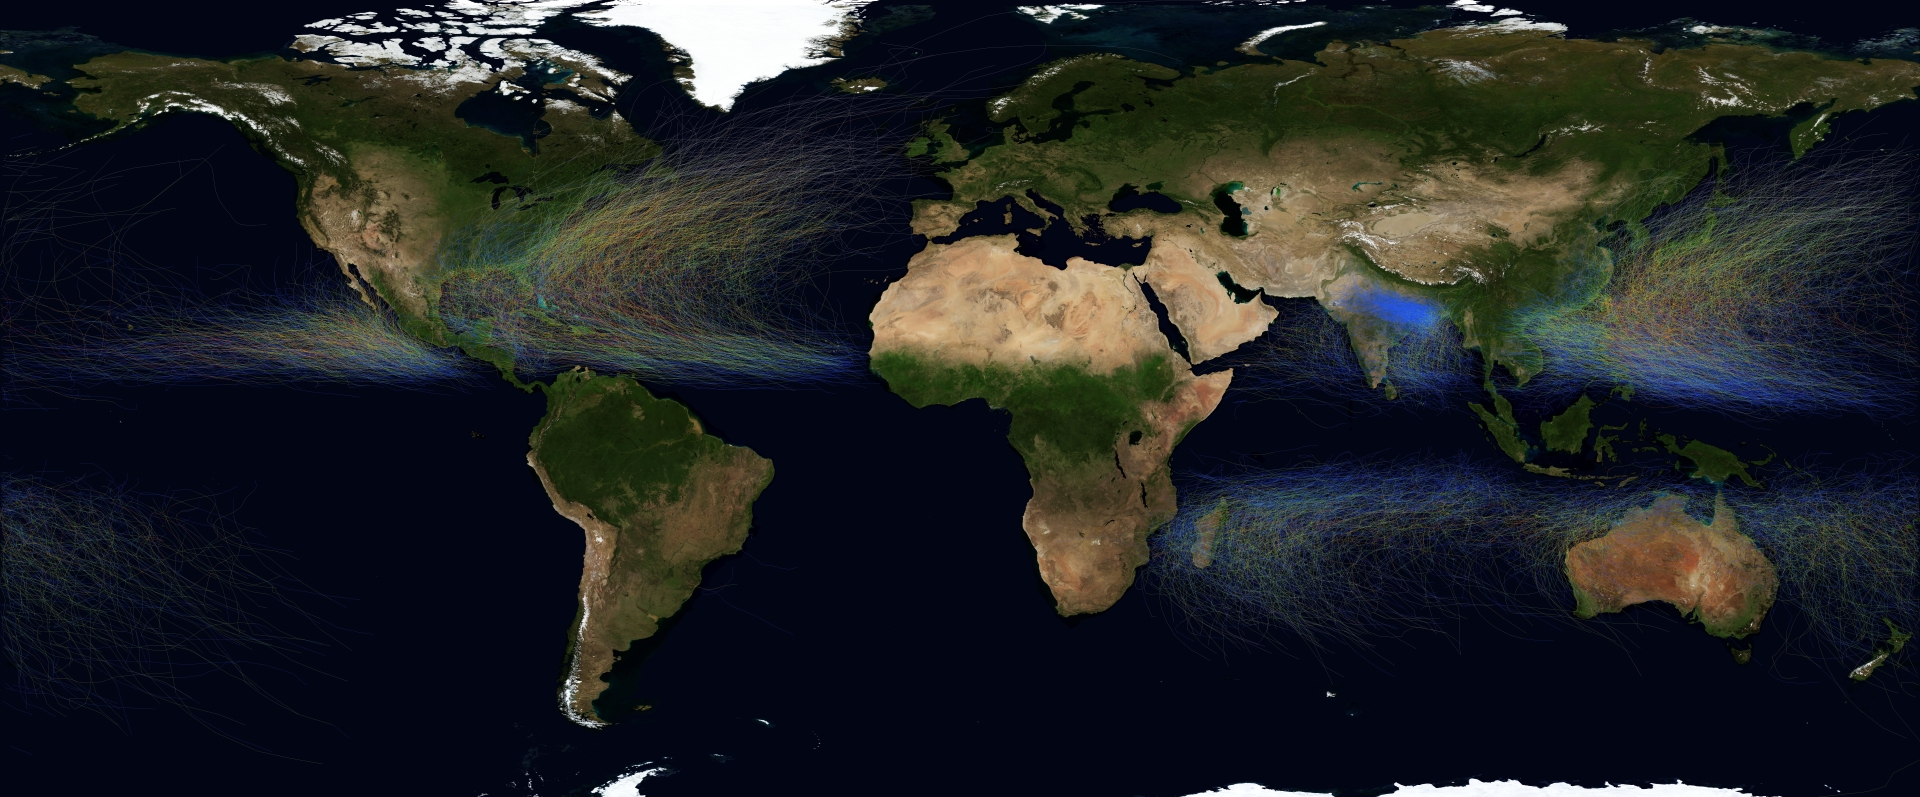
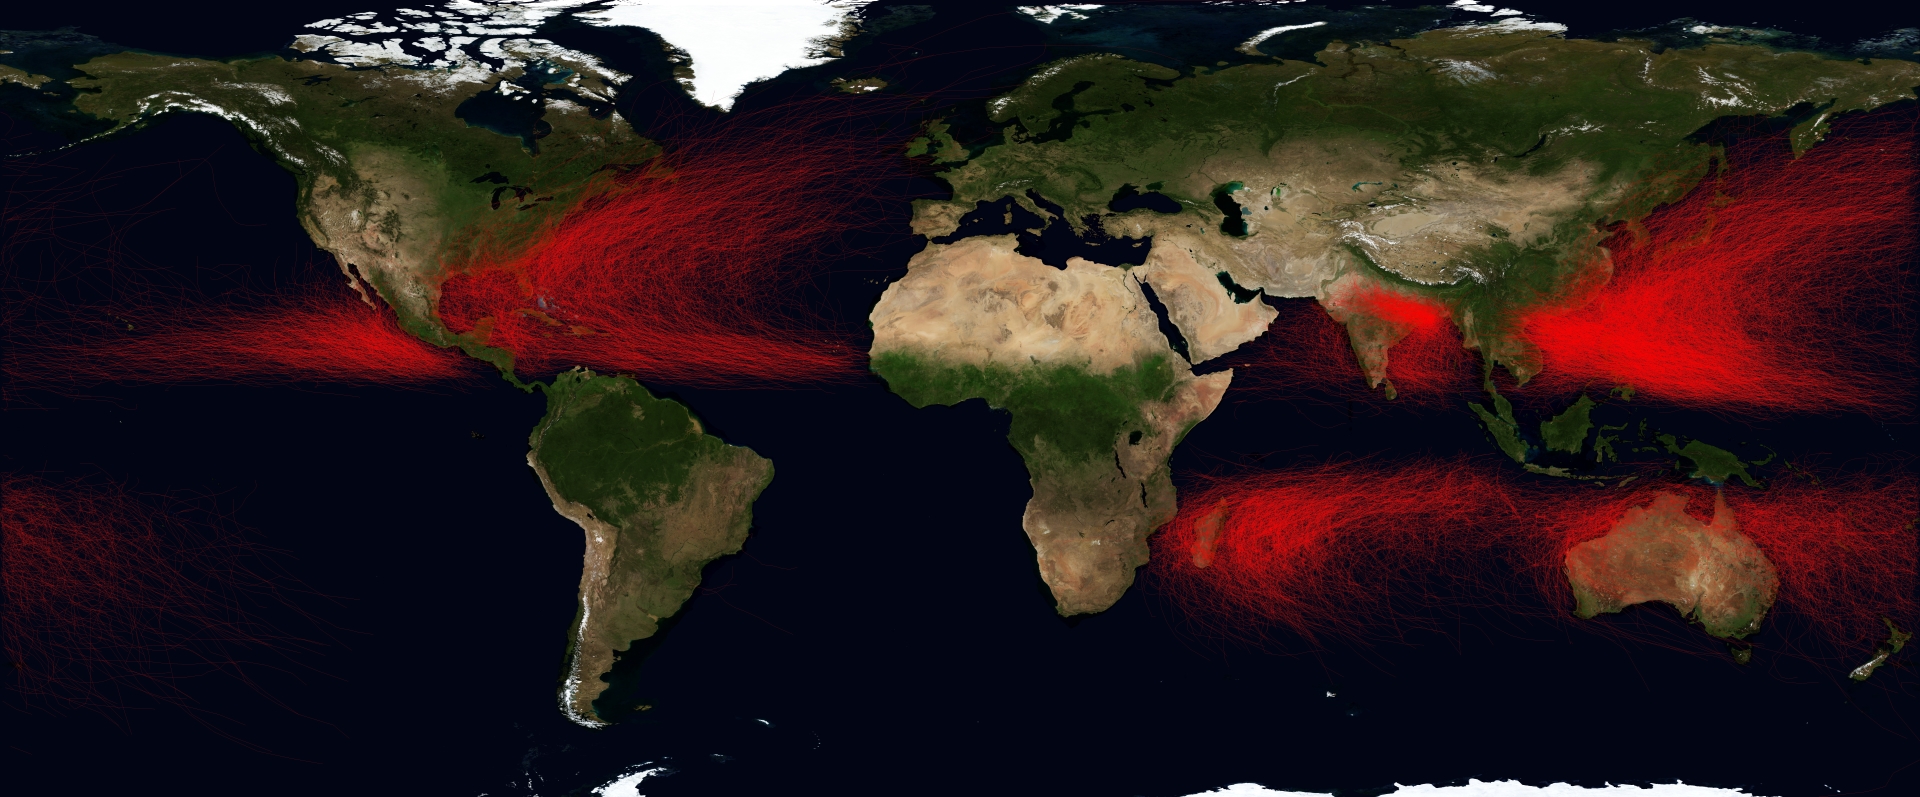
Can edit trackLines.py to look at all differnt sorts of tracks. Takes points and connects them on map. Can also color lines based on intensity.
Command Looks like: python -m AllStorms.trackLines all.csv intensity.jpg