A powerful alert correlation system that helps reduce alert fatigue by intelligently grouping and analyzing related alerts from your monitoring stack. Built with Prometheus, AlertManager, Grafana, and Loki.
- Intelligent alert correlation and grouping
- Real-time alert processing
- Beautiful Grafana dashboards for visualization
- Integrated logging with Loki
- Comprehensive runbooks for common scenarios
- Docker-based deployment for easy setup
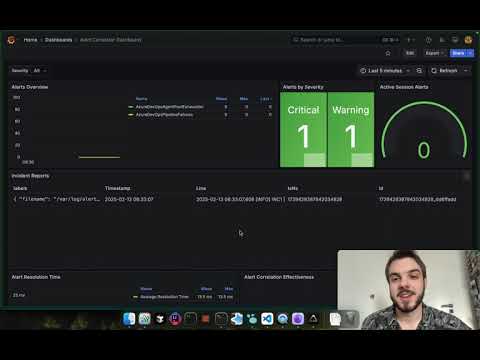
Watch how the Alert Correlator works in action:
See how to use local models and switch between different LLM providers:

The project is organized into the following main directories:
backend/: Contains the core application logicalert_correlator.py: Main correlation engineserver.js: API server
config/: Configuration files for monitoring and logginglogging/: Loki and Promtail configurationsmonitoring/: Prometheus and AlertManager configurations
docker/: Docker-related filesDockerfile: Main application containerdocker-compose.yml: Service orchestration.env: Environment variables
frontend/: Web interface filesgrafana/: Grafana provisioning and dashboardsrunbooks/: Documentation for various scenarioslogs/: Application logs
- Docker and Docker Compose
- Git
- Python 3.8 or higher (if running locally)
- ~2GB of free RAM for all containers
- Clone the repository:
git clone https://github.com/yourusername/alert_correlator.git
cd alert_correlator- Set up environment configuration:
Create or modify the .env file in the docker directory with your OpenAI API key:
echo "OPENAI_API_KEY=your_openai_api_key_here" > docker/.env- Create the logs directory and log file:
mkdir -p logs
touch logs/alert_correlator.log- Start the services:
docker compose -f docker/docker-compose.yml up -dAfter starting the containers, you can access the following services:
- Grafana: http://localhost:3000
- Default credentials: admin/admin
- Prometheus: http://localhost:9090
- AlertManager: http://localhost:9093
- Alert Correlator API: http://localhost:5000
- Loki: http://localhost:3100
- Login to Grafana at http://localhost:3000
- Navigate to Dashboards -> Browse
- Look for "Alert Correlator Dashboard"
- The dashboard includes:
- Alert correlation statistics
- Active alert groups
- Historical correlation data
- Alert patterns and trends
The main configuration is done through environment variables and the following files:
backend/alert_correlator.py: Main correlation logicconfig/monitoring/alertmanager.yml: AlertManager configurationconfig/monitoring/prometheus.yml: Prometheus configurationconfig/logging/loki-config.yaml: Loki configurationconfig/logging/promtail-config.yaml: Log shipping configuration
The Alert Correlator now supports multiple LLM providers:
-
Local Models with Ollama: Run AI models locally on your machine
- Supports various open-source models
- No internet connection required for inference
- Lower latency for quick responses
-
OpenAI: Use OpenAI's powerful GPT models
- Requires API key
- Best-in-class performance
You can switch between these providers through the LLM service interface at runtime, allowing for flexible model selection based on your needs.
Predefined runbooks are available in the runbooks/ directory, organized by component:
alertmanager/: AlertManager related issuesprometheus/: Prometheus troubleshootingkubernetes/: Kubernetes cluster issuesgrafana/: Grafana-related problemsazure-devops/: Azure DevOps pipeline issues
You can test the alert correlation system using the Makefile:
make helpLogs are available in:
- Docker logs:
docker compose -f docker/docker-compose.yml logs -f [service_name] - Application logs:
logs/alert_correlator.log - Through Loki in Grafana
Contributions are welcome! Please feel free to submit a Pull Request. For major changes, please open an issue first to discuss what you would like to change.
This project is licensed under a Custom Attribution-NonCommercial License - see the LICENSE file for details.
Vasile Bogdan Bujor
- This is a monitoring tool - please ensure you have proper security measures in place
- Always backup your configuration before making changes
- Test thoroughly in a non-production environment first
- Commercial use requires explicit permission from the author