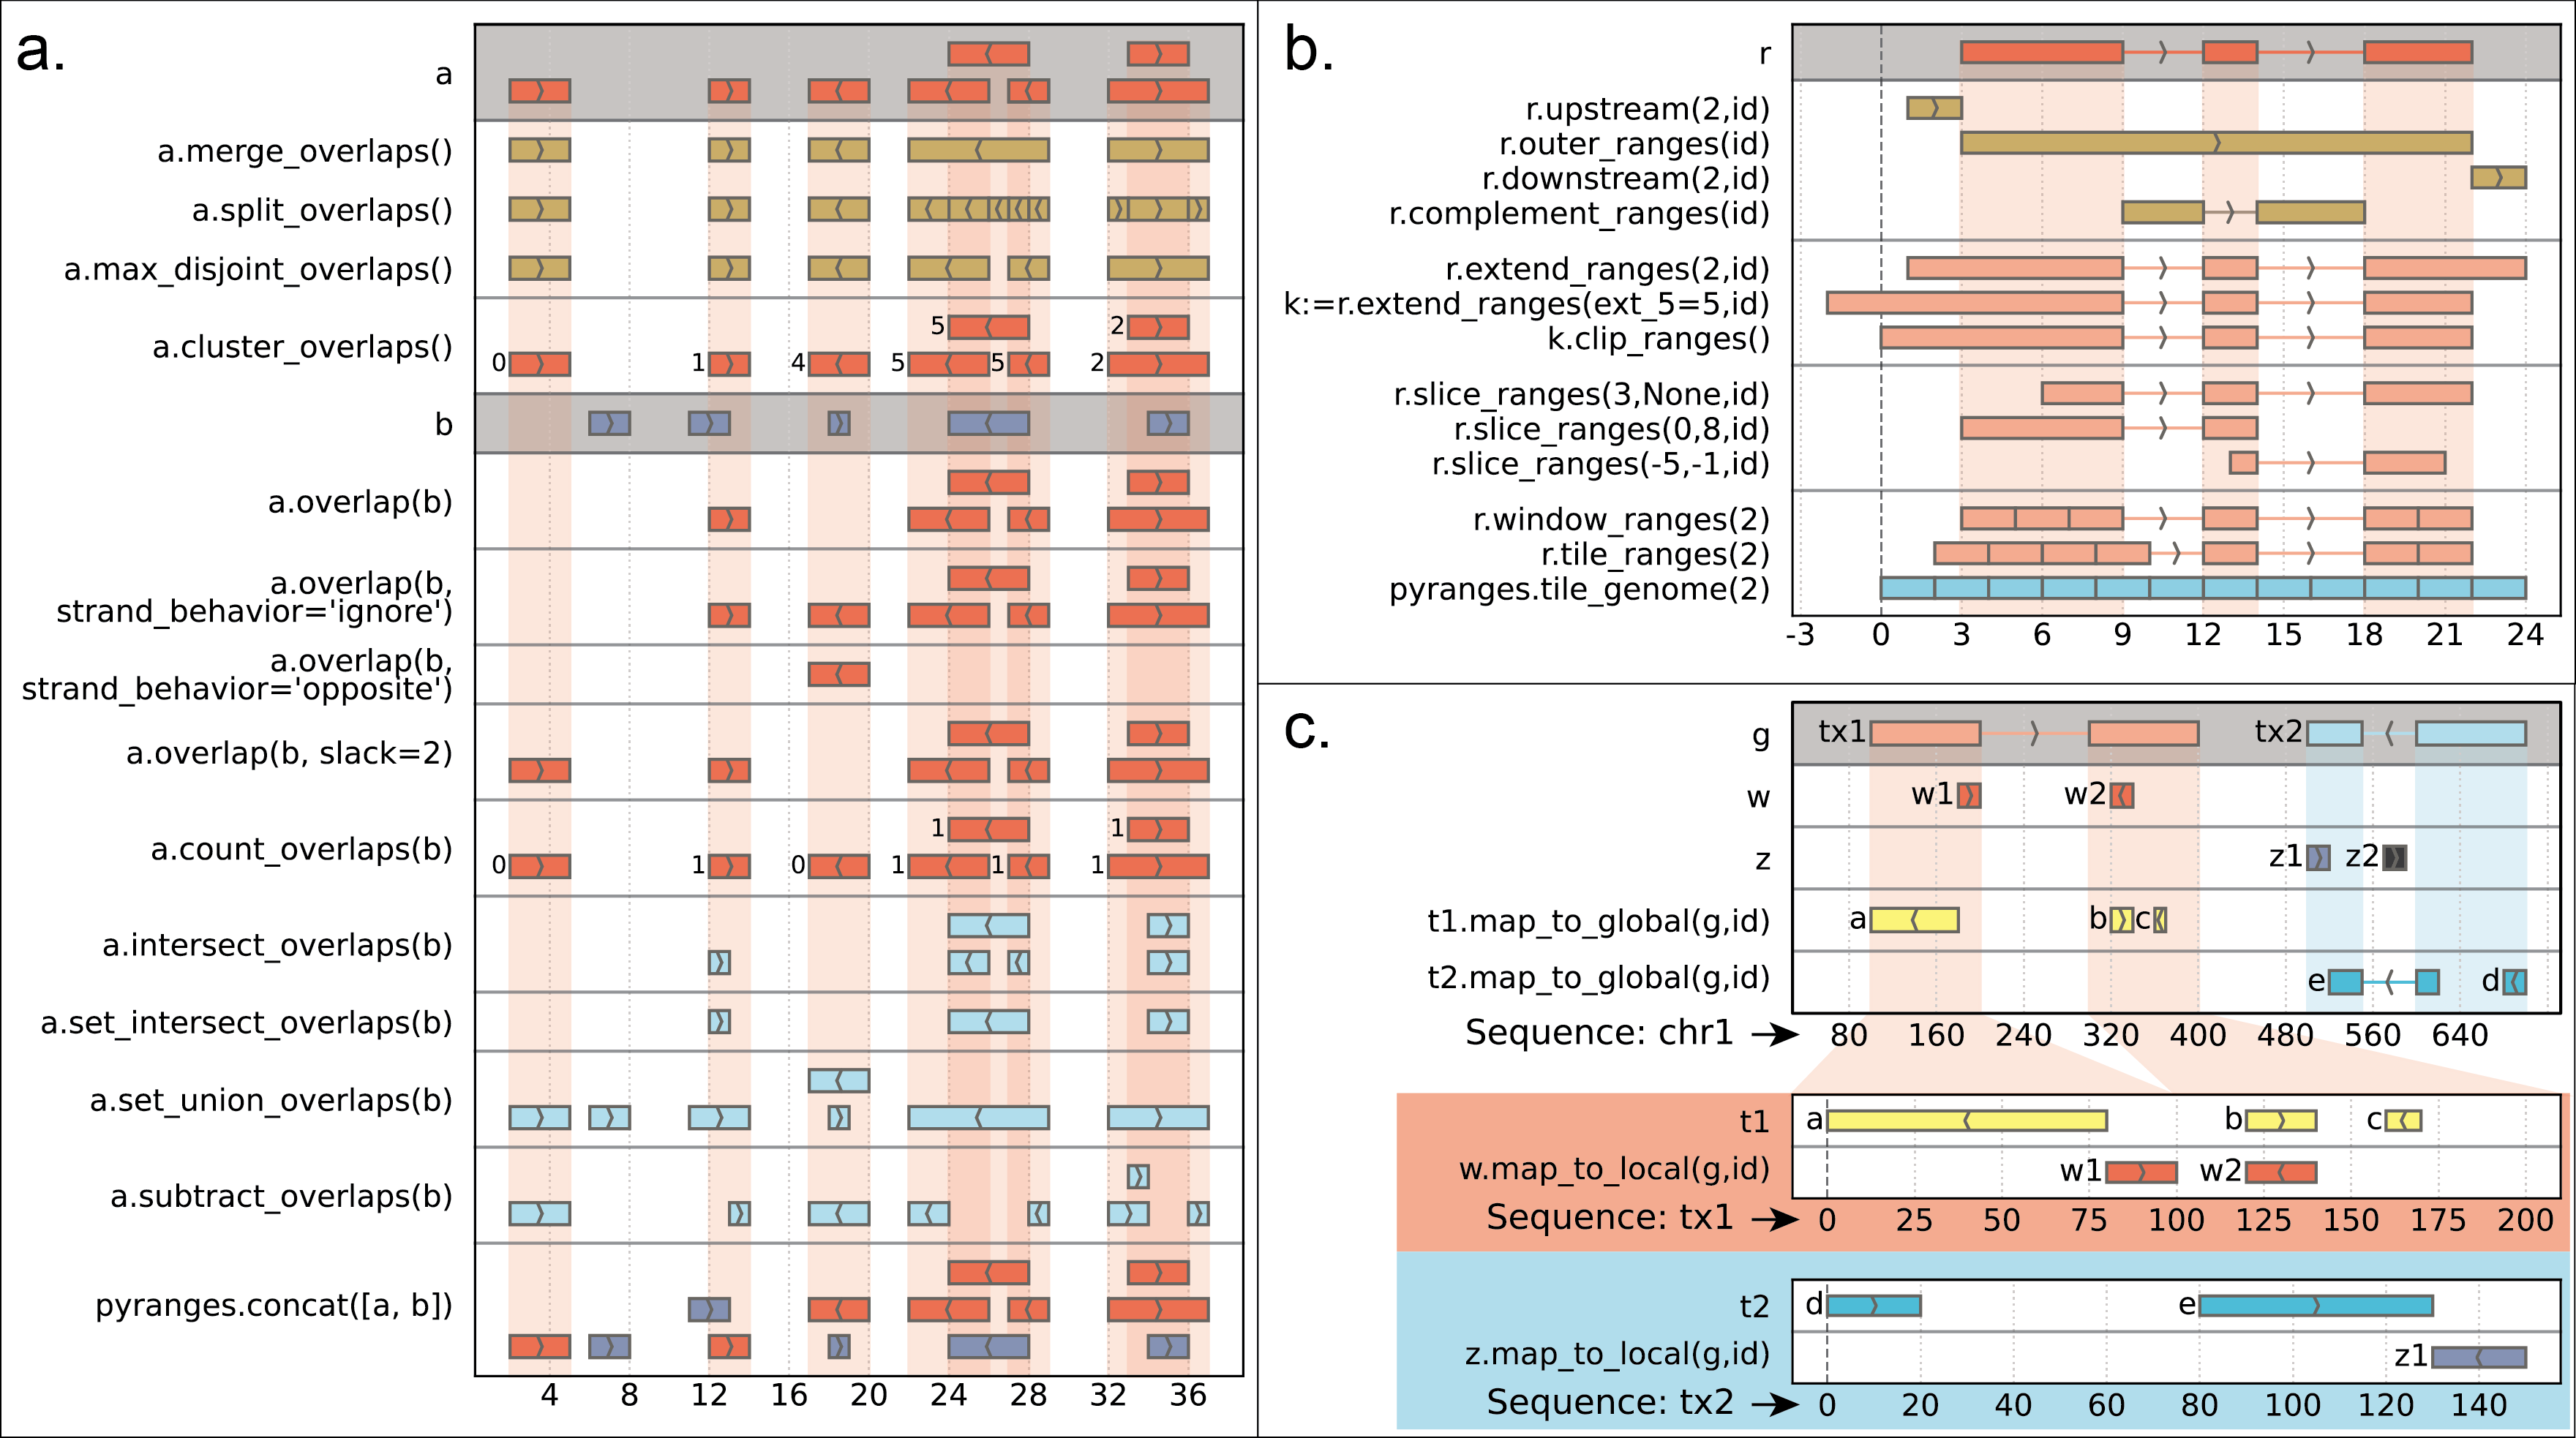
PyRanges is a Python library with a Rust backend for efficient and intuitive manipulation of genomics data, particularly genomic intervals (like genes, genomic features, or reads). The library is optimized for fast querying and manipulation of genomic annotations. It enables intuitive and highly efficient pipelines for genomic analysis.
"Finally ... This was what Python badly needed for years." - Heng Li
This is version 1.x of pyranges. It is a complete rewrite of the original pyranges library, that will replace the "default" (version 0) sometime in 2025. If you are a v0 user, check the migration guide in the documentation.
The pyranges documentation, including installation instructions, API, tutorial, and how-to-pages, is available at https://pyranges1.readthedocs.io/
Pyranges 1.x requires python ≥3.12. Minimal installation:
pip install pyranges1Installation including all optional dependencies:
pip install pyranges1[all]Details at https://pyranges1.readthedocs.io/en/latest/installation.html
- fast
- memory-efficient
- featureful
- pythonic/pandastic
Stovner EB, Sætrom P (2020) PyRanges: efficient comparison of genomic intervals in Python. Bioinformatics 36(3):918-919 http://dx.doi.org/10.1093/bioinformatics/btz615
Coming soon: a paper for v1!
- most importantly, cite pyranges if you use it. It is the main metric funding sources care about.
- use pyranges in Stack Overflow/biostars questions and answers
- star the repo (possibly important for github visibility and as a proxy for project popularity)
If you encounter bugs, or the documentation is not enough a cannot accomplish a specific task of interest, or if you'd like new features implemented, open an Issue at github: https://github.com/pyranges/pyranges/issues
Pyranges accepts code contributions in form of pull request. For details, visit https://pyranges1.readthedocs.io/developer_guide.html
 (The cheatsheet above was created with pyranges_plot, a companion graphical library: https://pyranges-plot.readthedocs.io/)