PandaMap: A Python package for visualizing protein-ligand interactions with 2D ligand structure representation.
Protein AND ligAnd interaction MAPper: A Python package for visualizing protein-ligand interactions with 2D ligand structure representation
![]()


Version 4.1.0: With 3D HTML rendering
PandaMap is a Python package for visualizing protein-ligand interactions with enhanced detection methods.
- Visualization of protein-ligand complexes with 3D-enhanced 2D representations
- Comprehensive interaction detection:
- Hydrogen bonds
- Pi-Pi stacking
- Hydrophobic interactions
- Salt bridges and ionic interactions
- Halogen bonds
- Metal coordination
- And many more!
- Realistic solvent accessibility calculation
- Support for multiple input formats (PDB, CIF, PDBQT)
- Detailed interaction reports
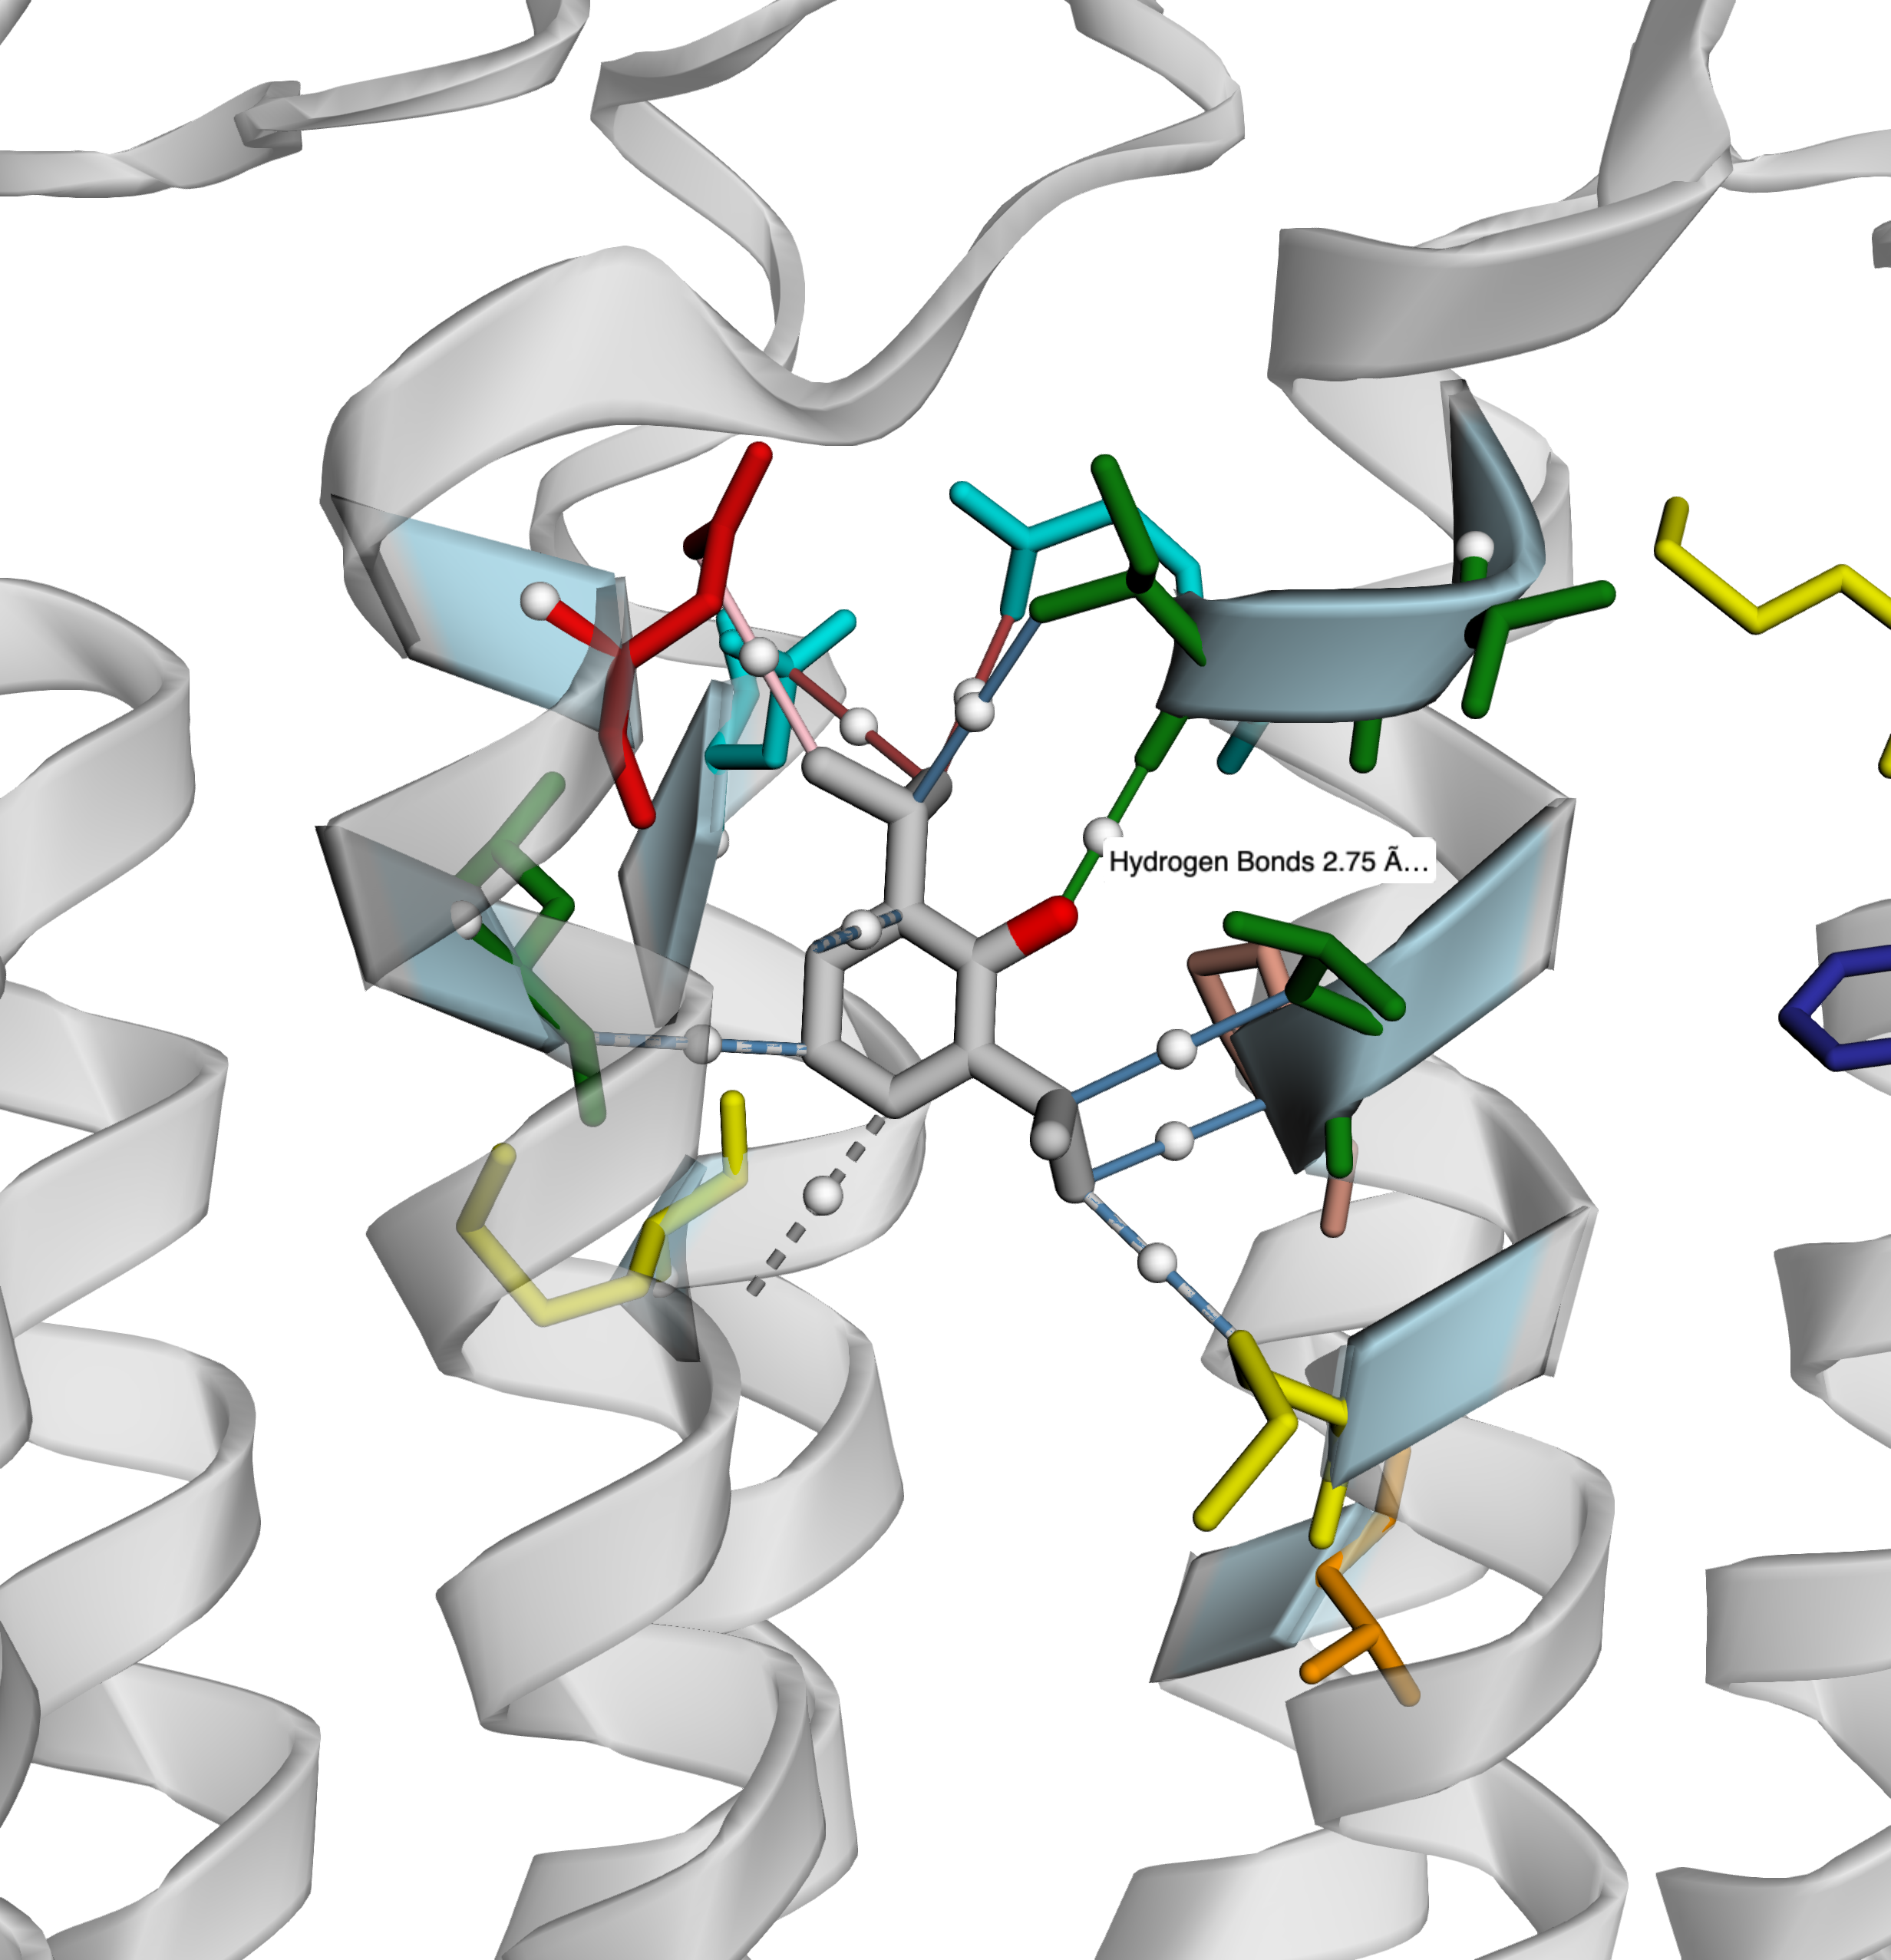
- 3D Maps with rendering
👉 Click here for a live interactive 3D example
pip install pandamap-
Rich CLI Output (colored update messages):
pip install pandamap[fancy] -
3D HTML Visualization Support (via py3Dmol):
pip install pandamap[viz] -
All Features:
pip install pandamap[full]
- dssp #It can be installed externally
brew install dssp #mac users
sudo apt-get install dssp #linux users
Windows: Download from https://swift.cmbi.umcn.nl/gv/dssp/ - NumPy
- Matplotlib
- BioPython
pandamap -h

usage: pandamap [-h] [--output OUTPUT] [--ligand LIGAND] [--dpi DPI] [--title TITLE] [--version] [--report] [--report-file REPORT_FILE] [--3d] [--3d-output OUTPUT_3D] [--no-surface] [--width WIDTH] [--height HEIGHT] [--no-3d-cues] structure_file

PandaMap: Visualize protein-ligand interactions from structure files

positional arguments:
  structure_file        Path to structure file (PDB, mmCIF/CIF, or PDBQT format)

options:
  -h, --help            show this help message and exit
  --output, -o OUTPUT   Output image file path
  --ligand, -l LIGAND   Specific ligand residue name to analyze
  --dpi DPI             Image resolution (default: 300 dpi)
  --title, -t TITLE     Custom title for the visualization
  --version, -v         Show version information
  --report, -r          Generate text report
  --report-file REPORT_FILE
                        Output file for the text report (default: based on structure filename)
  --3d                  Generate an interactive 3D visualization of protein-ligand interactions
  --3d-output OUTPUT_3D
                        Output file path for 3D visualization (default: based on input filename)
  --no-surface          Do not show protein surface in 3D visualization
  --width WIDTH         Width of 3D visualization in pixels (default: 800)
  --height HEIGHT       Height of 3D visualization in pixels (default: 600)
  --no-3d-cues          Disable 3D cues in 2D visualization
## 🐼 PandaMap — Protein AND ligAnd interaction MAPper
Visualize protein-ligand interactions in both **2D image format** and **interactive 3D HTML** with optional reports.
---
### 🚀 Command-Line Usage
```bash
# Basic 2D interaction map
pandamap protein_ligand.pdb --output interactions.png
# With specific ligand
pandamap complex.cif --ligand LIG --output cif_interaction.png
# Generate text report
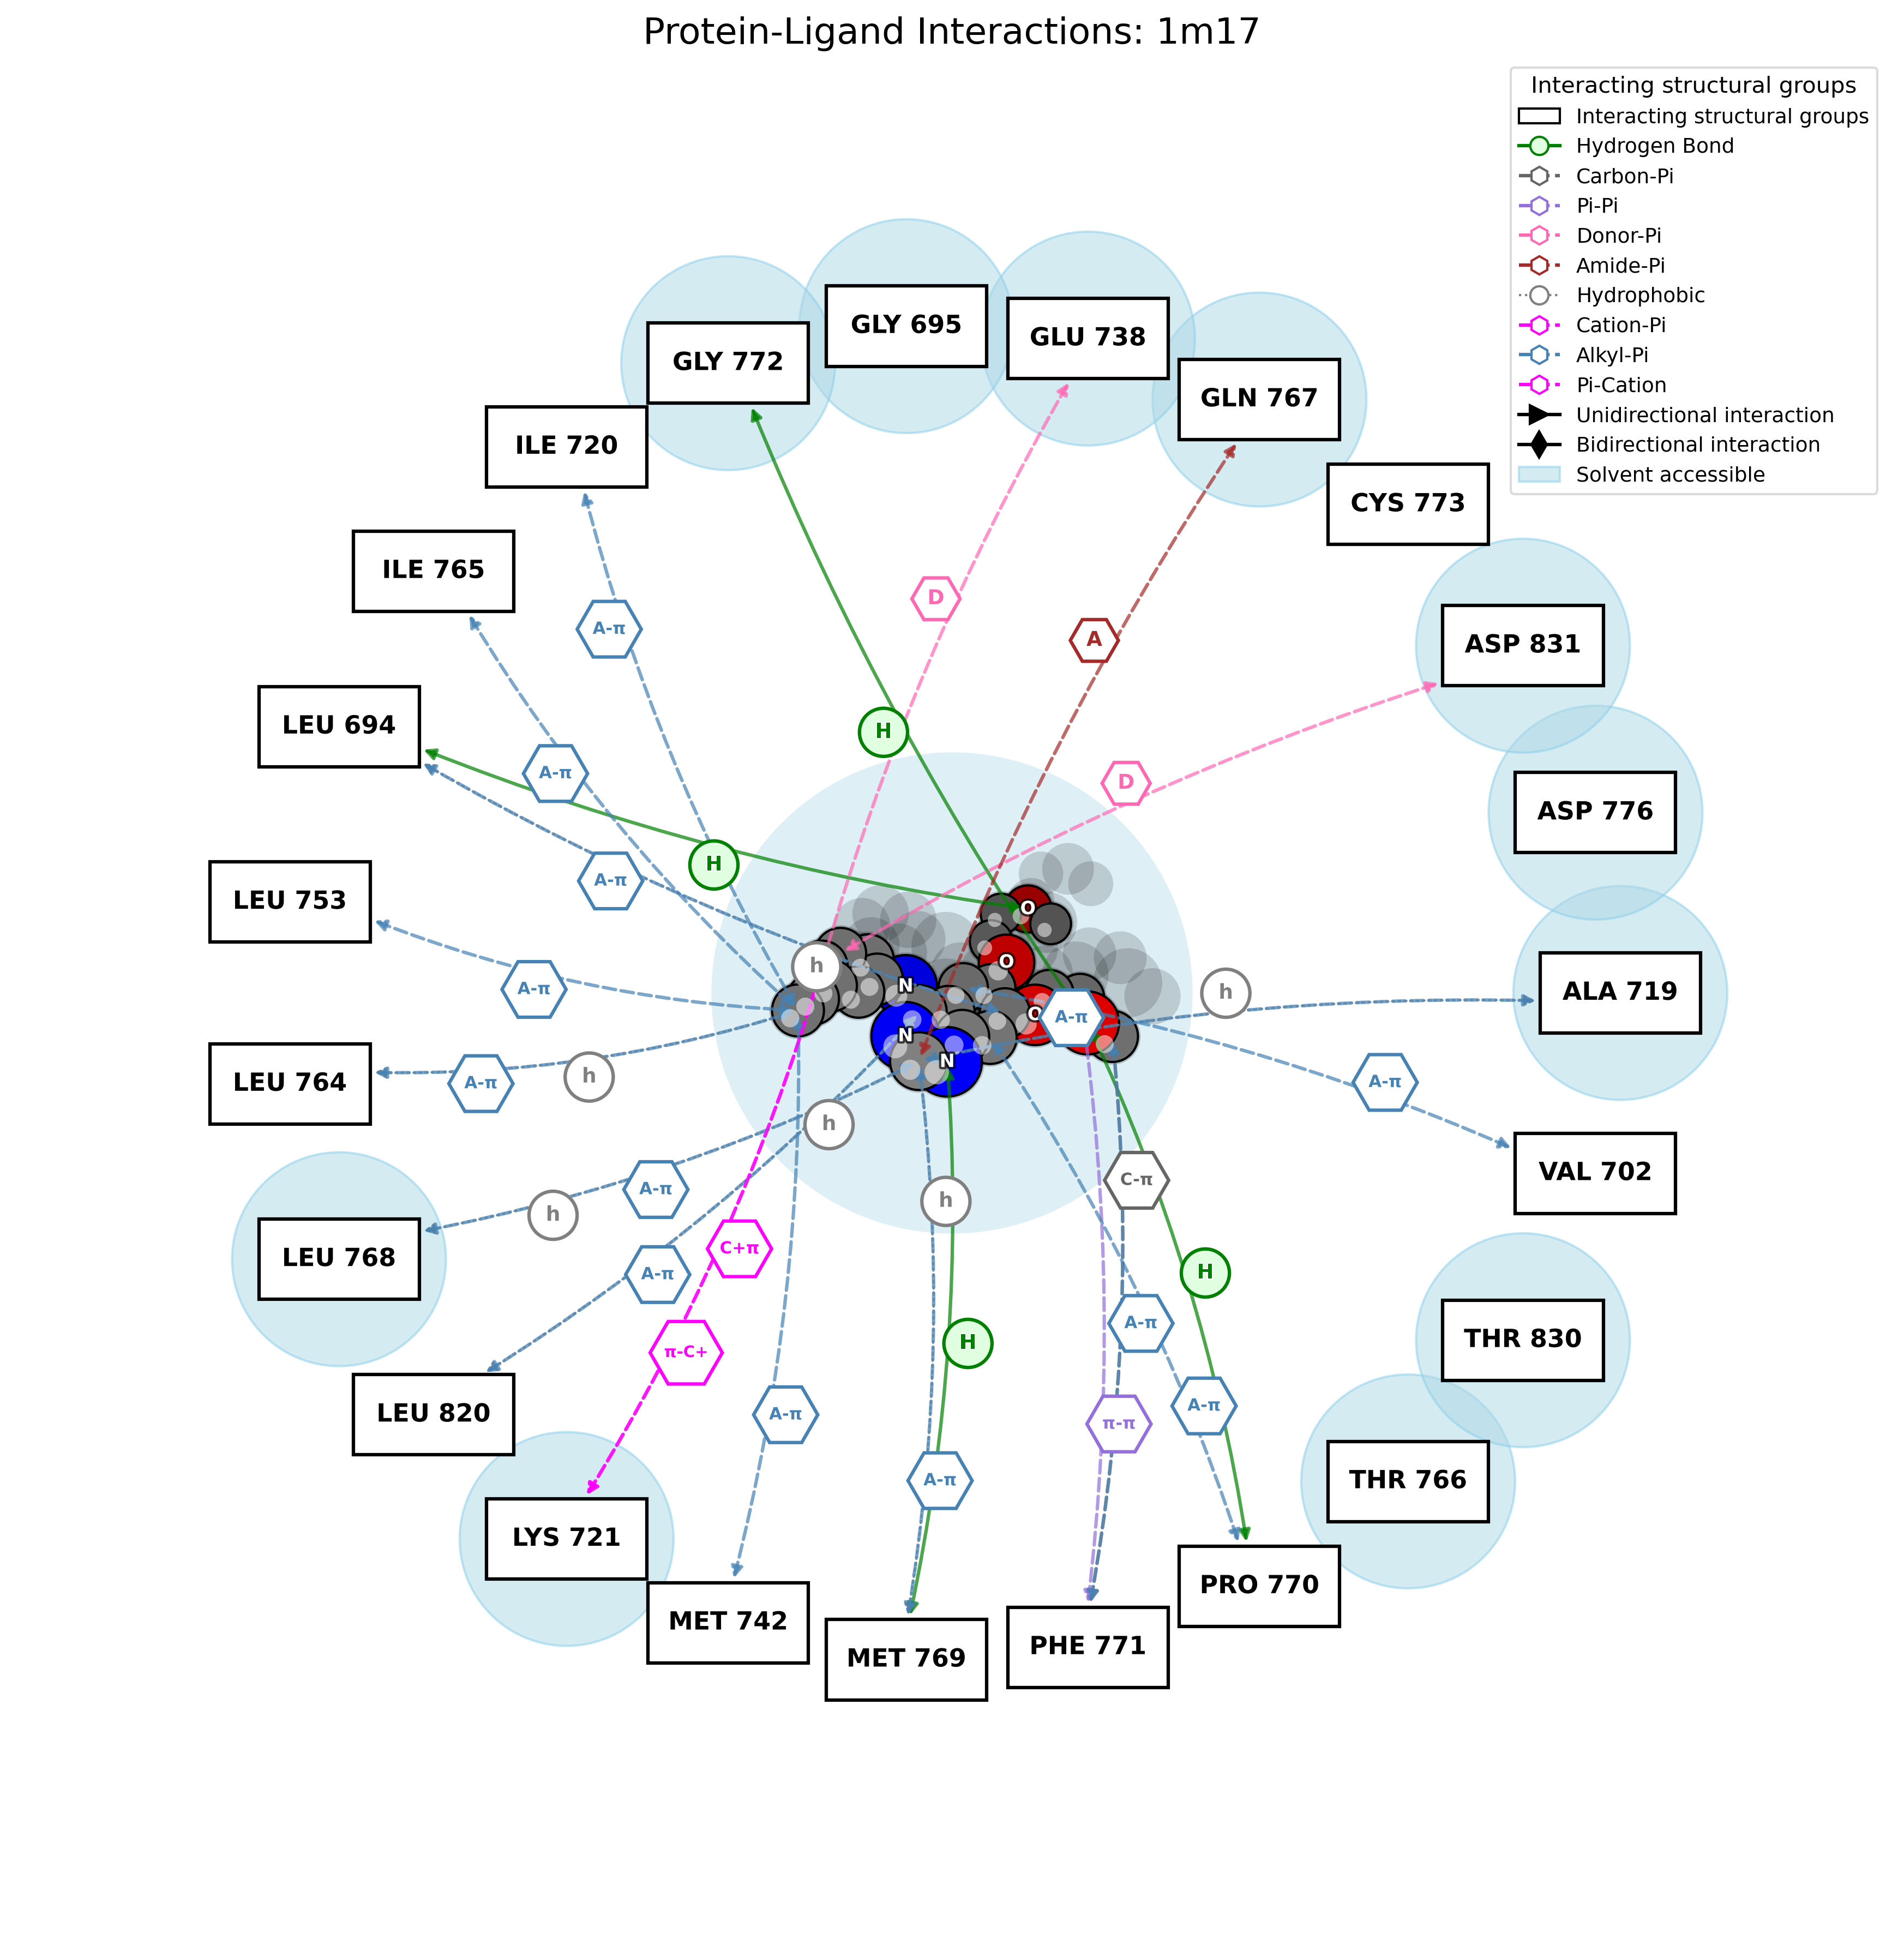
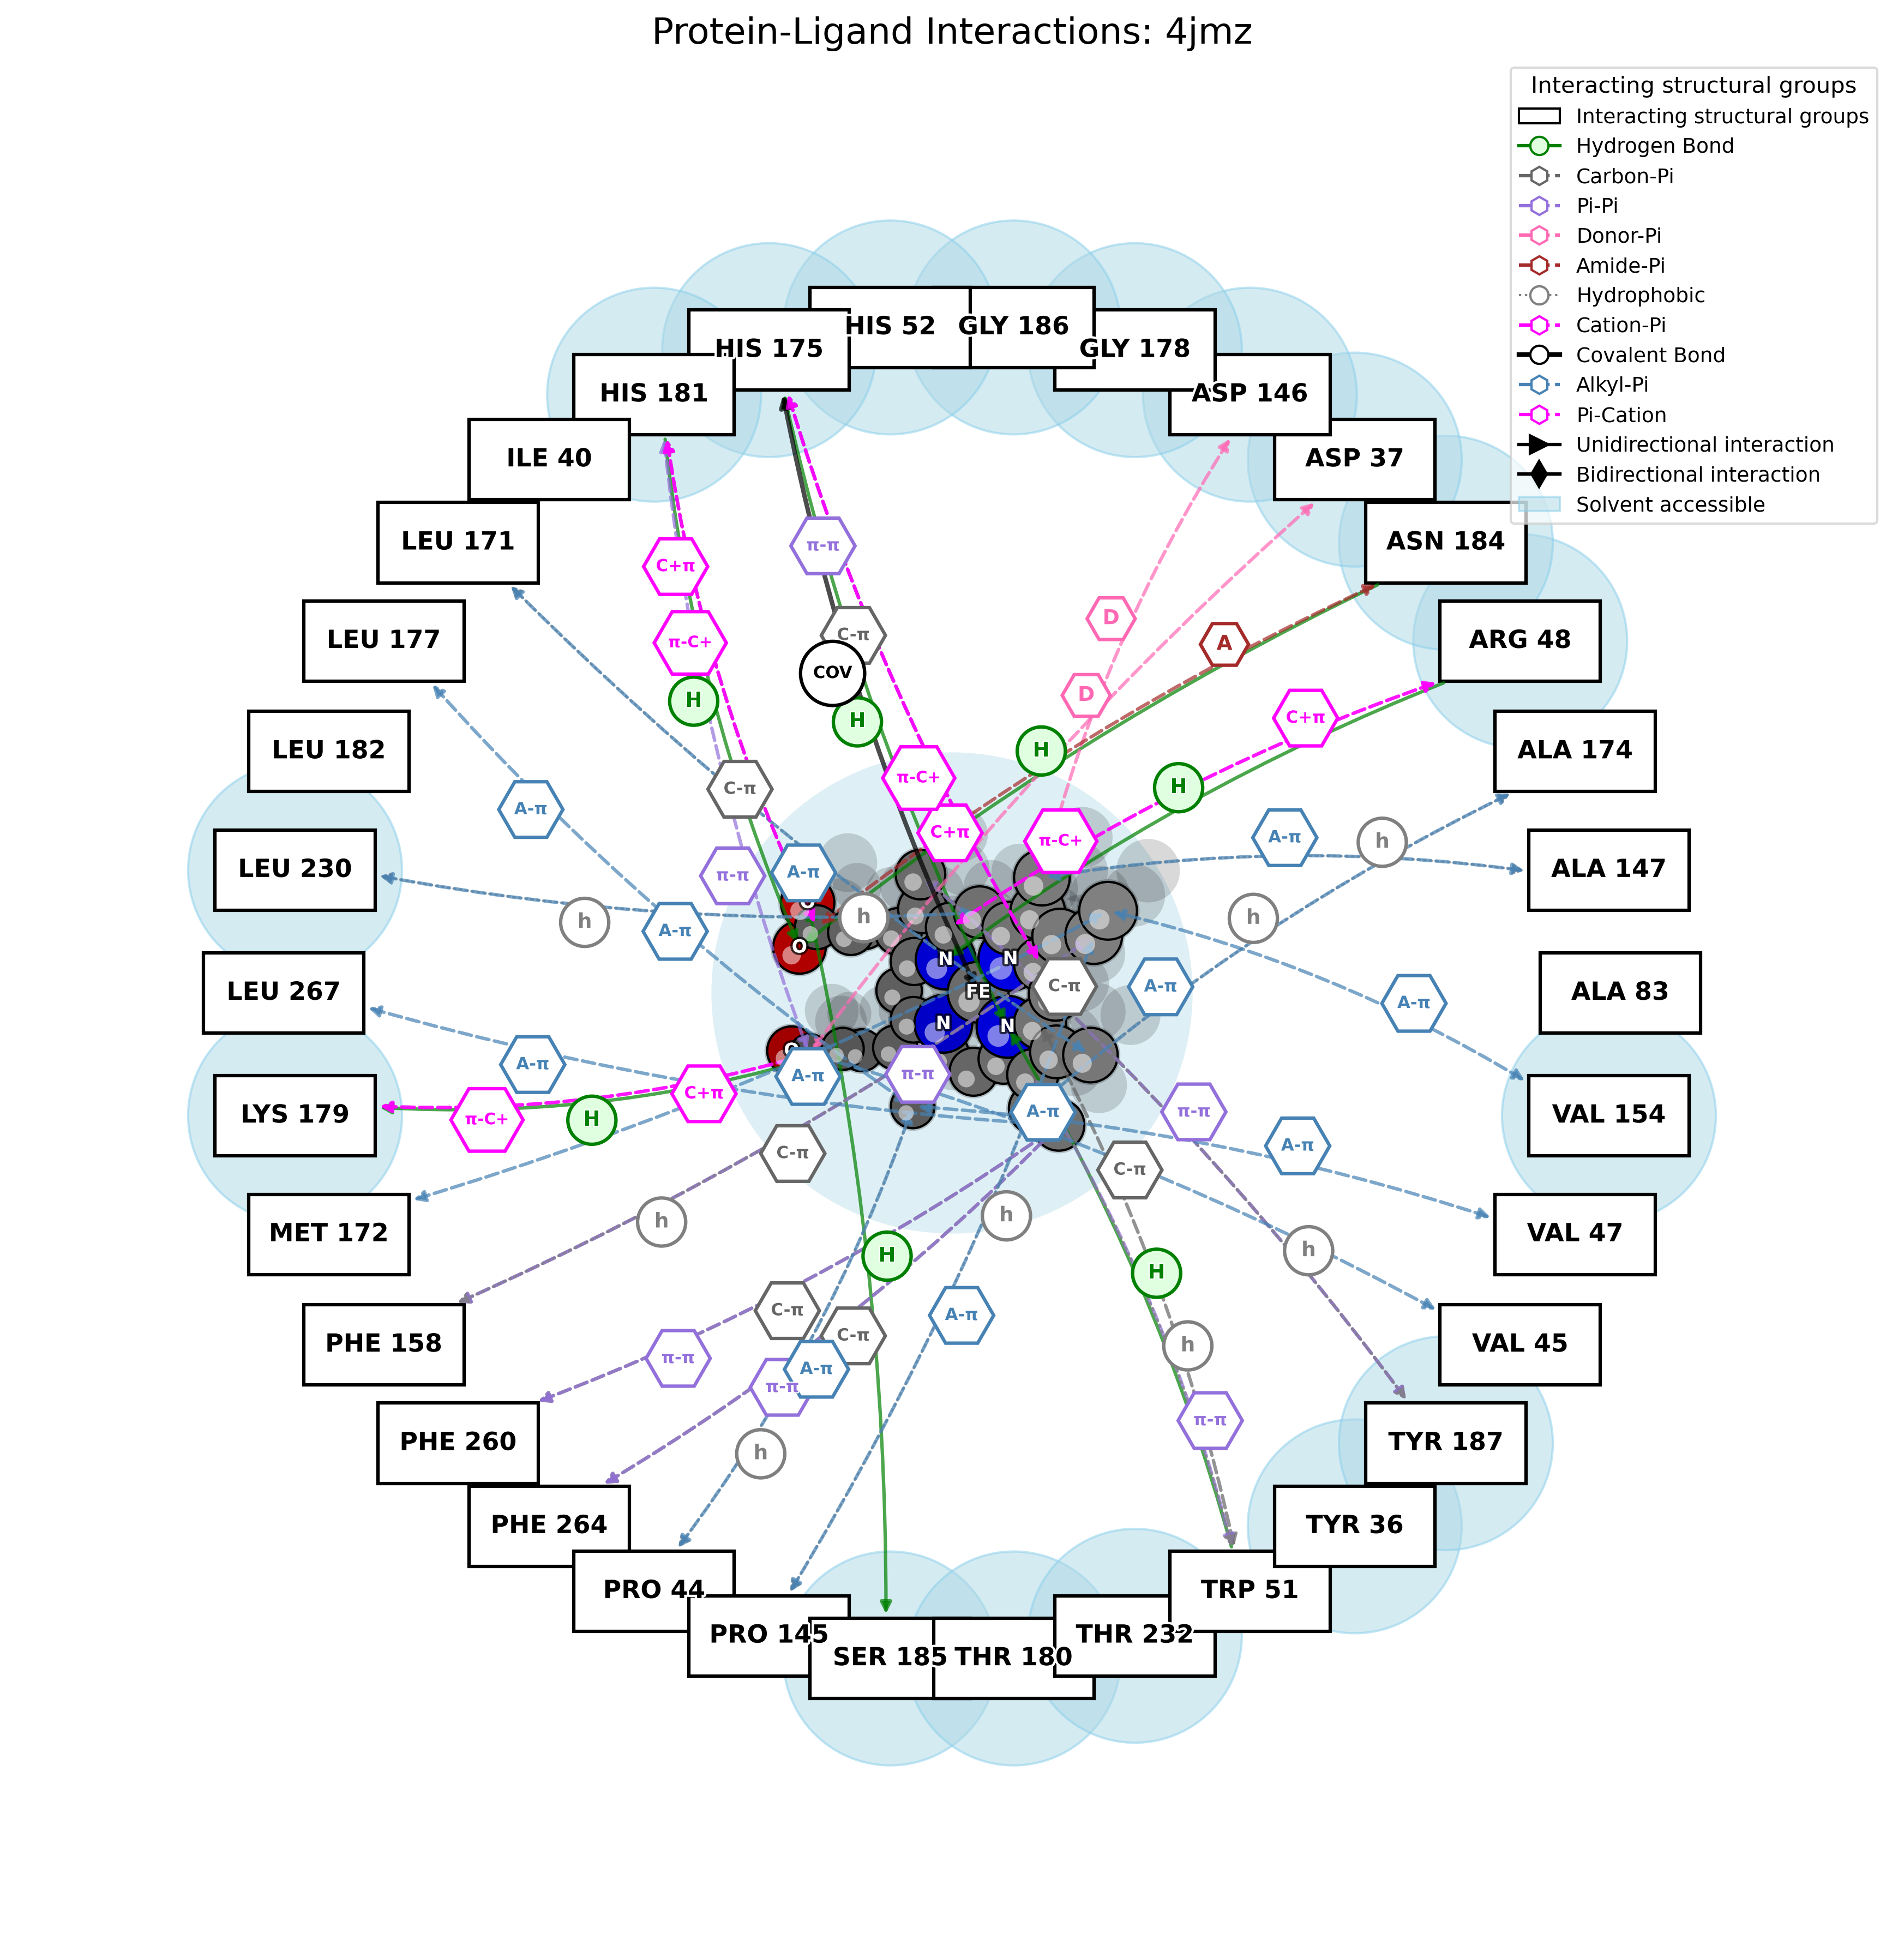
pandamap 4jmz.pdb --ligand HEM --report --report-file HEM.txt
pandamap 1m17.pdb --ligand AQ4 --report --report-file 1m17.txt
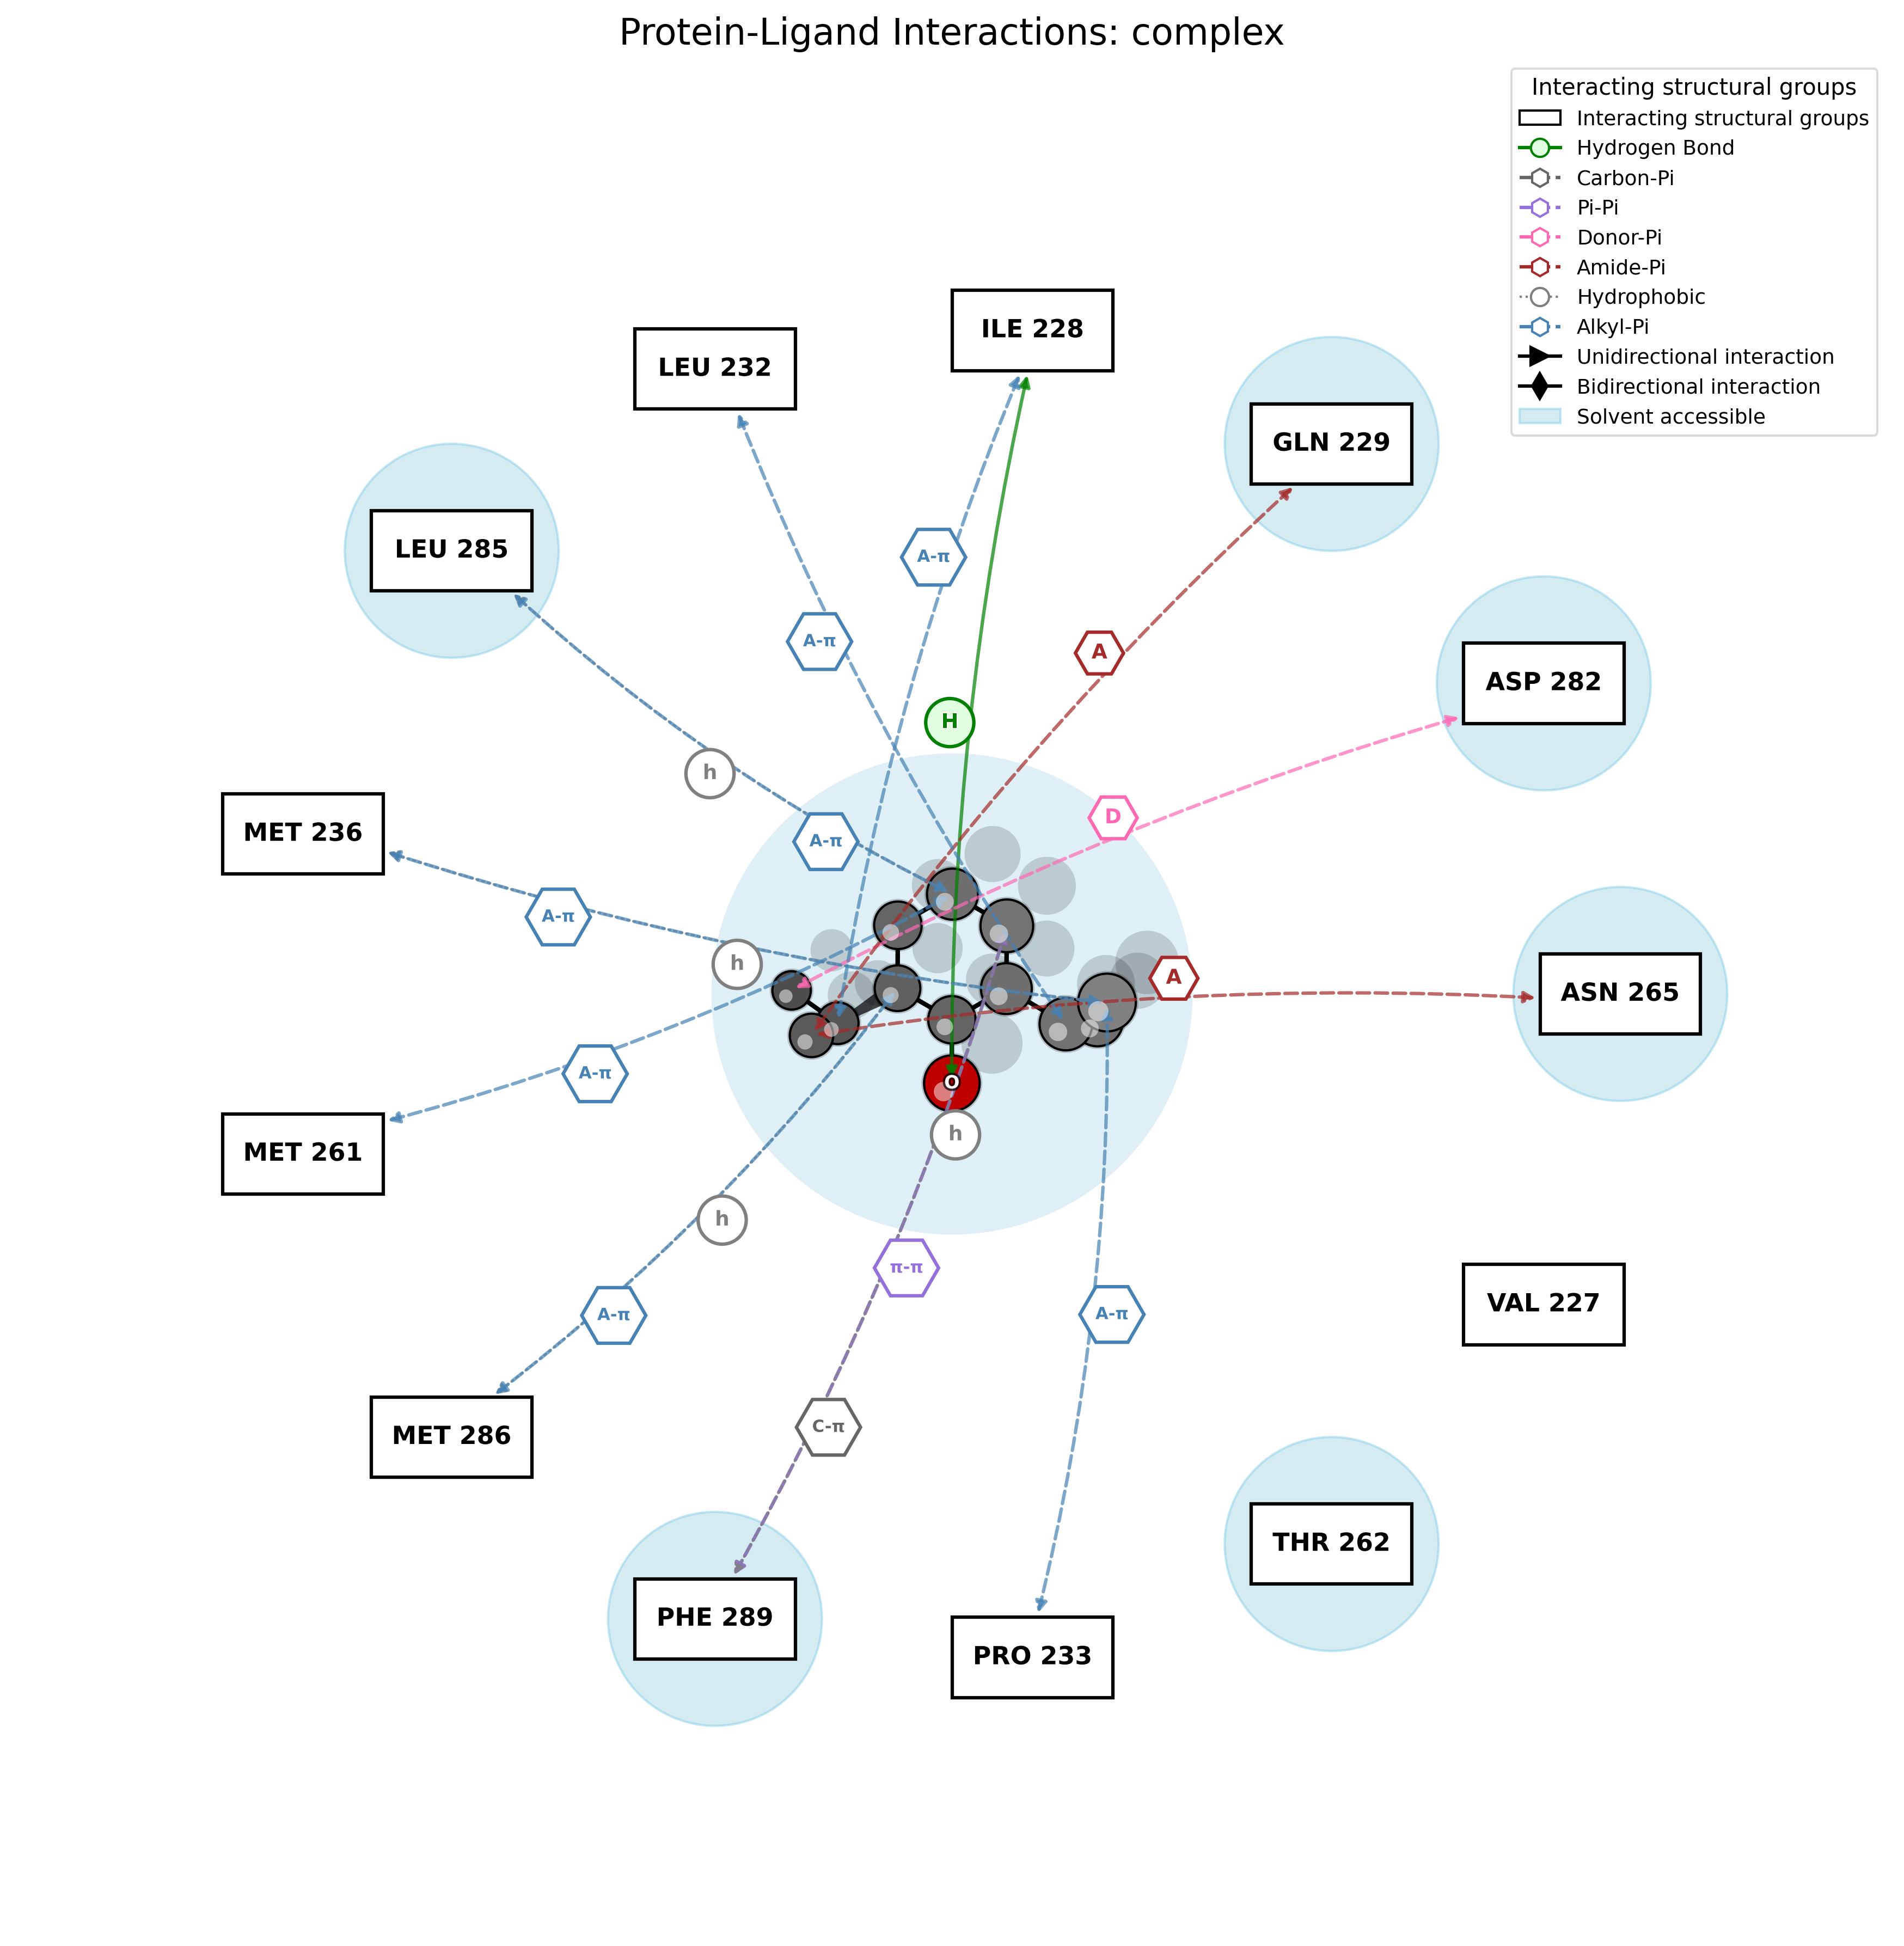
# Full analysis: image + report
pandamap complex.pdb --ligand PFL --output complex.png --report --report-file complex.txt# Basic 3D HTML map
pandamap protein_ligand.pdb --3d
# Save HTML to custom file
pandamap complex.pdb --ligand LIG --3d --3d-output interaction.html
# Full combo: 2D image + 3D HTML + report
pandamap structure.pdb --ligand LIG --output map.png --3d --3d-output map.html --report --report-file map.txt
# Customize 3D size
pandamap structure.pdb --3d --width 1024 --height 768 --no-surfacefrom pandamap import HybridProtLigMapper
# Basic initialization
mapper = HybridProtLigMapper("protein_ligand.pdb", ligand_resname="LIG")
# Run full workflow and generate 2D image
mapper.run_analysis()
mapper.visualize(output_file="interactions.png")
# Generate interactive 3D HTML
from visualization_3d import create_pandamap_3d_viz
create_pandamap_3d_viz(mapper, output_file="interactions.html")# Use DSSP for accurate surface exposure detection
mapper.run_analysis(use_dssp=True)
mapper.visualize(output_file="with_dssp.png")Or fallback to Python-only:
mapper.run_analysis(use_dssp=False)
mapper.visualize(output_file="pure_python.png")from improved_interaction_detection import ImprovedInteractionDetection
mapper = HybridProtLigMapper("protein.pdb", ligand_resname="LIG")
mapper.run_analysis()
# Optional: refine results
detector = ImprovedInteractionDetection()
filtered = detector.refine_interactions(mapper.interactions)
# Write to report
detector.generate_report(
ligand_metadata={
'hetid': mapper.ligand_residue.resname,
'chain': mapper.ligand_residue.parent.id,
'position': mapper.ligand_residue.id[1],
'longname': mapper.ligand_residue.resname,
'type': 'LIGAND',
},
interaction_data=filtered,
output_file="filtered_report.txt"
)pandamap -h
pandamap --version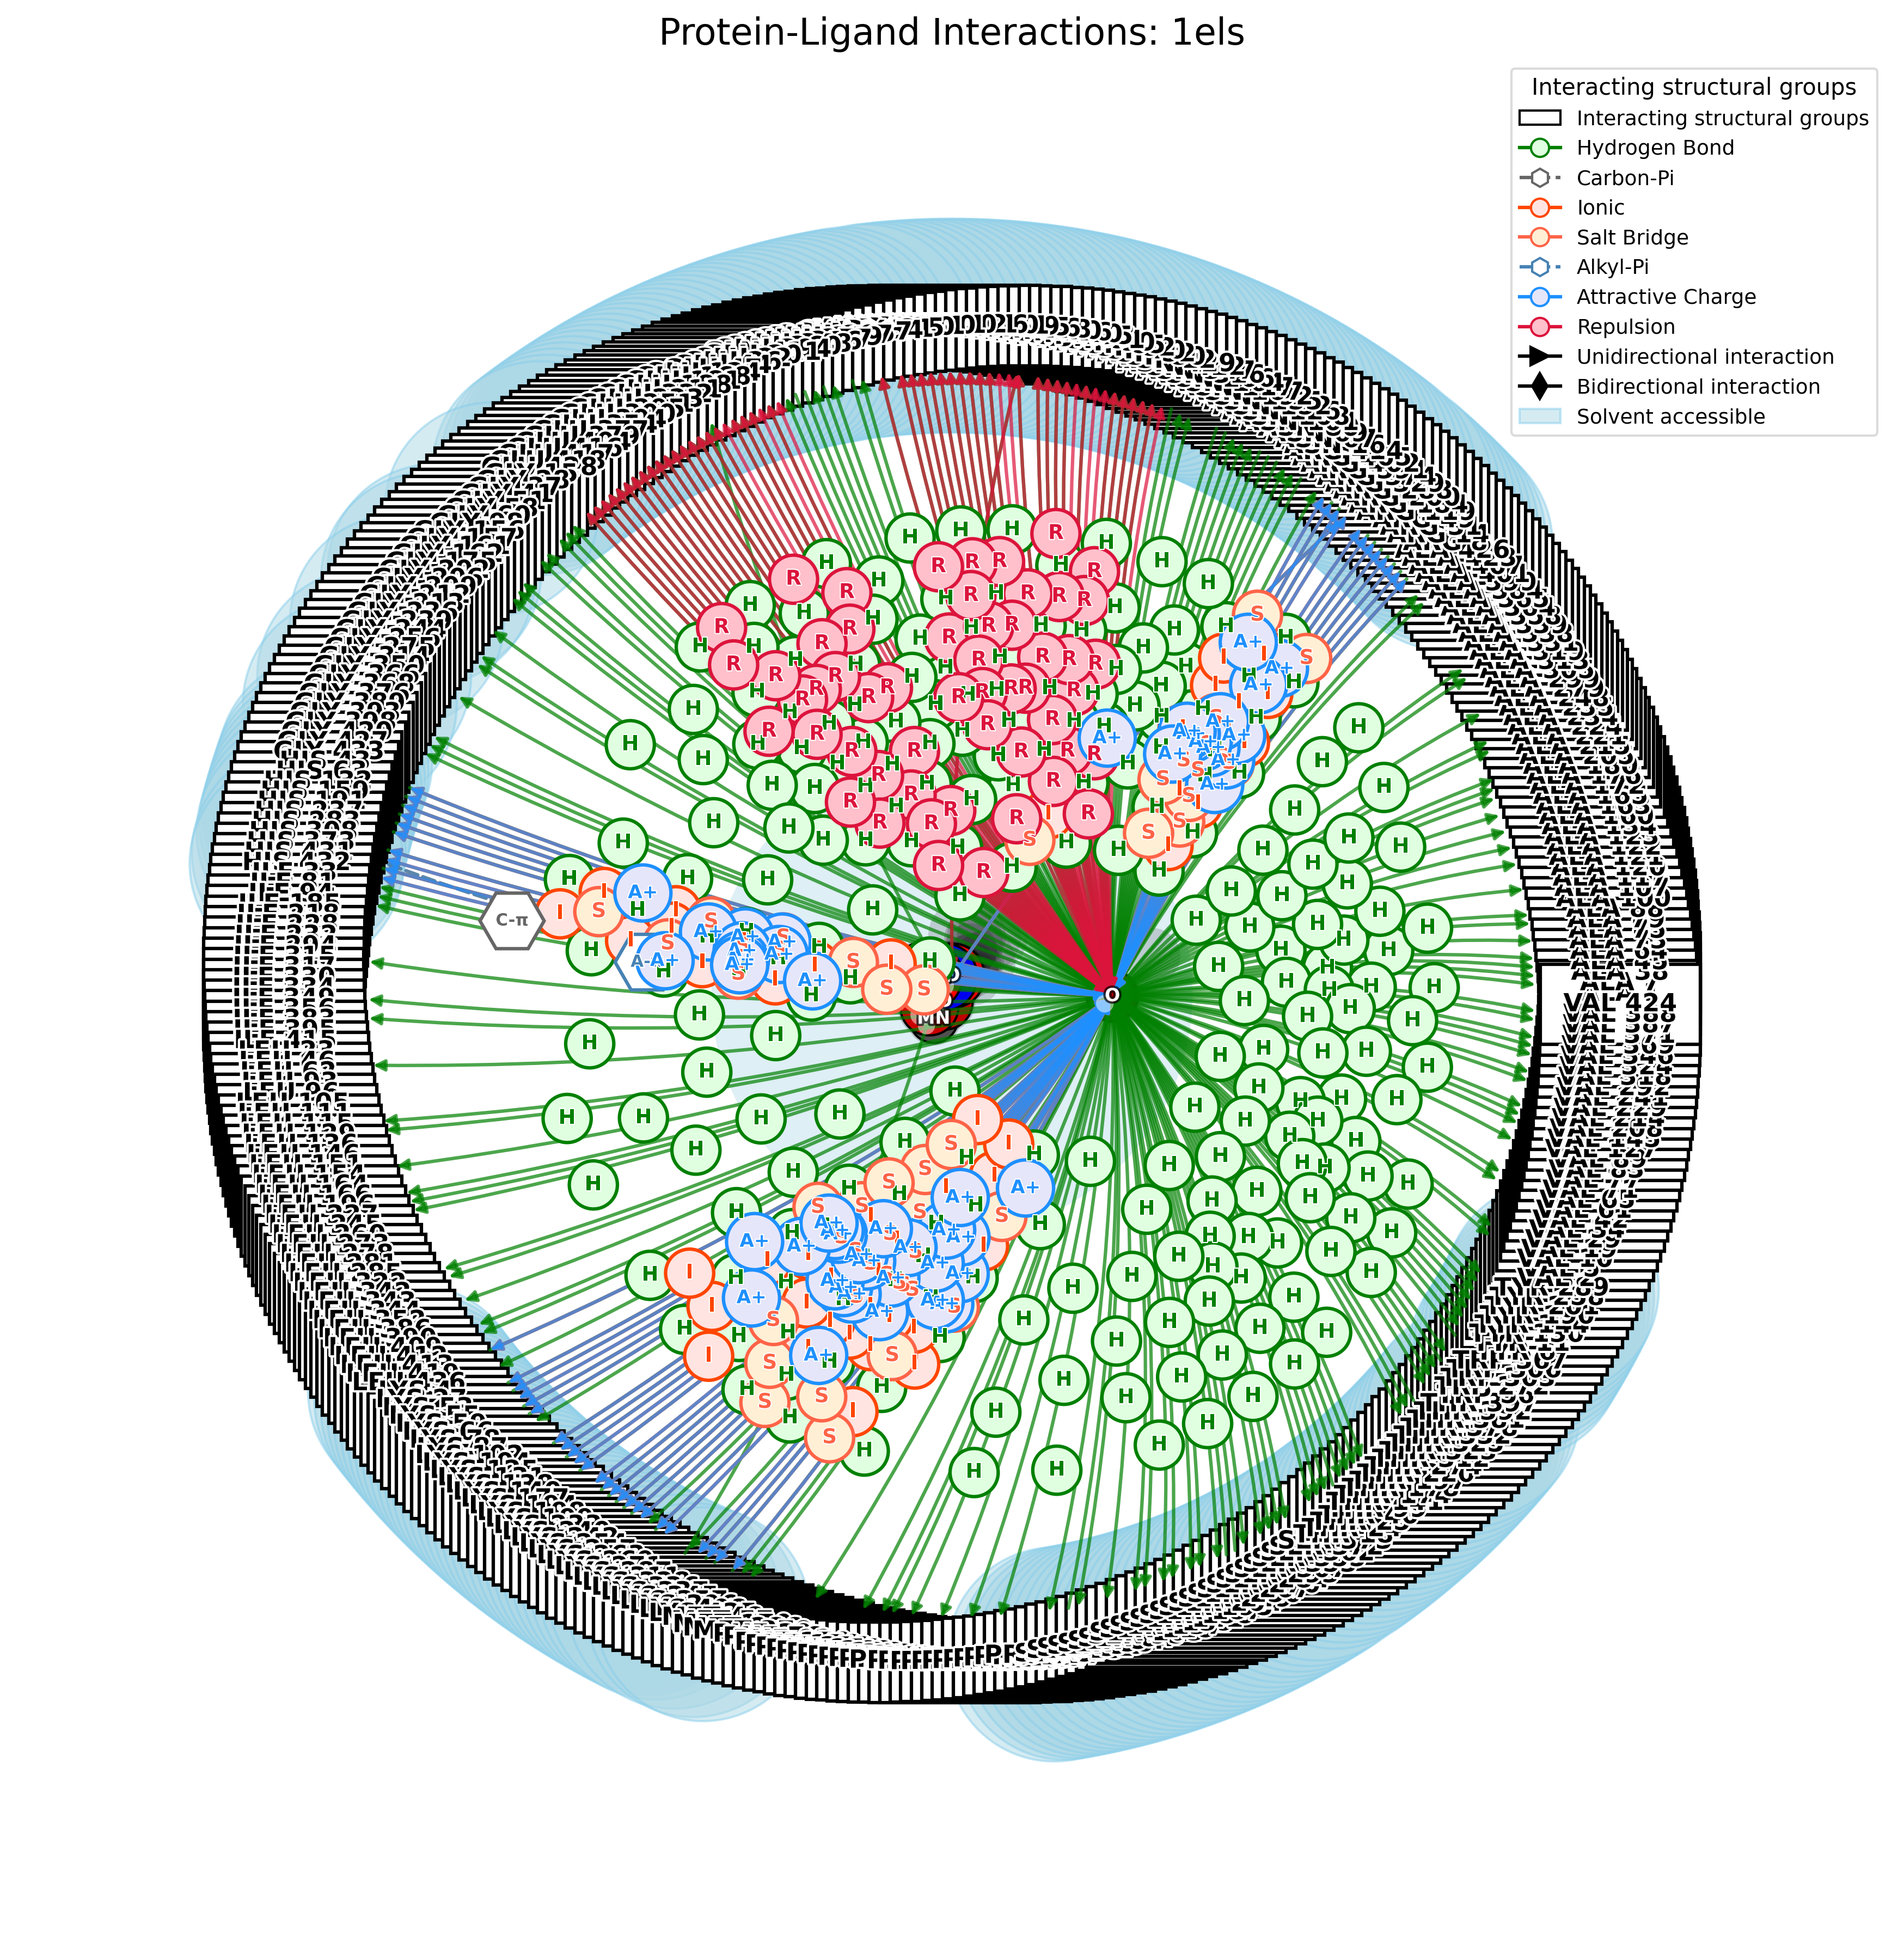
=============================================================================
PandaMap Interaction Report
=============================================================================

Ligand: PAH:A:439
Name: PAH
Type: LIGAND

------------------------------

Interacting Chains: A
Interacting Residues: 13

------------------------------

Interaction Summary:
  Hydrogen Bonds: 10
  Carbon-π Interactions: 1
  Metal Coordination: 4
  Ionic Interactions: 2
  Salt Bridges: 2
  Alkyl-π Interactions: 1
  Attractive Charge: 2
  Repulsion: 5

------------------------------

Hydrogen Bonds:
  1. GLU168A  -- 2.66Å -- PAH
  2. ASP246A  -- 2.60Å -- PAH
  3. GLN167A  -- 3.10Å -- PAH
  4. ASP320A  -- 3.46Å -- PAH
  5. LYS396A  -- 3.05Å -- PAH
  6. SER375A  -- 2.82Å -- PAH
  7. SER39A  -- 3.06Å -- PAH
  8. ARG374A  -- 2.98Å -- PAH
  9. GLY37A  -- 3.36Å -- PAH
  10. LYS345A  -- 3.21Å -- PAH

------------------------------

Carbon-π Interactions:
  1. HIS373A  -- 4.29Å -- PAH

------------------------------

Metal Coordination:
  1. ASP246A  -- 2.24Å -- PAH
  2. GLU295A  -- 2.24Å -- PAH
  3. ASP320A  -- 2.19Å -- PAH
  4. GLY37A  -- 2.12Å -- PAH

------------------------------

Ionic Interactions:
  1. ARG374A  -- 2.98Å -- PAH
  2. LYS345A  -- 3.21Å -- PAH

------------------------------

Salt Bridges:
  1. ARG374A  -- 2.98Å -- PAH
  2. LYS345A  -- 3.21Å -- PAH

------------------------------

Alkyl-π Interactions:
  1. HIS373A  -- 5.27Å -- PAH

------------------------------

Attractive Charge:
  1. ARG374A  -- 2.98Å -- PAH
  2. LYS345A  -- 3.21Å -- PAH

------------------------------

Repulsion:
  1. ASP320A  -- 3.46Å -- PAH
  2. GLU168A  -- 3.10Å -- PAH
  3. ASP246A  -- 2.60Å -- PAH
  4. GLU295A  -- 3.95Å -- PAH
  5. GLU211A  -- 4.34Å -- PAH

=============================================================================
If you use PandaMap in your research, please cite:
Pritam Kumar Panda. (2025). Protein AND ligAnd interaction MAPper: A Python package for visualizing protein-ligand interactions with 2D ligand structure representation. GitHub repository. https://github.com/pritampanda15/PandaMap
This project is licensed under the MIT License - see the LICENSE file for details.