IndexedDB Debug Bar - 🌐 Live Demo
A tool to make IndexedDB development easier Browser devtools for IndexedDB are often limited, making debugging and optimizing IndexedDB painful. IndexedDB Debug Bar bridges this gap by providing debugging capabilities right inside your app. A zero-config panel that lets you browse, query and profile IndexedDB.
npm i indexeddb-debug-barimport IndexedDBDebugBar from 'indexeddb-debug-bar';
new IndexedDBDebugBar('your-db-name');You can optionally use a Dexie.js instance to view your app’s transaction history and performance. There's also Dexie Cloud support, which lets you debug your cloud app and view activity log for sync operations.
import IndexedDBDebugBar from 'indexeddb-debug-bar';
import Dexie from "dexie";

const db = new Dexie("MyDatabase");
db.version(1).stores({
  items: "++id, name",
});
new IndexedDBDebugBar(db);React - LIVE DEMO
import IndexedDBDebugBar from 'indexeddb-debug-bar/react';

<IndexedDBDebugBar db={'your-db-name'} options={{ ...optional }} />
Vue - LIVE DEMO
<script setup>
import IndexedDBDebugBar from 'indexeddb-debug-bar/vue';
</script>
<template>
  <IndexedDBDebugBar db='your-db-name' :options={{ ...optional }} />
</template>
CDN - LIVE DEMO
<script src="https://cdn.jsdelivr.net/npm/indexeddb-debug-bar@latest/dist/browser/indexeddb-debug-bar-browser.umd.js"></script>
<script>
    new IndexedDBDebugBar();
</script>dexie-cloud-demo.mp4
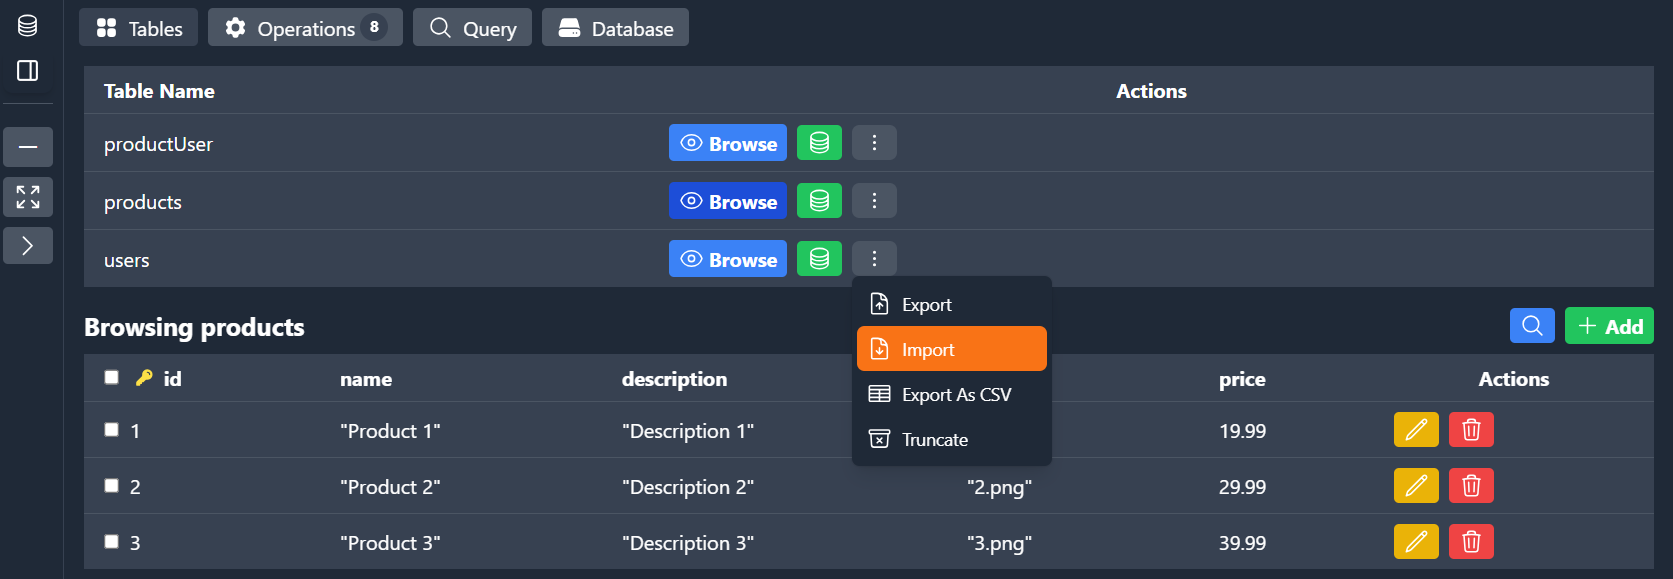
- CRUD Operations with Inline Editing: View, create, update, and delete entries directly from the interface.
- GUI Query Builder: Build and test queries visually.
- Import & Export: Import and export single tables or the entire database.
- Query Performance Insights: Logs showing query durations to help optimize your database interactions.
- Transaction History Logs: Keep track of transactions and roll back effortlessly.
- Dexie.js Cloud Devtools: Enhanced debugging and development experience for Dexie.js Cloud integrations.
| Prop | Type | Default | Description |
|---|---|---|---|
db |
Dexie | string |
required | Dexie instance or database name to attach the Debug Bar to |
initialLayout |
Layout |
{ position: 'left', isCollapsed: false, isFullScreen: false, isMinimized: false } |
Initial layout settings for the bar |
| Option | Type | Default | Description |
|---|---|---|---|
position |
'top' | 'bottom' | 'left' | 'right' |
'bottom' |
Where to dock the Debug Bar on the viewport |
isCollapsed |
boolean |
true |
If true, only the bar’s header is shown (content is hidden) |
isFullScreen |
boolean |
false |
If true, the bar expands to cover the entire viewport |
isMinimized |
boolean |
false |
If true, the bar is minimized to an icon (click to restore) |
MIT
Feel free to contribute to the project by creating issues or pull requests. Contributions, bug reports, and feature requests are welcome!