![]()
The dataset used in this analysis is sourced from the World Development Indicators dataset for the year 2015. You can access the data from the following URL: World Development Indicators 2015 Dataset.
The script loads the World Development Indicators dataset into a Pandas DataFrame.
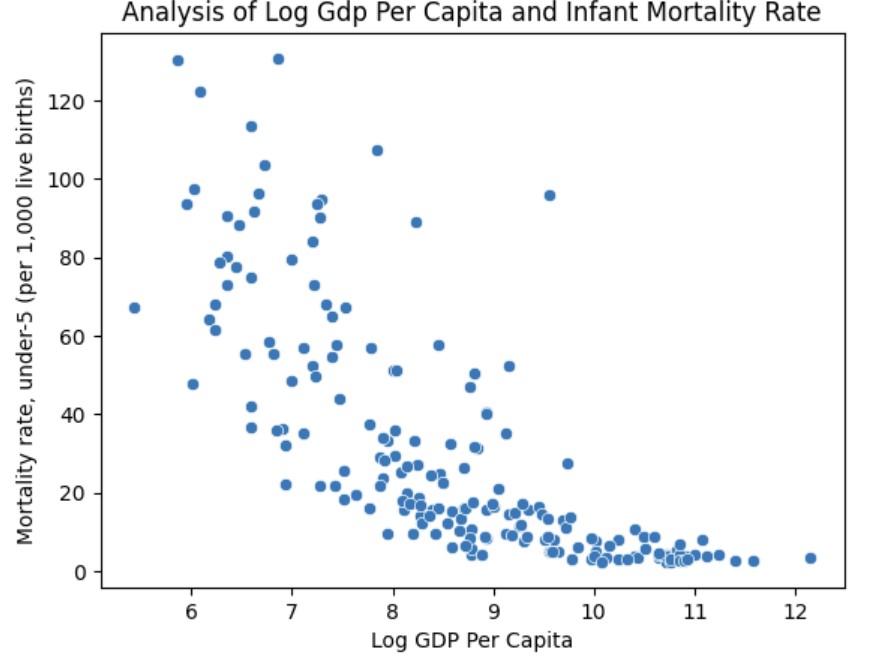
It calculates the logarithm of the GDP per capita variable to analyze its relationship with the infant mortality rate.
A scatterplot is created using Seaborn to visually represent the relationship between log GDP per capita and infant mortality rate.
A function named computation is defined to compute descriptive statistics for the log GDP per capita variable, including the mean, median, and standard deviation.
The computation function is called with the DataFrame as input to calculate and display the statistics.
After executing the code, the following descriptive statistics were obtained for the log GDP per capita variable:
- Mean: 8.6995653667
- Median: 8.7217498371
- Standard Deviation: 1.47
These statistics offer insights into the central tendency and spread of the log GDP per capita data, contributing to a better understanding of its distribution.
The visualization below illustrates the relationship between the predictor variable (Log GDP Per Capita) and Infant Mortality Rate.
This script facilitates the exploration of the relationship between log GDP per capita and infant mortality rate using World Development Indicators data. It provides essential descriptive statistics for further analysis.