Research entitled: "Analisis Sentimen Mahasiswa di Surabaya Terhadap Pelayanan Vaksinasi COVID-19 Menggunakan Beberapa Classifier" or "Analysis of Student Sentiment in Surabaya Towards COVID-19 Vaccination Services Using Several Classifiers".
The machine learning models that used in this application are already parameter tuned using GridSearchCV and handled imbalance dataset using RandomUnderSampler.
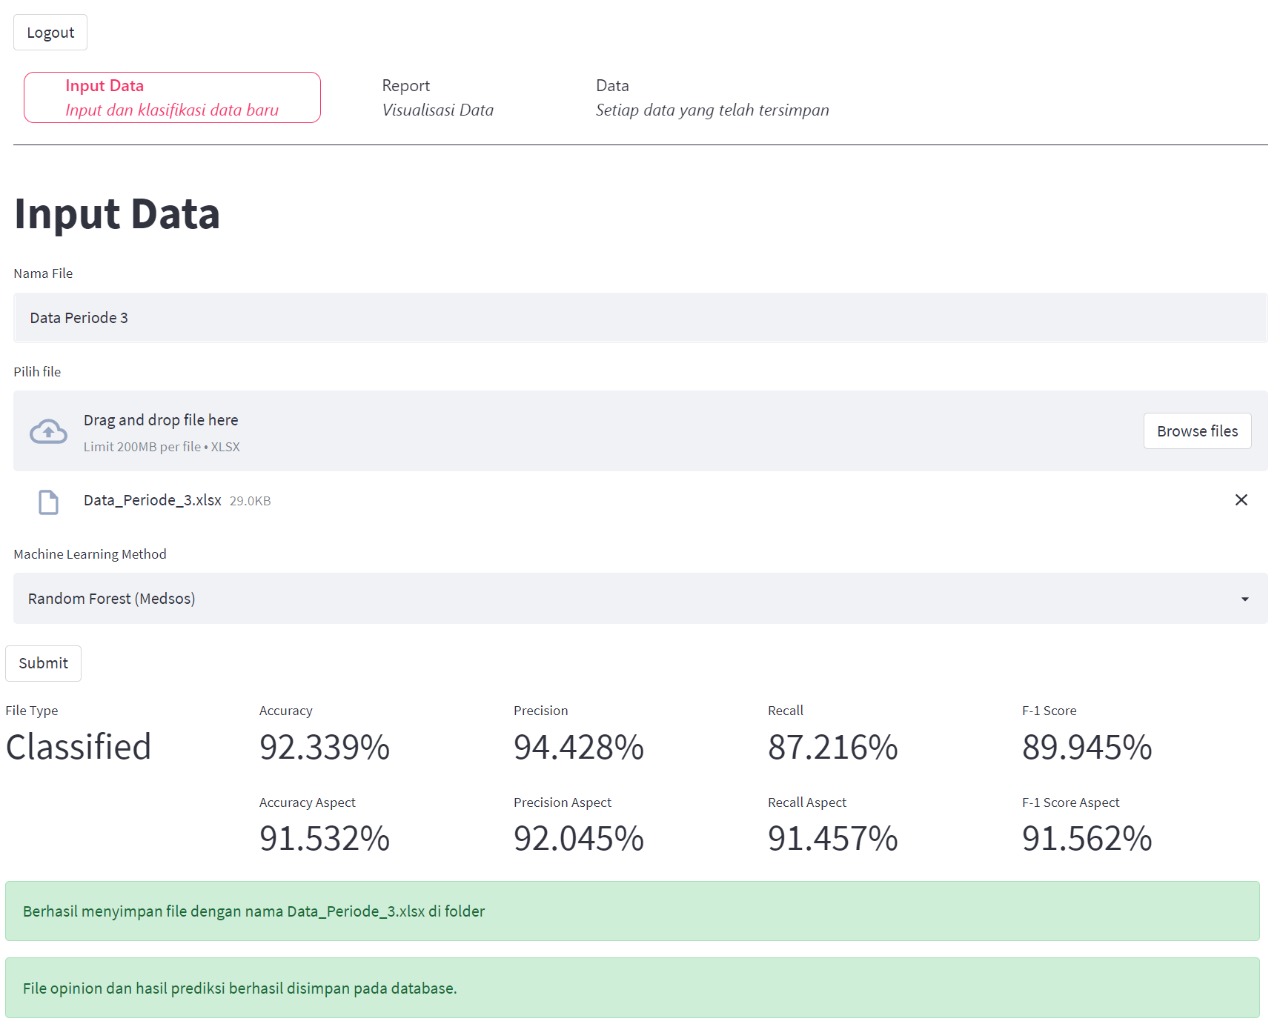
This application was made with Streamlit and the main file that must be run to open the application is called skripsi.py In this sentiment analysis app, there are 3 main features: Data Entry Page, Visualization Page, and Data Page. Data Entry Page (input.py) will be called after you logged in to the app and you can entry data in the form of file (.xlsx) or text. Then when Submit button is clicked, the machine learning model will do their job to classify the aspects and sentiment analysis. There are 2 kind of file you can entry in this app, Classified file and Unclassified file. The file can be called as Classified file if the file has opinion / text, aspect label, and sentiment label. The file can be called as Unclassified file if it contains only opinion / text column. And when you input text in the text box, then click submit. You will get the aspect and sentiment of the text. There 5 aspects that can be classify in this research:
- Informasi
- Tempat
- Waktu
- Protokol
- Sertifikat
Beside aspect, there 2 sentiments (Positif and Negatif).
Here is the display of Data Entry Page:
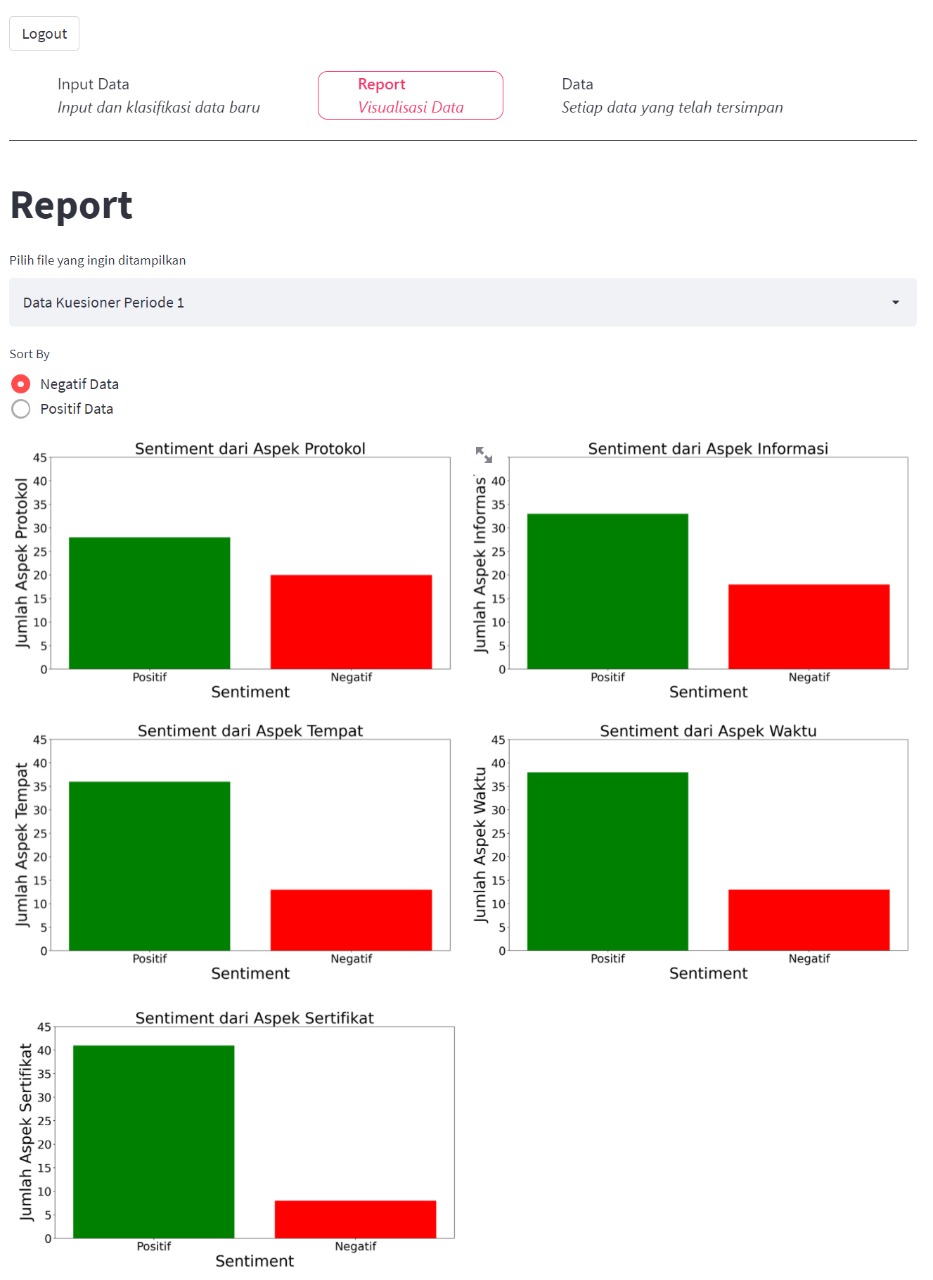
 The second feature is Visualization Page. When you have submitted the file and the model has done their job to classify. The predicted result and the texts will be saved to database. Then you can see the data in the form of bar charts based on aspect.
You can sort the bar chart based on the aspect that has the biggest amount of Positif Data or Negatif Data on 'Sort By' feature at that page.
Here is the look of the Visualization Page:
The second feature is Visualization Page. When you have submitted the file and the model has done their job to classify. The predicted result and the texts will be saved to database. Then you can see the data in the form of bar charts based on aspect.
You can sort the bar chart based on the aspect that has the biggest amount of Positif Data or Negatif Data on 'Sort By' feature at that page.
Here is the look of the Visualization Page:
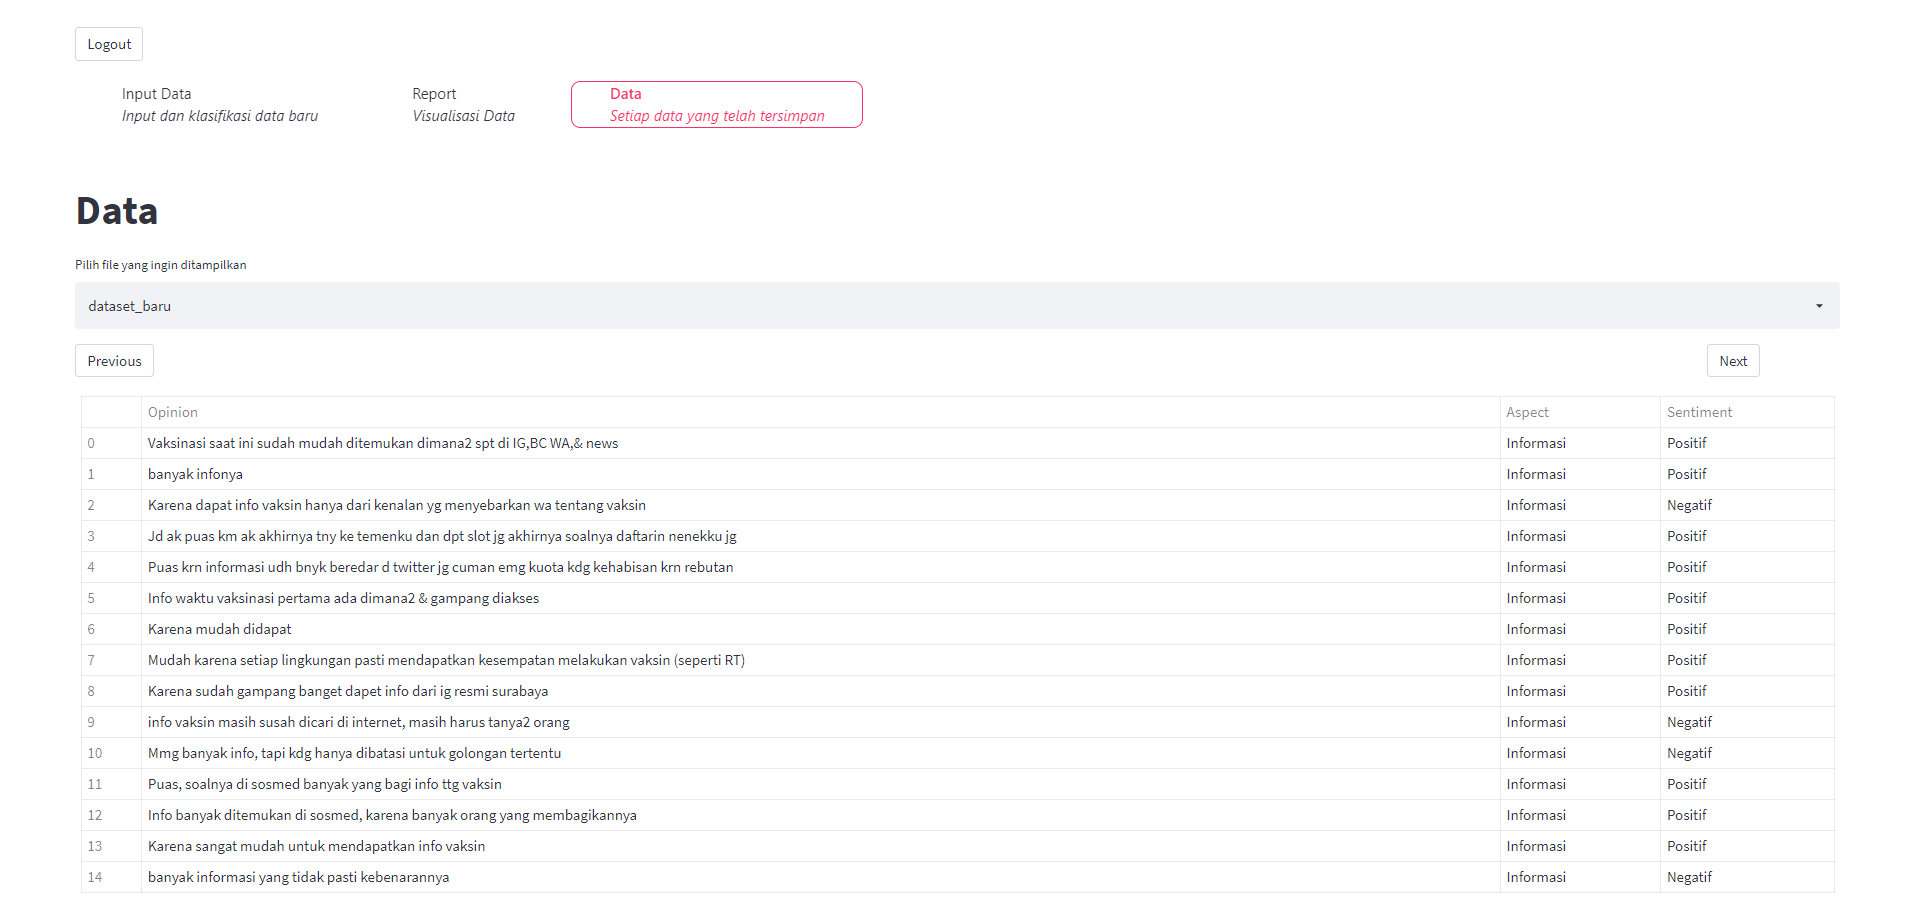
 And the last feature is Data Page where you can read all rows of your data that have been saved to the database.
Here is the display of the Data Page:
And the last feature is Data Page where you can read all rows of your data that have been saved to the database.
Here is the display of the Data Page: