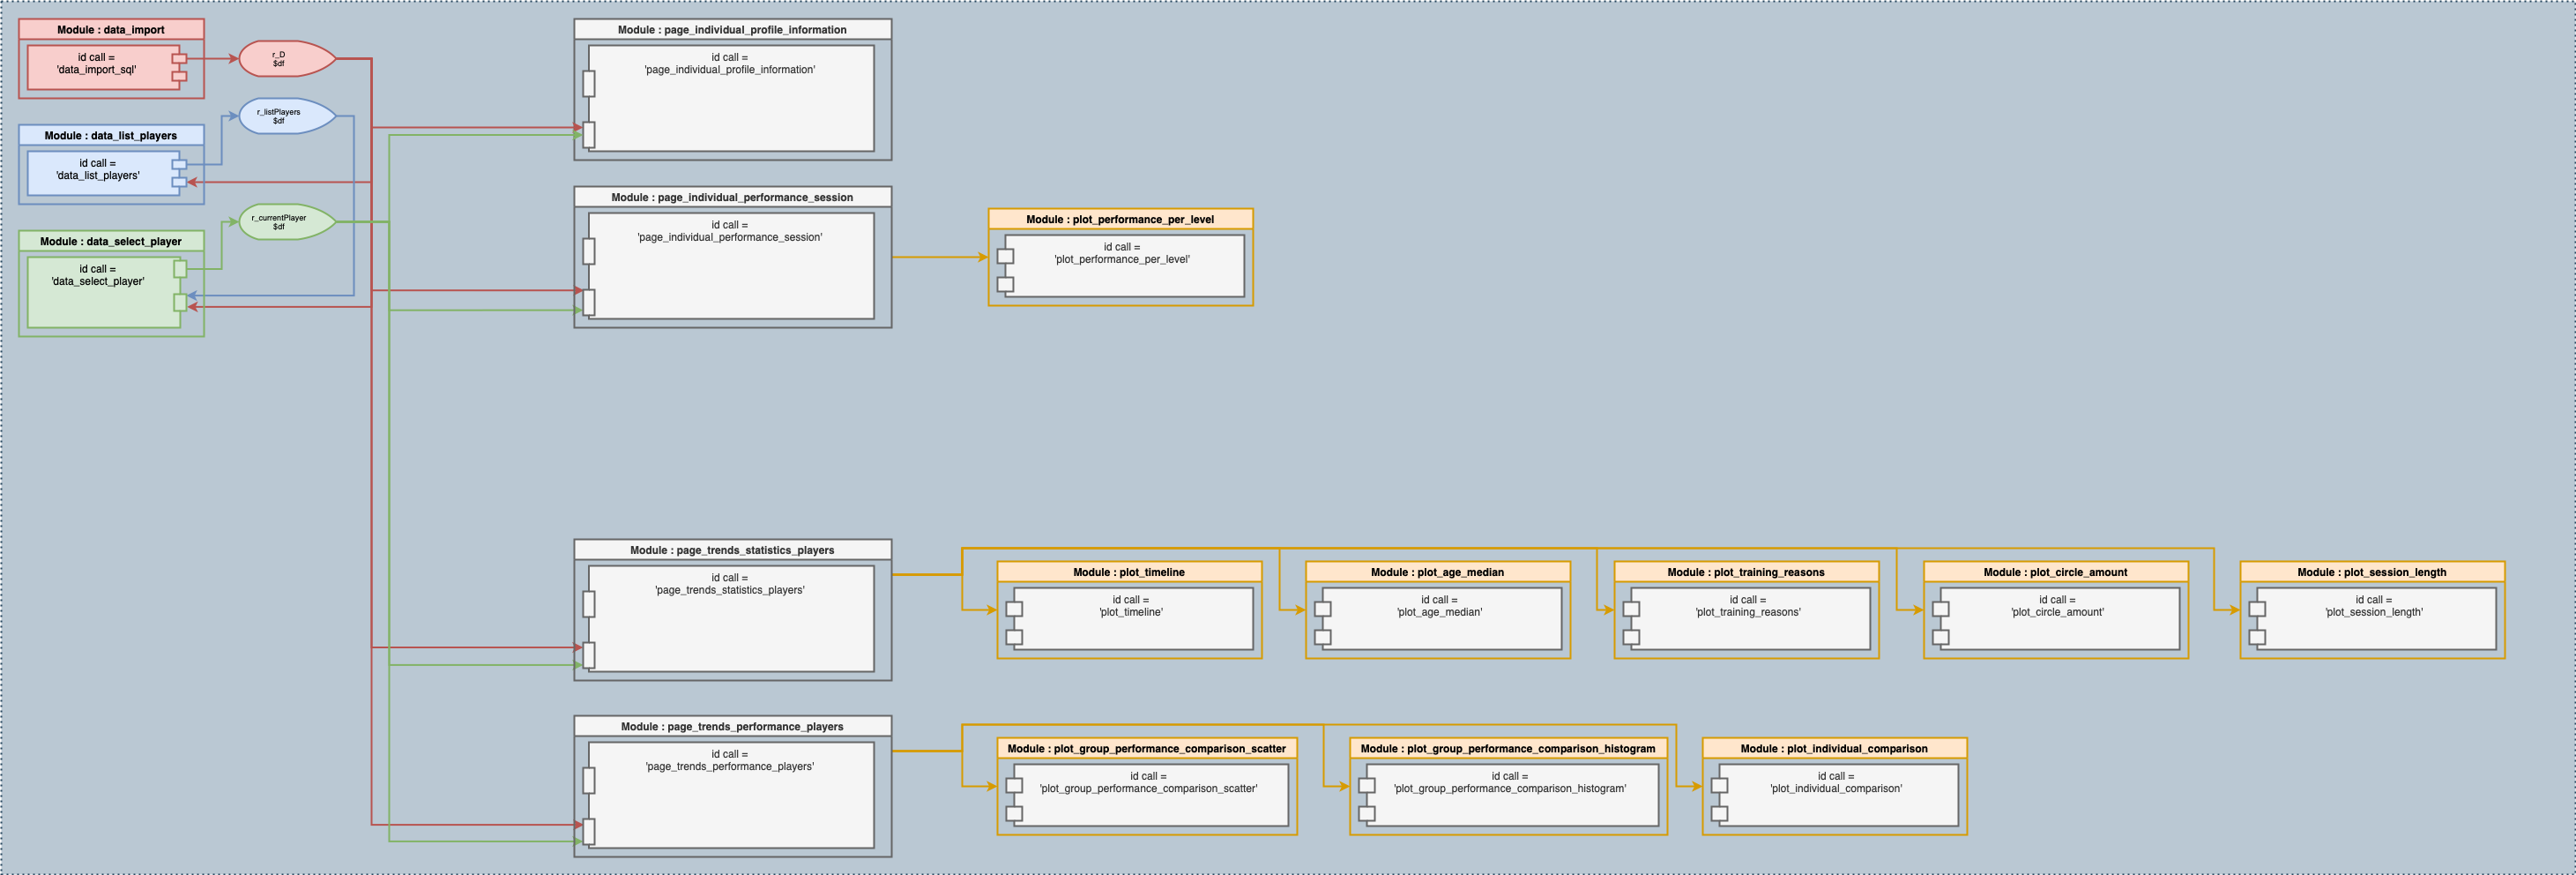
the dashboard is divided into modules :
- Modules Data returns a data.
- Modules Page contains the skeleton of a page.
- Module Plot create the graph.
This module takes care of the connection to the MySQL database in order to recover all the data which will then be sent to the Server.R. The credentials are retrieved from the credentials.csv file.
mydb = dbConnect(MySQL(),
                     user=credentials[1, "username"],
                     password=credentials[1, "password"],
                     dbname=credentials[1, "dbname"],
                     host=credentials[1, "host"])
in order to resolve problems, bugs and conflicts, modifications are made to our data :
- Add a column Timestamp
- Delete duplicate rows
- Remove rows that have a negative reaction time
- Add a column sessionID
this module creates from D, a new data.frame which gathers the profileID and their playerName. The two columns are concatenated in the column playerNameID. As in the example below :
| profileID | playerName | playerNameID |
|---|---|---|
| id0 | name1 | name1 ( id0 ) |
| id1 | name2 | name2 ( id1 ) |
playerNameID will be useful when the user will have to select a player. If two players have the same playerName, the user will be able to identify them by the profileID available in parentheses.
This module takes care of changing the current player. It returns the profileID.