Display bevy diagnostics on the window without any hassle.
What this can do:
- easy frame and entity dignostics
- add custom diagnostics
- change display of diagnostics on the fly
- toggle diagnostics easily
see the examples on how to do this.
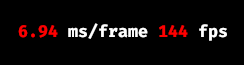
This adds the framerate and frametime diagnostics to your window.
use bevy::prelude::*;

use bevy_screen_diagnostics::{ScreenDiagnosticsPlugin, ScreenFrameDiagnosticsPlugin};

fn main() {
    App::new()
        .add_plugins(DefaultPlugins)
        .add_plugins(ScreenDiagnosticsPlugin::default())
        .add_plugins(ScreenFrameDiagnosticsPlugin)
        .add_systems(Startup, setup_camera)
        .run();
}

fn setup_camera(mut commands: Commands) {
    commands.spawn(Camera2d);
}
The ScreenFrameDiagnosticsPlugin is a very simple plugin
bevy_screen_diagnostics provides the following bevy plugins:
- [
ScreenDiagnostics] which offers the basic functionality of displaying diagnostics. - [
ScreenFrameDiagnosticsPlugin] display the framerate and frametime (also adds the corresponding bevy diagnostic plugin) - [
ScreenEntityDiagnosticsPlugin] display the amount of entities (also adds the corresponding bevy diagnostic plugin) - [
ScreenSystemInformationDiagnosticsPlugin] featuresysinfo_pluginonly, display the memory and CPU usage of this process and the entire system (also adds the corresponding bevy diagnostic plugin)
This crate uses bevy's default font (a stripped version of FiraCode) through the builtin-font default feature.
You can provide your own font while initialising the ScreenDiagnosticsPlugin by passing it a asset file path.
| bevy | bevy_screen_diagnostics |
|---|---|
| 0.16 | 0.8.1 |
| 0.15 | 0.7 |
| 0.14 | 0.6 |
| 0.13 | 0.5 |
| 0.12 | 0.4 |
| 0.11 | 0.3 |
| 0.10 | 0.2 |
| 0.9 | 0.1 |