Emma Whitfield (@ekw26) and Claire Coffey(@clairecoffey)
Preprint: Emma Whitfield, Claire Coffey, Huayu Zhang, Ting Shi, Xiaodong Wu, Qiang Li, Honghan Wu. Axes of Prognosis: Identifying Subtypes of COVID-19 Outcomes. medRxiv 2021.03.16.21253371; doi: 10.1101/2021.03.16.21253371
We removed duplicate records, leaving 2797 patients for whom a wide range of features were available, including general patient information, co-morbidities, symptoms (recorded as Chinese freetext), lab test results, ICD-10 admission and discharge codes, and other prognosis features (death, ICU admission, supplementary oxygen, length of stay). We used the Python package Googletrans to translate Chinese freetext, then used spaCy to extract keywords relating to smoking and used these to categorise smoking as a binary yes (1) or no (0). %text related to symptoms and build a thesaurus of symptoms. We then used pattern matching to identify symptoms recorded for each patient
For discharge codes, we used the python packages icd10-cm and icd10-c2d to trim ICD-10 discharge codes (provided as 11-character strings) until they matched a valid ICD-10 code. We removed codes U07.1 - COVID-19 and Z22 - Carrier of infectious disease as, predictably, these were reported for the majority of patients. Since we wished to explore outcomes caused by COVID-19, we discarded codes related to highly prevalent pre-existing conditions, removing I10 - Essential (primary) hypertension and E11.9 - Type 2 diabetes mellitus without complications.
Given possible heterogeneity in reporting amongst clinicians, we used only chapter level information of ICD-10 codes - overall chapter counts of discharge codes are shown in the Table below. For each patient, we recorded presence of a discharge code from each chapter, resulting in a binary vector for each patient (1: presence of code from chapter; 0: no code from chapter). Note that in this cohort, many people with only mild symptoms were admitted to hospital. This meant that, after removal of the above codes, there were 1742 patients with no recorded discharge codes.
| ICD-10 Chapter | Count |
|---|---|
| Abnormal Labs | 153 |
| Blood/Immune | 137 |
| Circulatory | 435 |
| Congenital | 5 |
| Digestive | 183 |
| Ear | 7 |
| Eye | 10 |
| Genitourinary | 112 |
| Health Status | 131 |
| Infectious diseases | 75 |
| Injury/Poison | 17 |
| Mental | 29 |
| Musculoskeletal | 93 |
| Neoplasms | 57 |
| Nervous | 35 |
| Nutritional | 348 |
| Pregnancy | 1 |
| Respiratory | 306 |
| Skin | 18 |
Padilla O. Normal Laboratory Values - MSD Manual. MSD Manuals; 2018. Available from:https://www.msdmanuals.com/en-gb/professional/resources/normal-laboratory-values/normal-laboratory-values
NHS. What is blood pressure?. NHS; 2019.Available from:https://www.nhs.uk/common-health-questions/lifestyle/what-is-blood-pressure/.
HF. What is a normal pulse rate?. British Heart Foundation; 2020.Available from:https://www.bhf.org.uk/informationsupport/heart-matters-magazine/medical/ask-the-experts/pulse-rate
BLF. Breathing and lung function tests. British Lung Foundation; 2020. Available from:https://www.blf.org.uk/support-for-you/breathing-tests/tests-measure-oxygen-levels
The Association for Clinical Biochemistry and Laboratory Medicine. C-Reactive protein. Lab Tests Online UK;2020. Available from:https://labtestsonline.org.uk/tests/c-reactive-protein-crp
CLL Society. Normal Lab Values. CLL Society; 2020. Available from:https://cllsociety.org/toolbox/normal-lab-values
Villa P, Jim ́enez M, Soriano MC, Manzanares J, Casasnovas P. Serum cystatin C concentration as a marker ofacute renal dysfunction in critically ill patients. Critical Care. 2005;9(2):1–5
Bounds EJ, Kok SJ. D Dimer. StatPearls Publishing; 2020. Available from:http://www.ncbi.nlm.nih.gov/pubmed/28613718
Whitworth G. Normal respiratory rates: Adults and children; 2019.Available from:https://www.medicalnewstoday.com/articles/324409
Anthony K, Gonzalez A. What Is the Red Cell Distribution Width (RDW) Blood Test?; 2019. Available from:https://www.healthline.com/health/rdw-blood-test
The Dimension Reduction function we used takes the form:

- f_1 is computed by:
d_1 = 0
for chapter_presence, weight in zip([Nervous, Abnormal, Musculoskeletal, Circulatory, Digestive, Nutritional, Genitourinary, Respiratory, Blood/Immune], [0.5, 0.5, 0, 0.75, 0, 0, 0, 0.75, 0.5]):
  d_1 += chapter_presence*weight
- f_2 is computed by:
d_2 = 0
if (non-invasive oxygen) and (invasive oxygen):
  d_2 = 1.25
elif (invasive oxygen):
  d_2 = 1
elif (non-invasive oxygen):
  d_2 = 0.75
if (ECMO):
  d_2 += 0.5
- f_3 is computed by:
d_3 = 0
if (death):
  # this includes death and (death and icu)
  d_3 = 1.5
elif (icu):
  d_3 = 1
- f_4 is computed by:
d_4 = 0
if (los >= 14) and (los < 28):
  d_4 = 0.5
elif (los >= 28):
  d_4 = 0.75
The Prognosis Space approach, including the dimension reduction functions are implemented in 2c Prognosis Space DbScan.
Table 1. Random Forest classifcation configurations: hyperparameters and sampling coefficients. The down/upsampling coefficients are relative to the number of individuals in the most numerous class.
| Clustering | Hyperparameters | Downsampling co-efficient | Upsampling co-efficient |
|---|---|---|---|
| Baseline KModes Binary | criterion='entropy', max_depth=10, min_samples_split=5, n_estimators=15 | 0.6 | 0.8 |
| Baseline KModes Multiclass | n estimators=60, max depth=10, max features=‘sqrt’, min samples split=10, criterion=‘ gini’ | 1 | 0.8 |
| Layered Axes KModes Layer 1 | n estimators=30, max depth=10, max features=‘log2’, min samples split=2, criterion=‘ entropy’ | 1 | 0.8 |
| Layered Axes KModes Layer 2, Cluster 0 | n estimators=20, max depth=None, max features=‘sqrt’, min samples split=10, criterion=‘ gini’ | 1 | 0.8 |
| Layered Axes KModes Layer 2, Cluster 1 | n estimators=20, max depth=5, max features=‘sqrt’, min samples split=10, criterion=‘gini’ | 1 | 0.8 |
| Layered Axes Kmodes Layer 2, Cluster 2 | n estimators=15, max depth=None, max features=‘log2’, min samples split=2, criterion=‘ gini’ | 1 | 0.8 |
| Layered Axes KModes Layer 2, Severe Patients | criterion='entropy', max_depth=10, min_samples_split=5, max_features='sqrt', n_estimators=5 | 1 | 0.8 |
| Prognosis Space DBScan | n estimators=60, max depth=15, max features=‘log2’, min samples split=2, criterion=‘ entropy’ | 1 | 0.8 |
| Prognosis Space DBScan, Severe Patients | max_depth=15, min_samples_split=10, n_estimators=20, criterion='gini', max features = 'auto' | 1 | 0.8 |
| Prognosis Space DBScan, Cluster 5 (Respiratory, ICU) vs All Other Patients | criterion='entropy', max_depth=10, max_features='sqrt',min_samples_split=5, n_estimators=5 | 0.6 | 0.8 |
| Prognosis Space DBScan, Cluster 7 (Respiratory, Death) vs All Other Patients | criterion='entropy', max_depth=5, max_features='sqrt', n_estimators=20 | 0.6 | 0.8 |
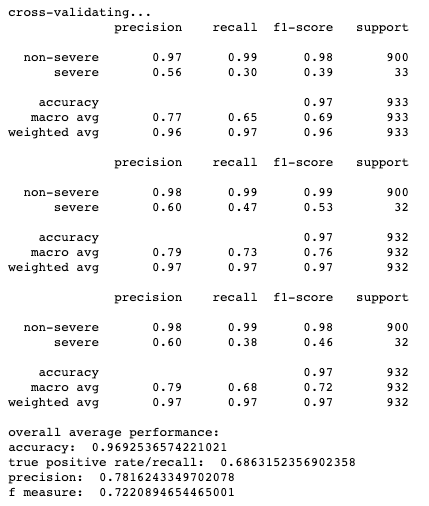
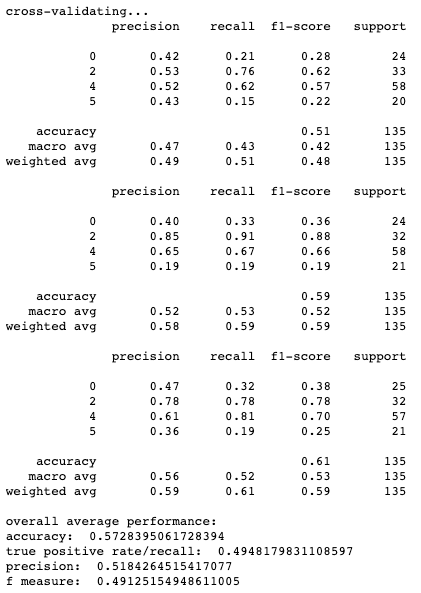
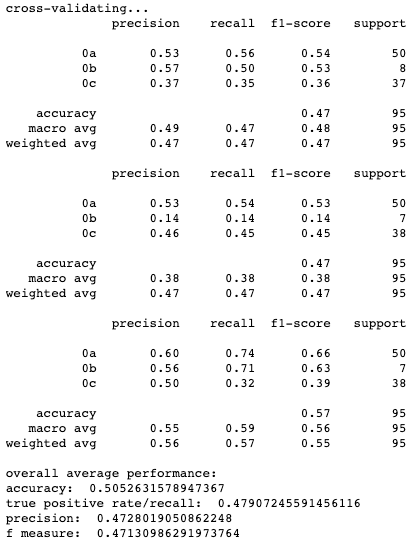
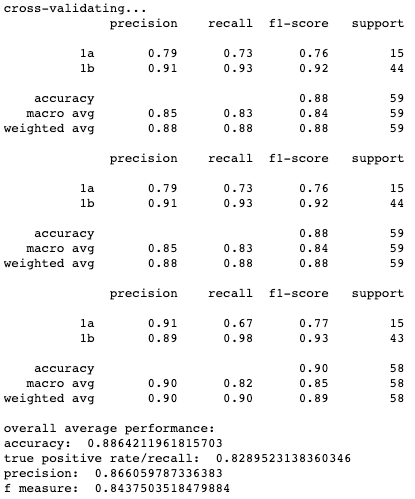
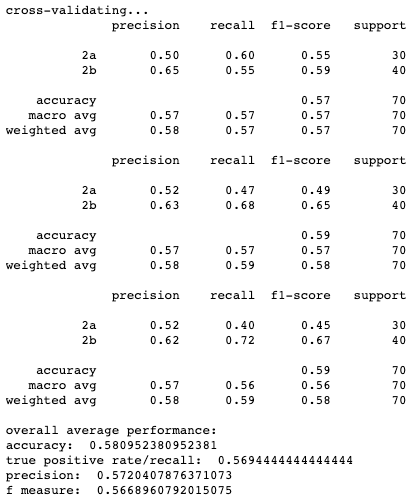
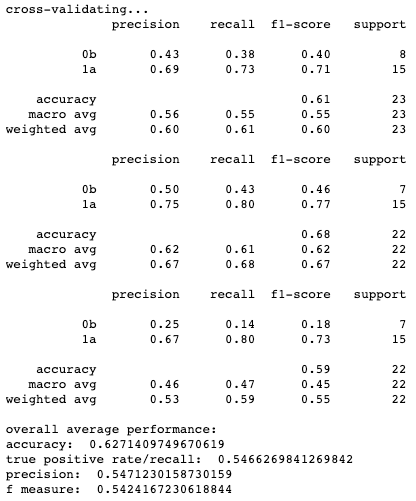
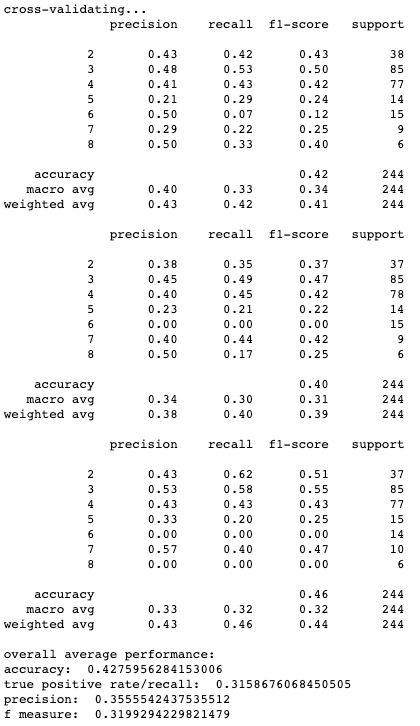
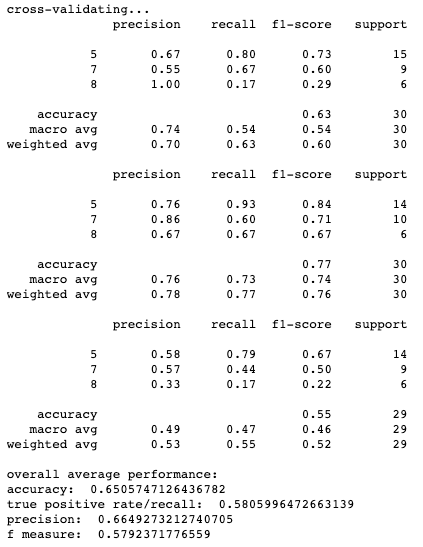
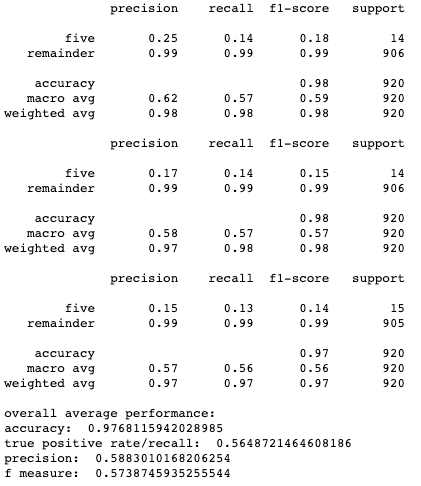
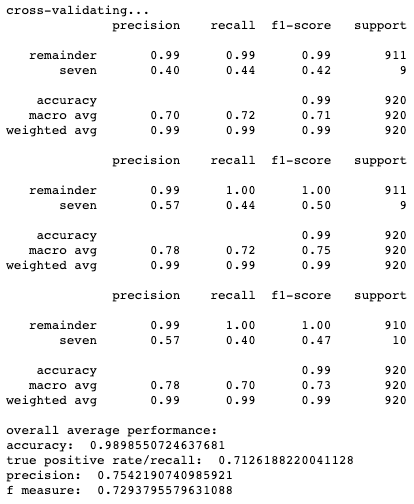
Results for cross-validation and overall classification performance using random forests for each clustering technique.
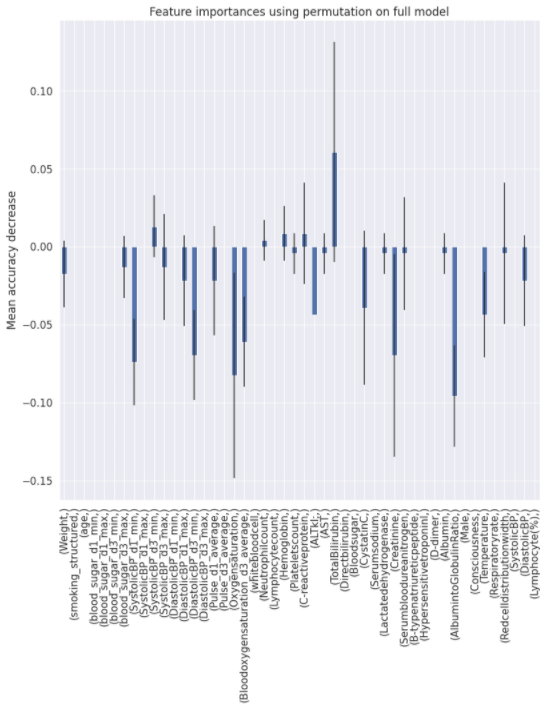
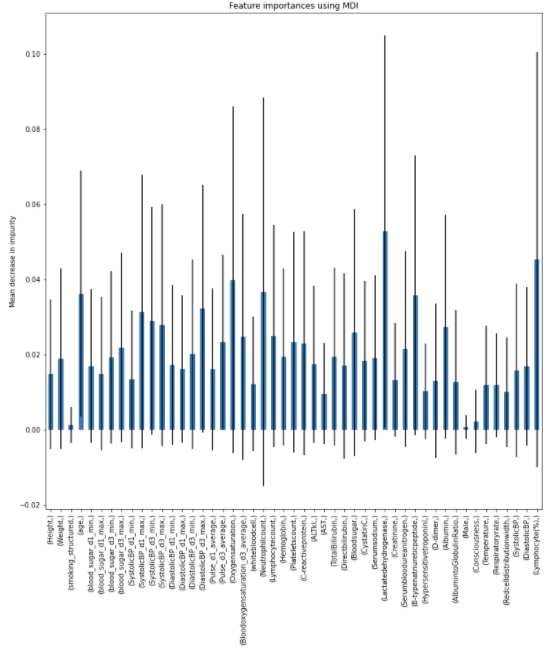
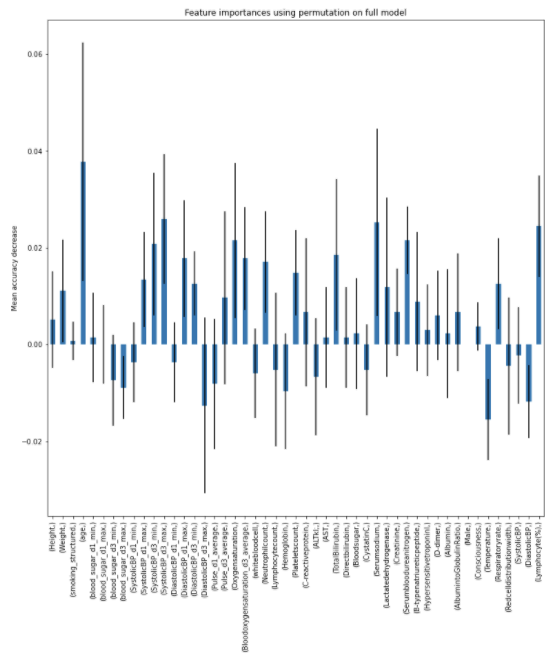
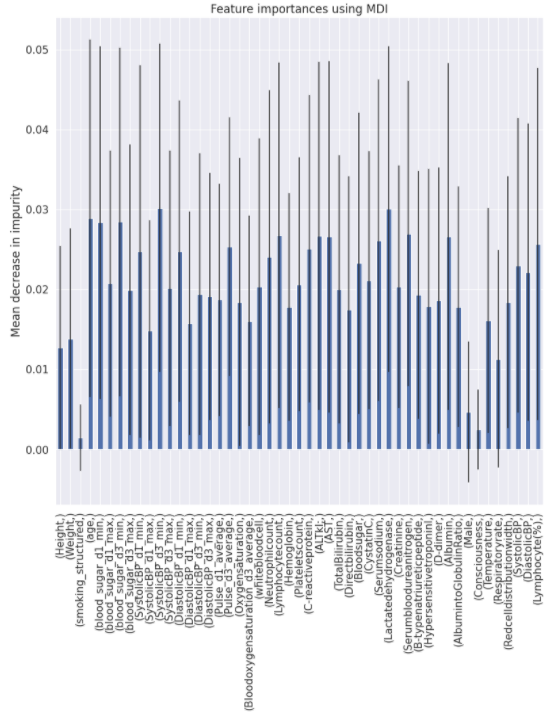
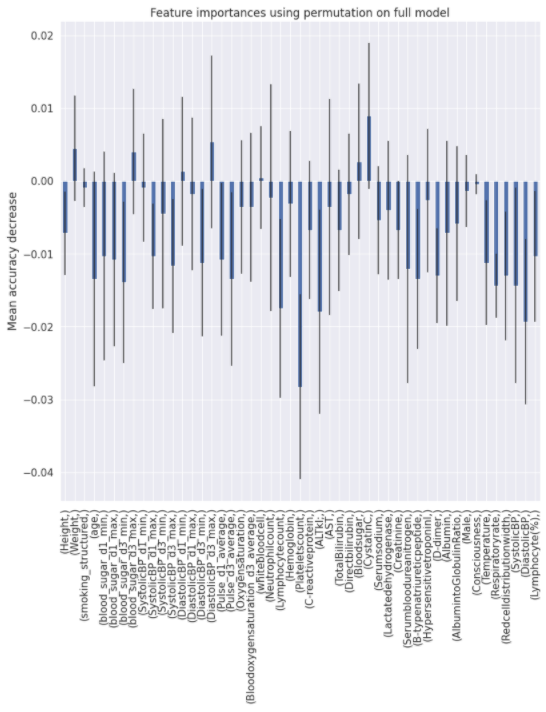
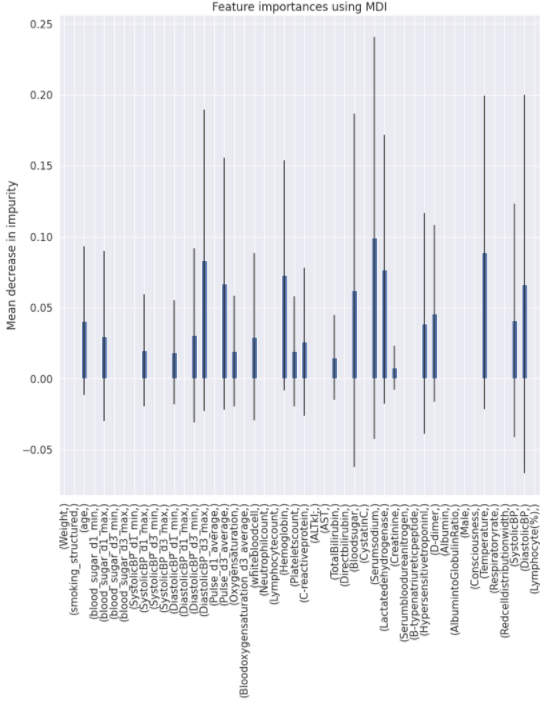
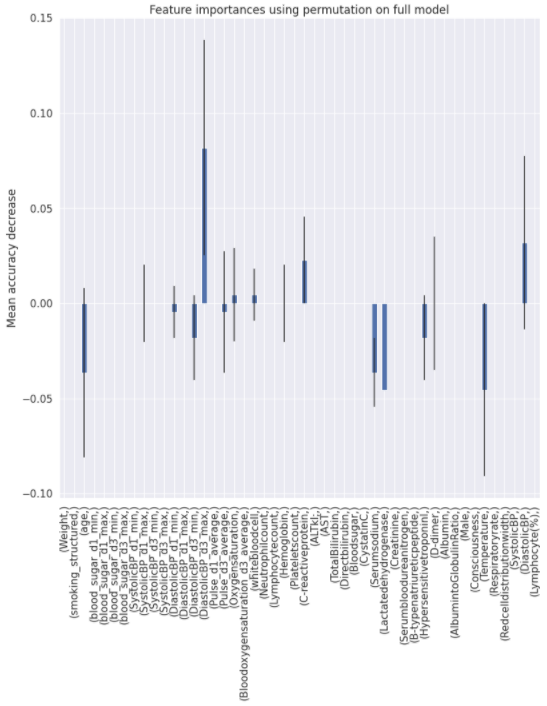
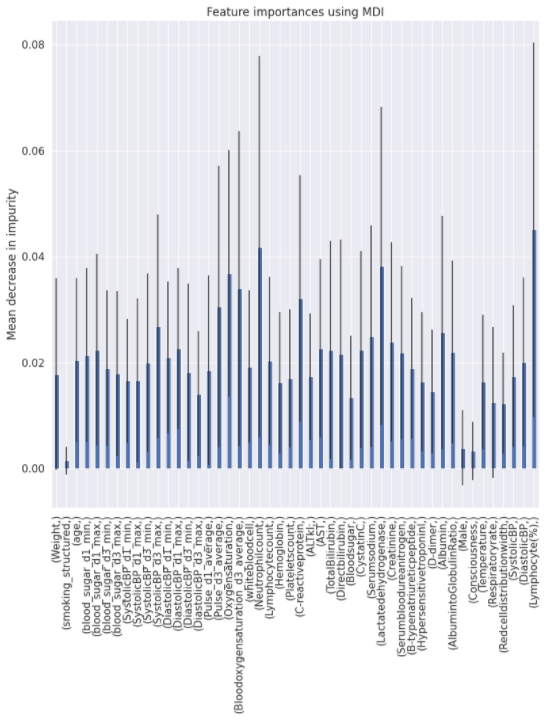
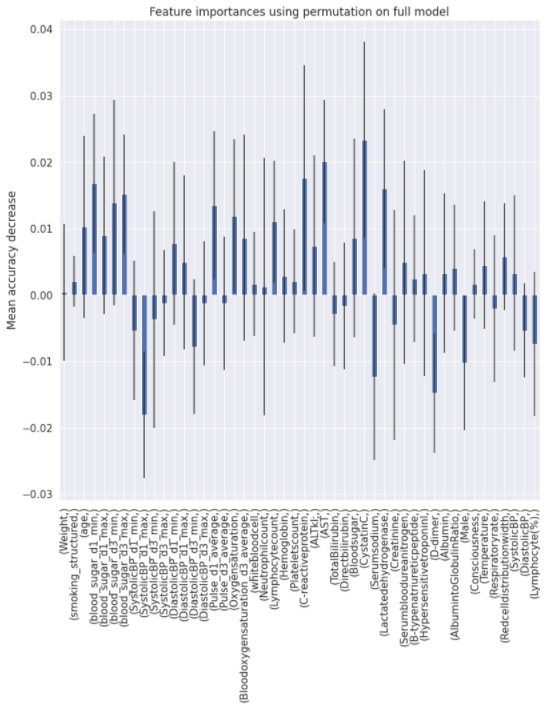
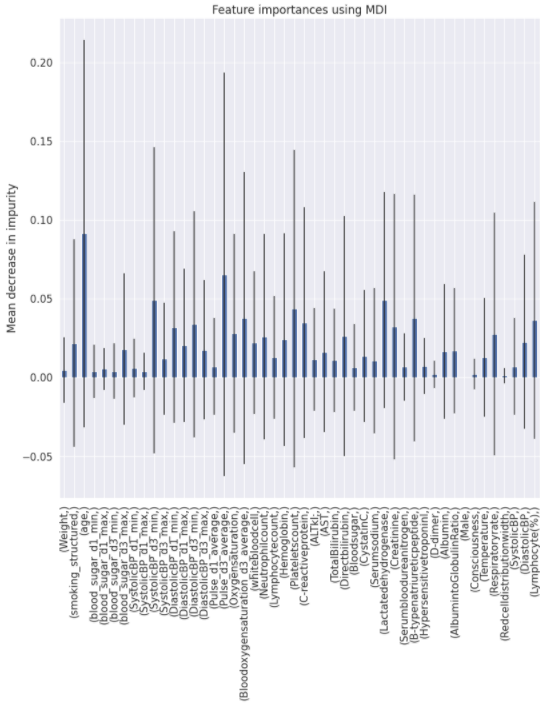
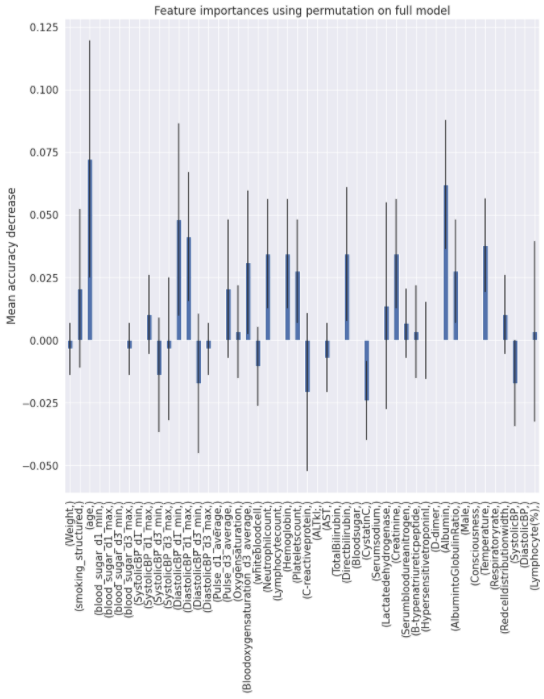
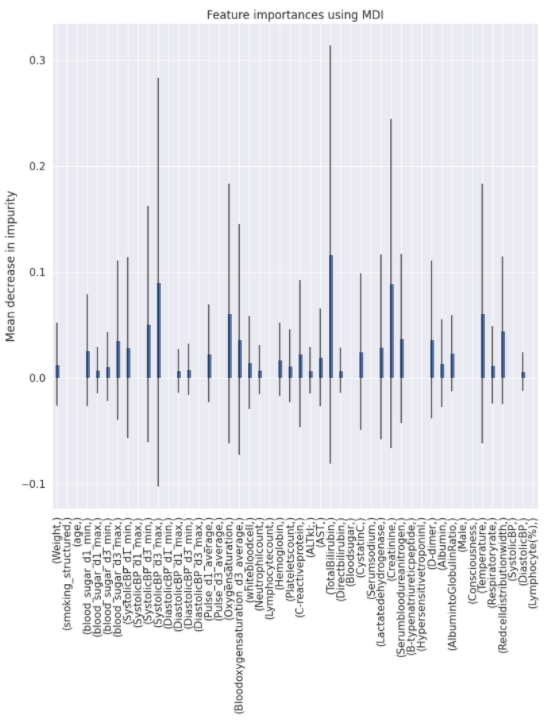
Charts for the feature importances for each random forest classifier, for each classification problem. We used the same features for every classifier, although as shown in the graphs, this is potentially not the optimal approach and better results may be achieved by discounting some features for some classifiers. Feature importances are calculated with both mean decrease in impurity and feature permutation techniques, calculated using sklearn libraries.
Mean decrease in impurity
Feature permutation
Mean decrease in impurity
Feature permutation
Mean decrease in impurity
Feature permutation
Mean decrease in impurity
Feature permutation
Mean decrease in impurity
Feature permutation
Mean decrease in impurity
Feature permutation