Octave‑based signal propagation simulator and visualizer for urban environments, developed as an open‑source teaching aid for the Department of Computer Science & Engineering at the University of Ioannina (course ΜΥΕ048).
- Overview
- Features
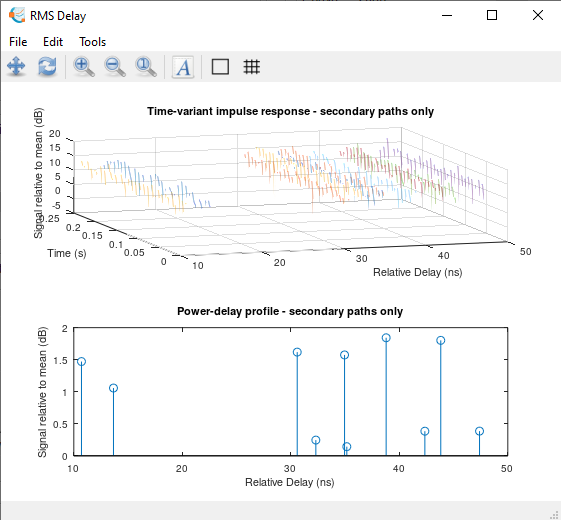
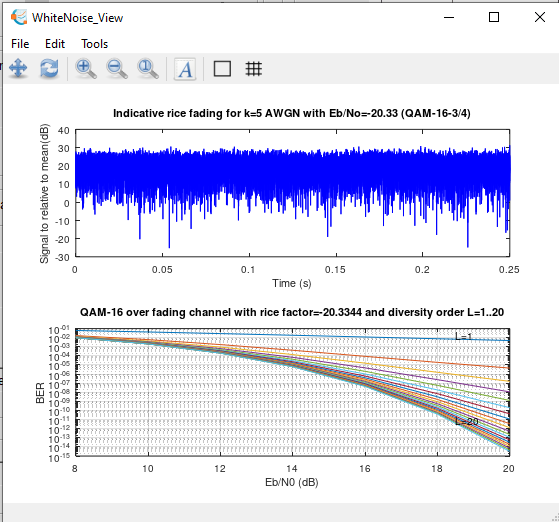
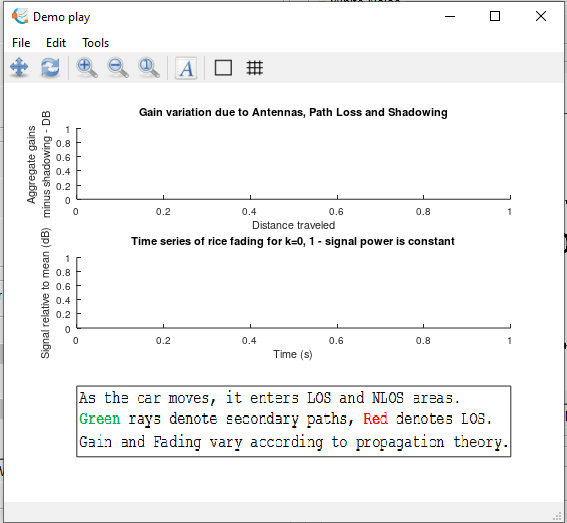
- Screenshots
- Technologies
- Installation
- Usage
- Implementation
- Documentation & Report
- Contributing
- License & Contact
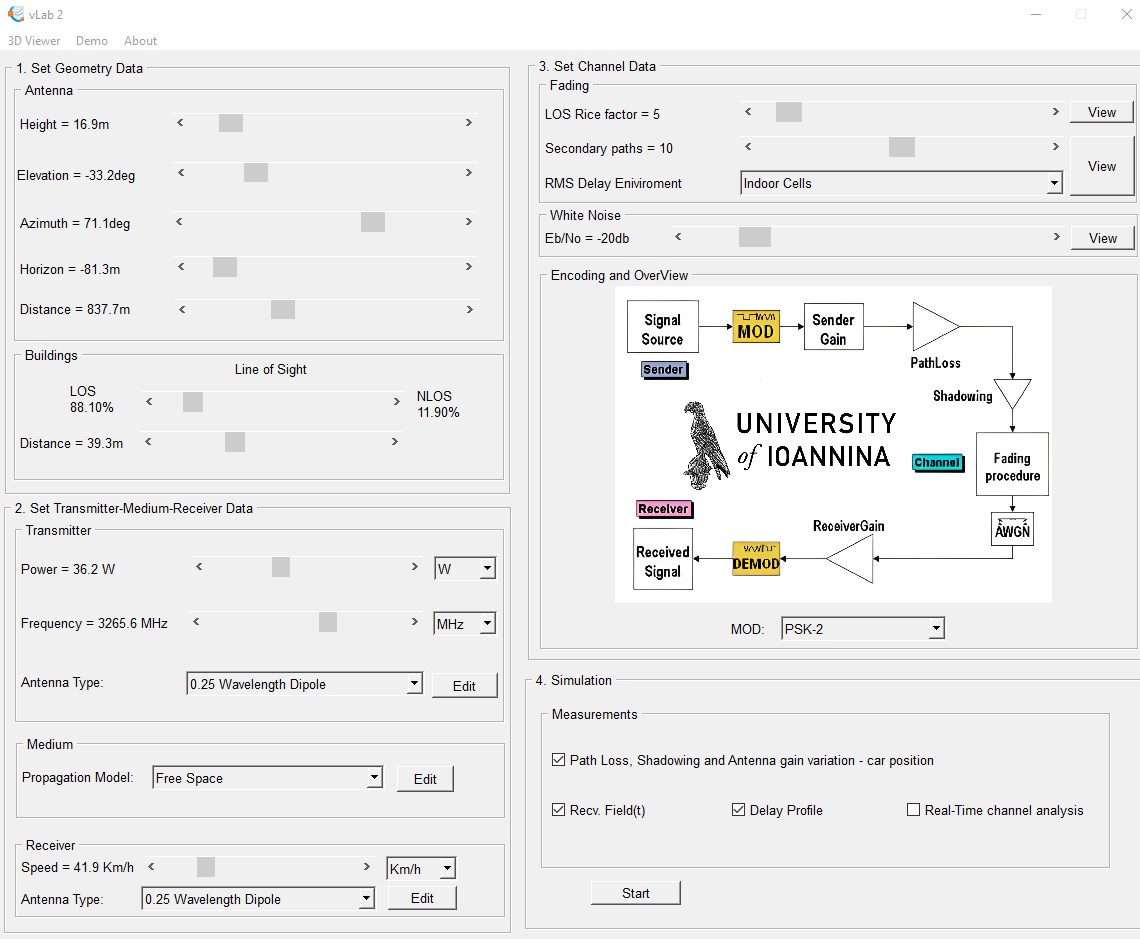
This project converts and optimizes MATLAB laboratory code into GNU Octave scripts, creating a free‑and‑open‑source tool for simulating and visualizing wireless signal propagation in city‑like obstacle environments. It empowers future students to experiment with link performance, obstacle effects, and parameter tuning without MATLAB licenses.
- MATLAB → Octave porting: All lab exercises originally in MATLAB are reworked in Octave to ensure open‑source accessibility.
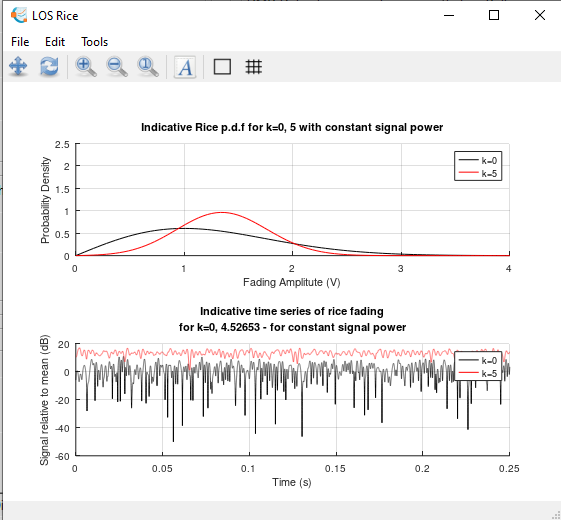
- Signal propagation simulation: Model line‑of‑sight, multipath, and obstacle attenuation in urban scenarios.
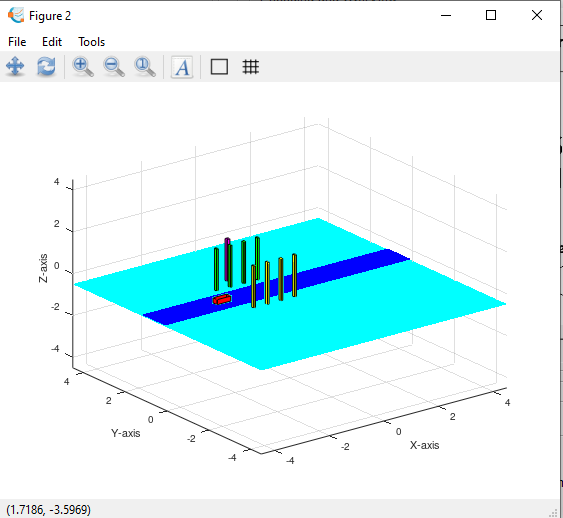
- Interactive visualization: Generate 2D plots of signal strength over a grid of receiver locations, highlighting dead zones and coverage areas.
- Parameter configuration: Easily adjust transmitter power, frequency, obstacle material properties, and grid resolution via script variables.
- Extensible framework: Modular code structure allows the department or students to add new propagation models or GUI front‑ends.
| Component | Technology |
|---|---|
| Language | GNU Octave 10.x (free MATLAB alternative) |
| Plotting | Octave built‑in plotting (gnuplot backend) |
| Scripting | Octave .m scripts, modular functions |
| Documentation | ODT & PDF report via LibreOffice/OpenOffice |
- Install GNU Octave (latest stable release 10.1.0) from the official site or your OS package manager.
- Clone the repo:
git clone https://github.com/johnprif/Wireless-Links.git cd Wireless-Links - Ensure dependencies: No extra toolboxes needed—pure Octave core functions.
From within the project folder, launch Octave and run the main script:
octave:1> run('new_Lab_2_Ooctave/main_simulation.m');-
Modify parameters (transmitter power, frequency, obstacle map) at the top of
main_simulation.m. -
View generated plots in the Octave GUI or export via
print -dpng. -
Compare results against MATLAB originals in
old_Lab_2_MATLAB/.
+----------------------+      +----------------------+      +----------------------+
| main_simulation.m    | -->  | propagation_models.m | -->  | visualization_utils.m|
+----------------------+      +----------------------+      +----------------------+
         |                            |                                |
         v                            v                                v
  parameter_config.m        path_loss_models.m                  plot_heatmap.m
- Modular design: Separate scripts for configuration, propagation math, and plotting, enabling easy extension.
- Conversion approach: Converted MATLAB built‑in functions to Octave equivalents, optimized loops for performance.
Detailed methodology, algorithmic choices, and results analysis are provided in:
new_Lab_2_Ocate_report.pdf(full report)new_Lab_2_Ocate_report.odt(editable source)
Refer to these for theoretical background and validation plots.
This tool is open‑source for future students and faculty development. To contribute:
- Fork the repository.
- Create a branch:
git checkout -b feature/your_feature. - Commit changes and push.
- Submit a Pull Request.
Feedback and extensions (new models, GUIs) are encouraged by the department.
MIT License © 2020 University of Ioannina contributors. See LICENSE file for details.
For questions or collaboration, contact:
- Joanis Prifti (author) — giannispriftis37@gmail.com
- Filippo Priftis (co‑author) — filpri6@gmail.com
Developed as an educational resource for Wireless Links (ΜΥΕ048) labs at University of Ioannina.