Basis of record tells us roughly whether an image was collected in situ (human observation like with a phone) or was collected or digitized by a museum (preserved specimen). Plants are often collected by museums as preserved specimens aka "herbarium sheets". For simplicity I have ignored other types of basis of record, since there are very few images with other types of basis of record.
There are many types of licenses. I have mostly broken things down into non-commercial and commercial. Non-commerical meaning any normal private citizen can use the photo not for profit. And commercial meaning a business could use the image to make a profit.
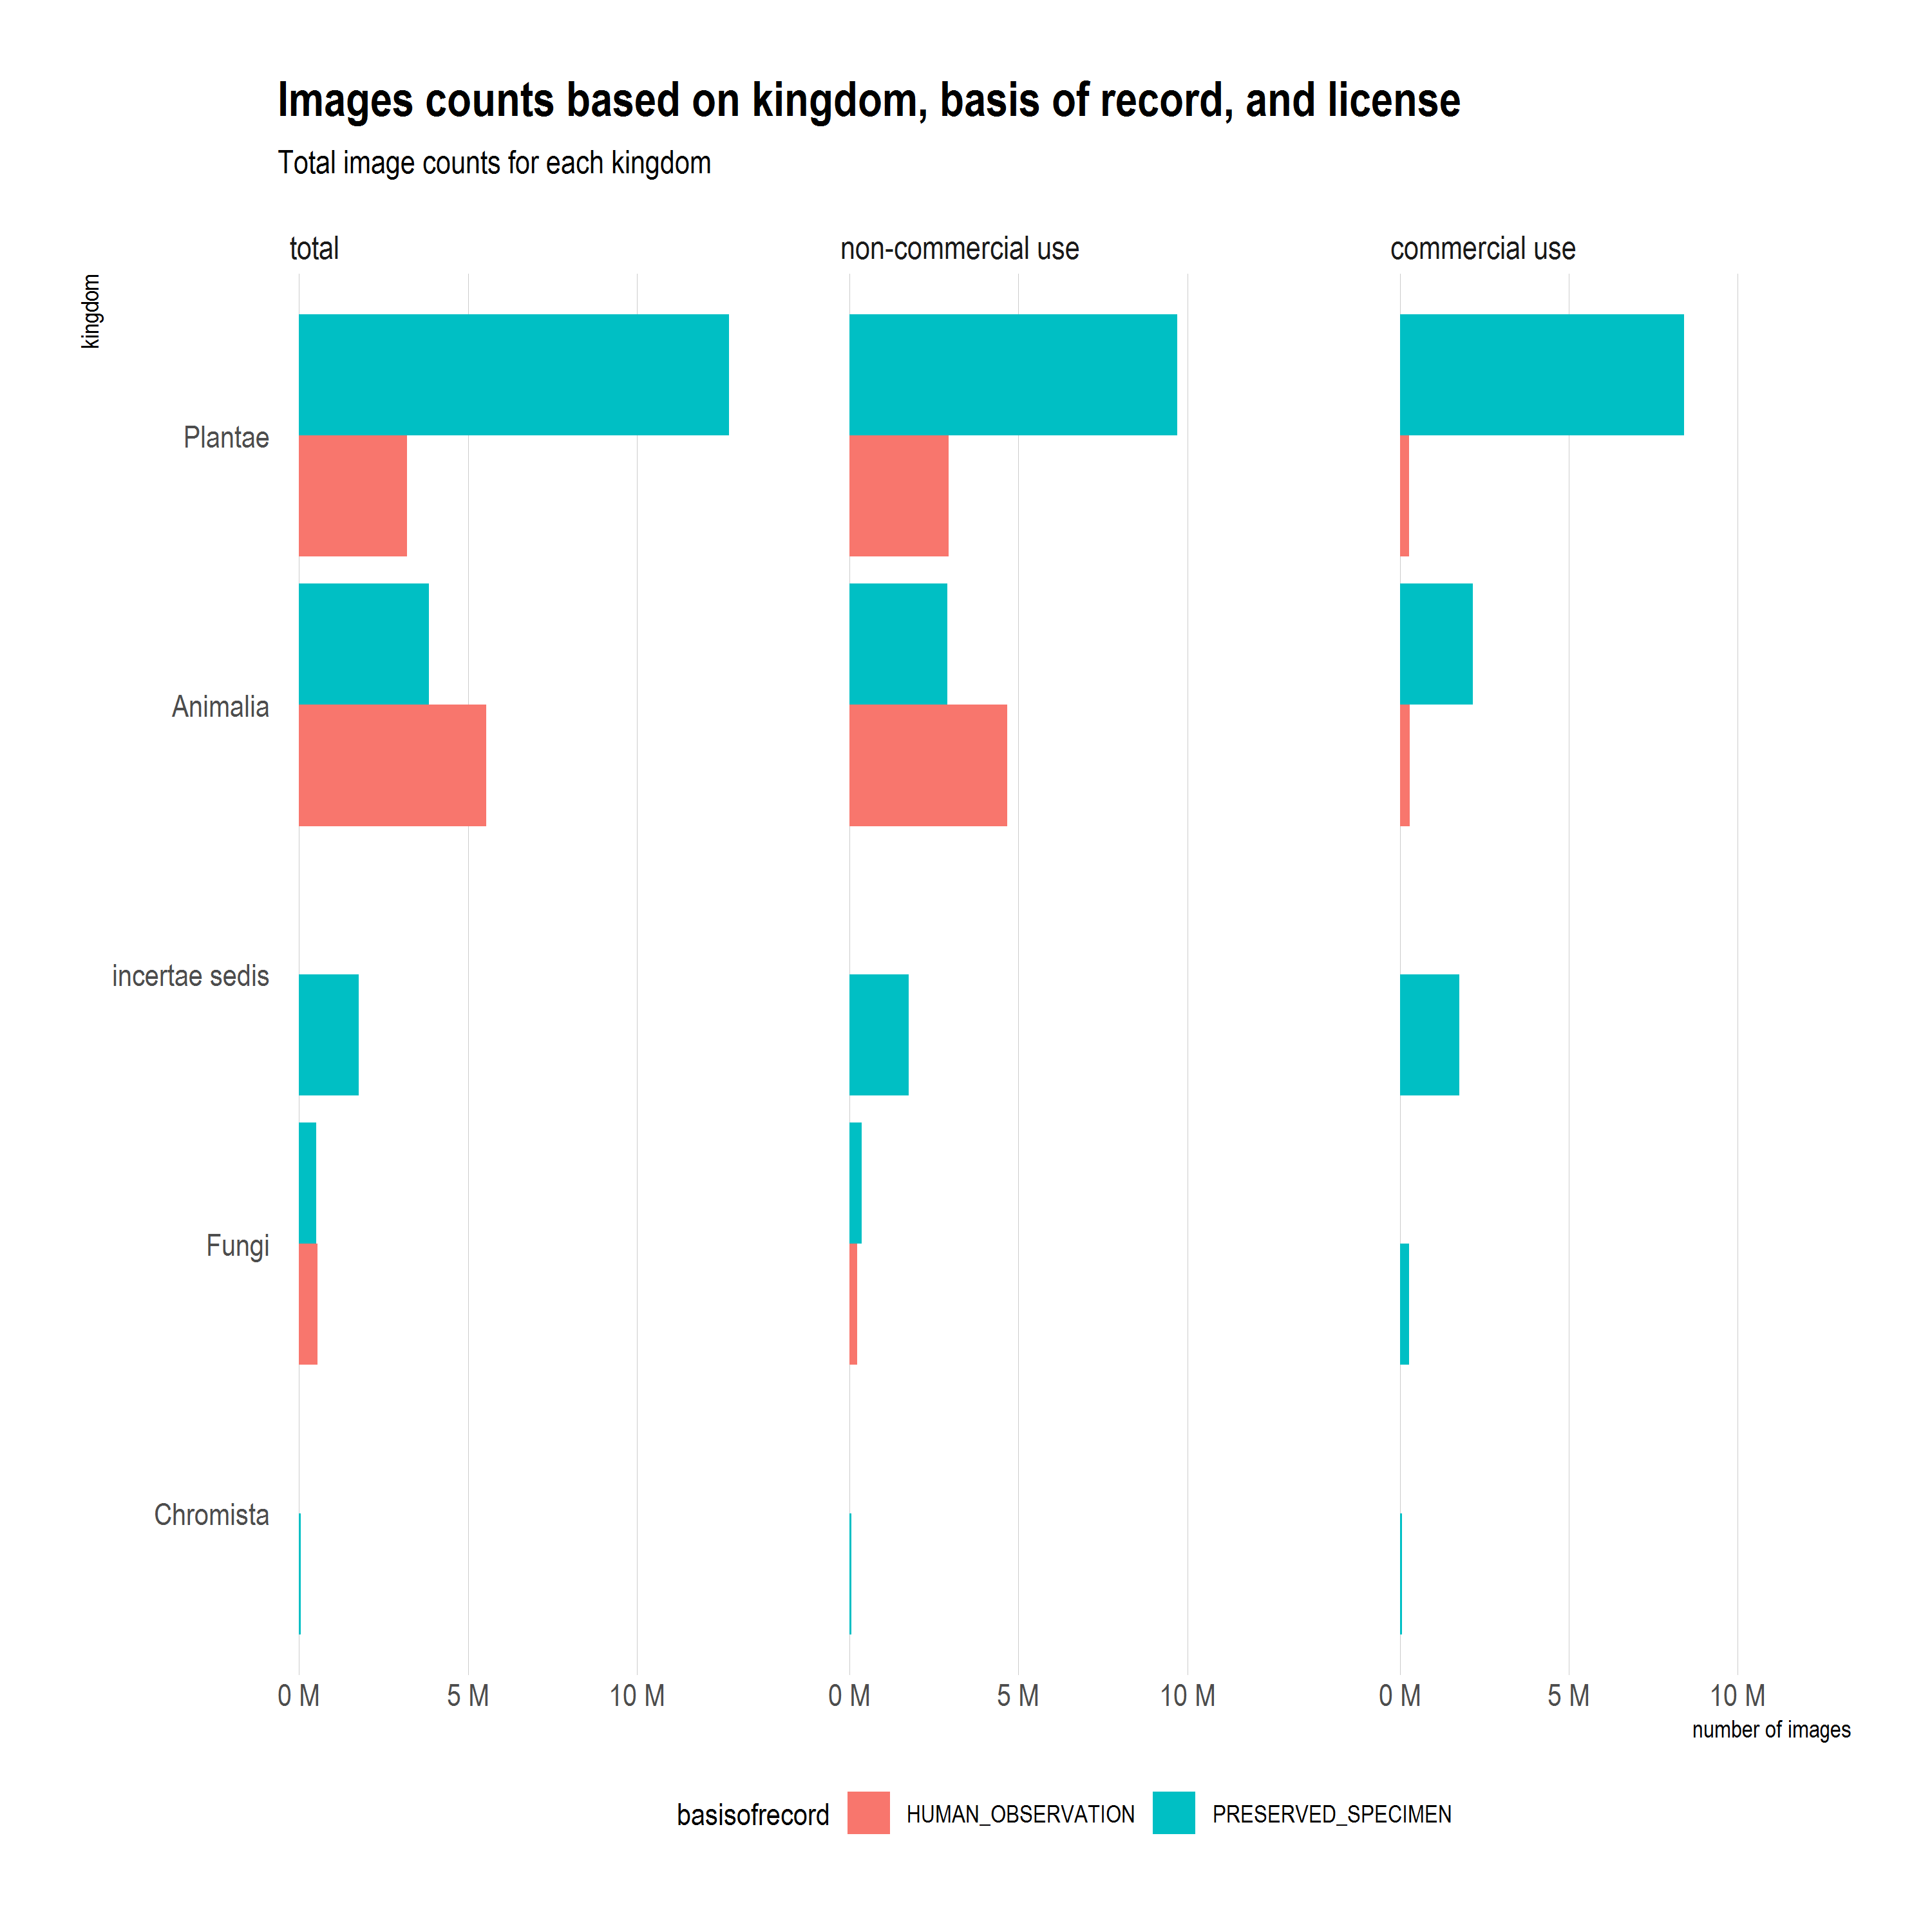
Below I look at raw image counts on GBIF.
Two things to notice here:
- There are a lot of "herbarium sheets" (preserved specimens) for plants.
- There are very few human observations available for commercial use.
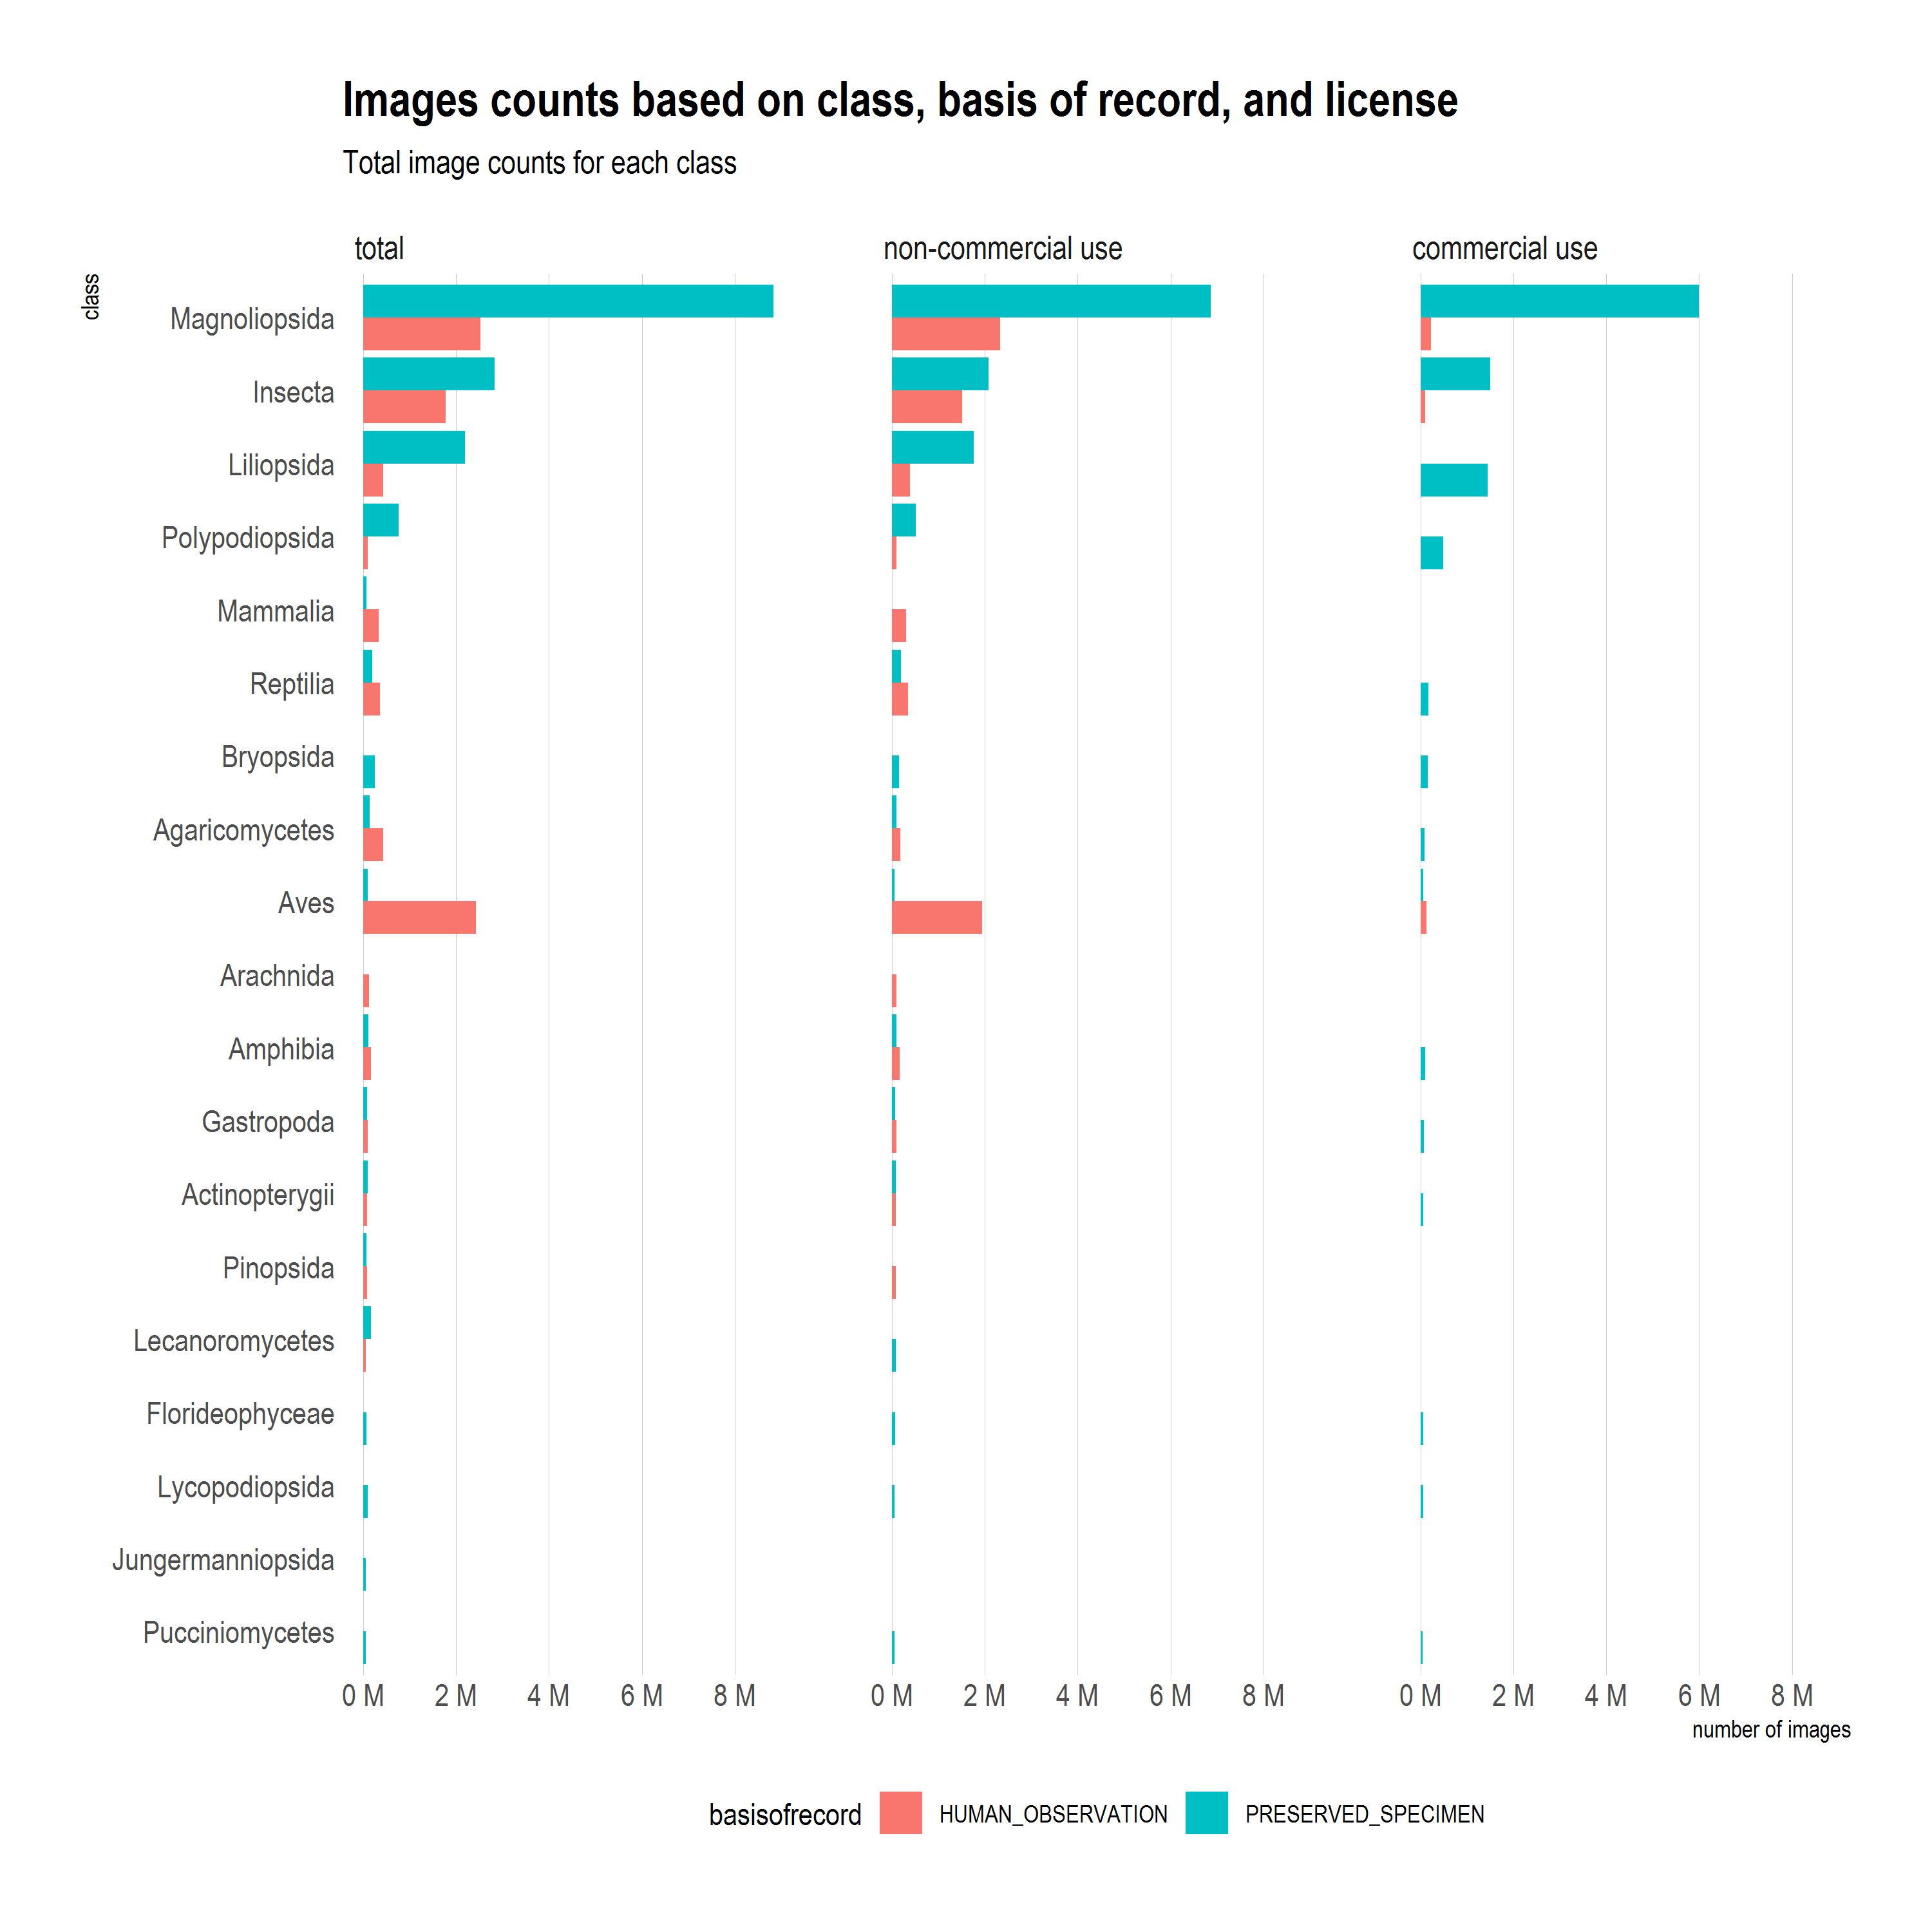
At a lower taxonomic level we see that flowering plants (magnoliopsida, liliopsida) have many many images. Many are probably "herbarium sheets" (preserved specimens), but there are still millions of human observations. Again however commercial use might be difficult for many groups.
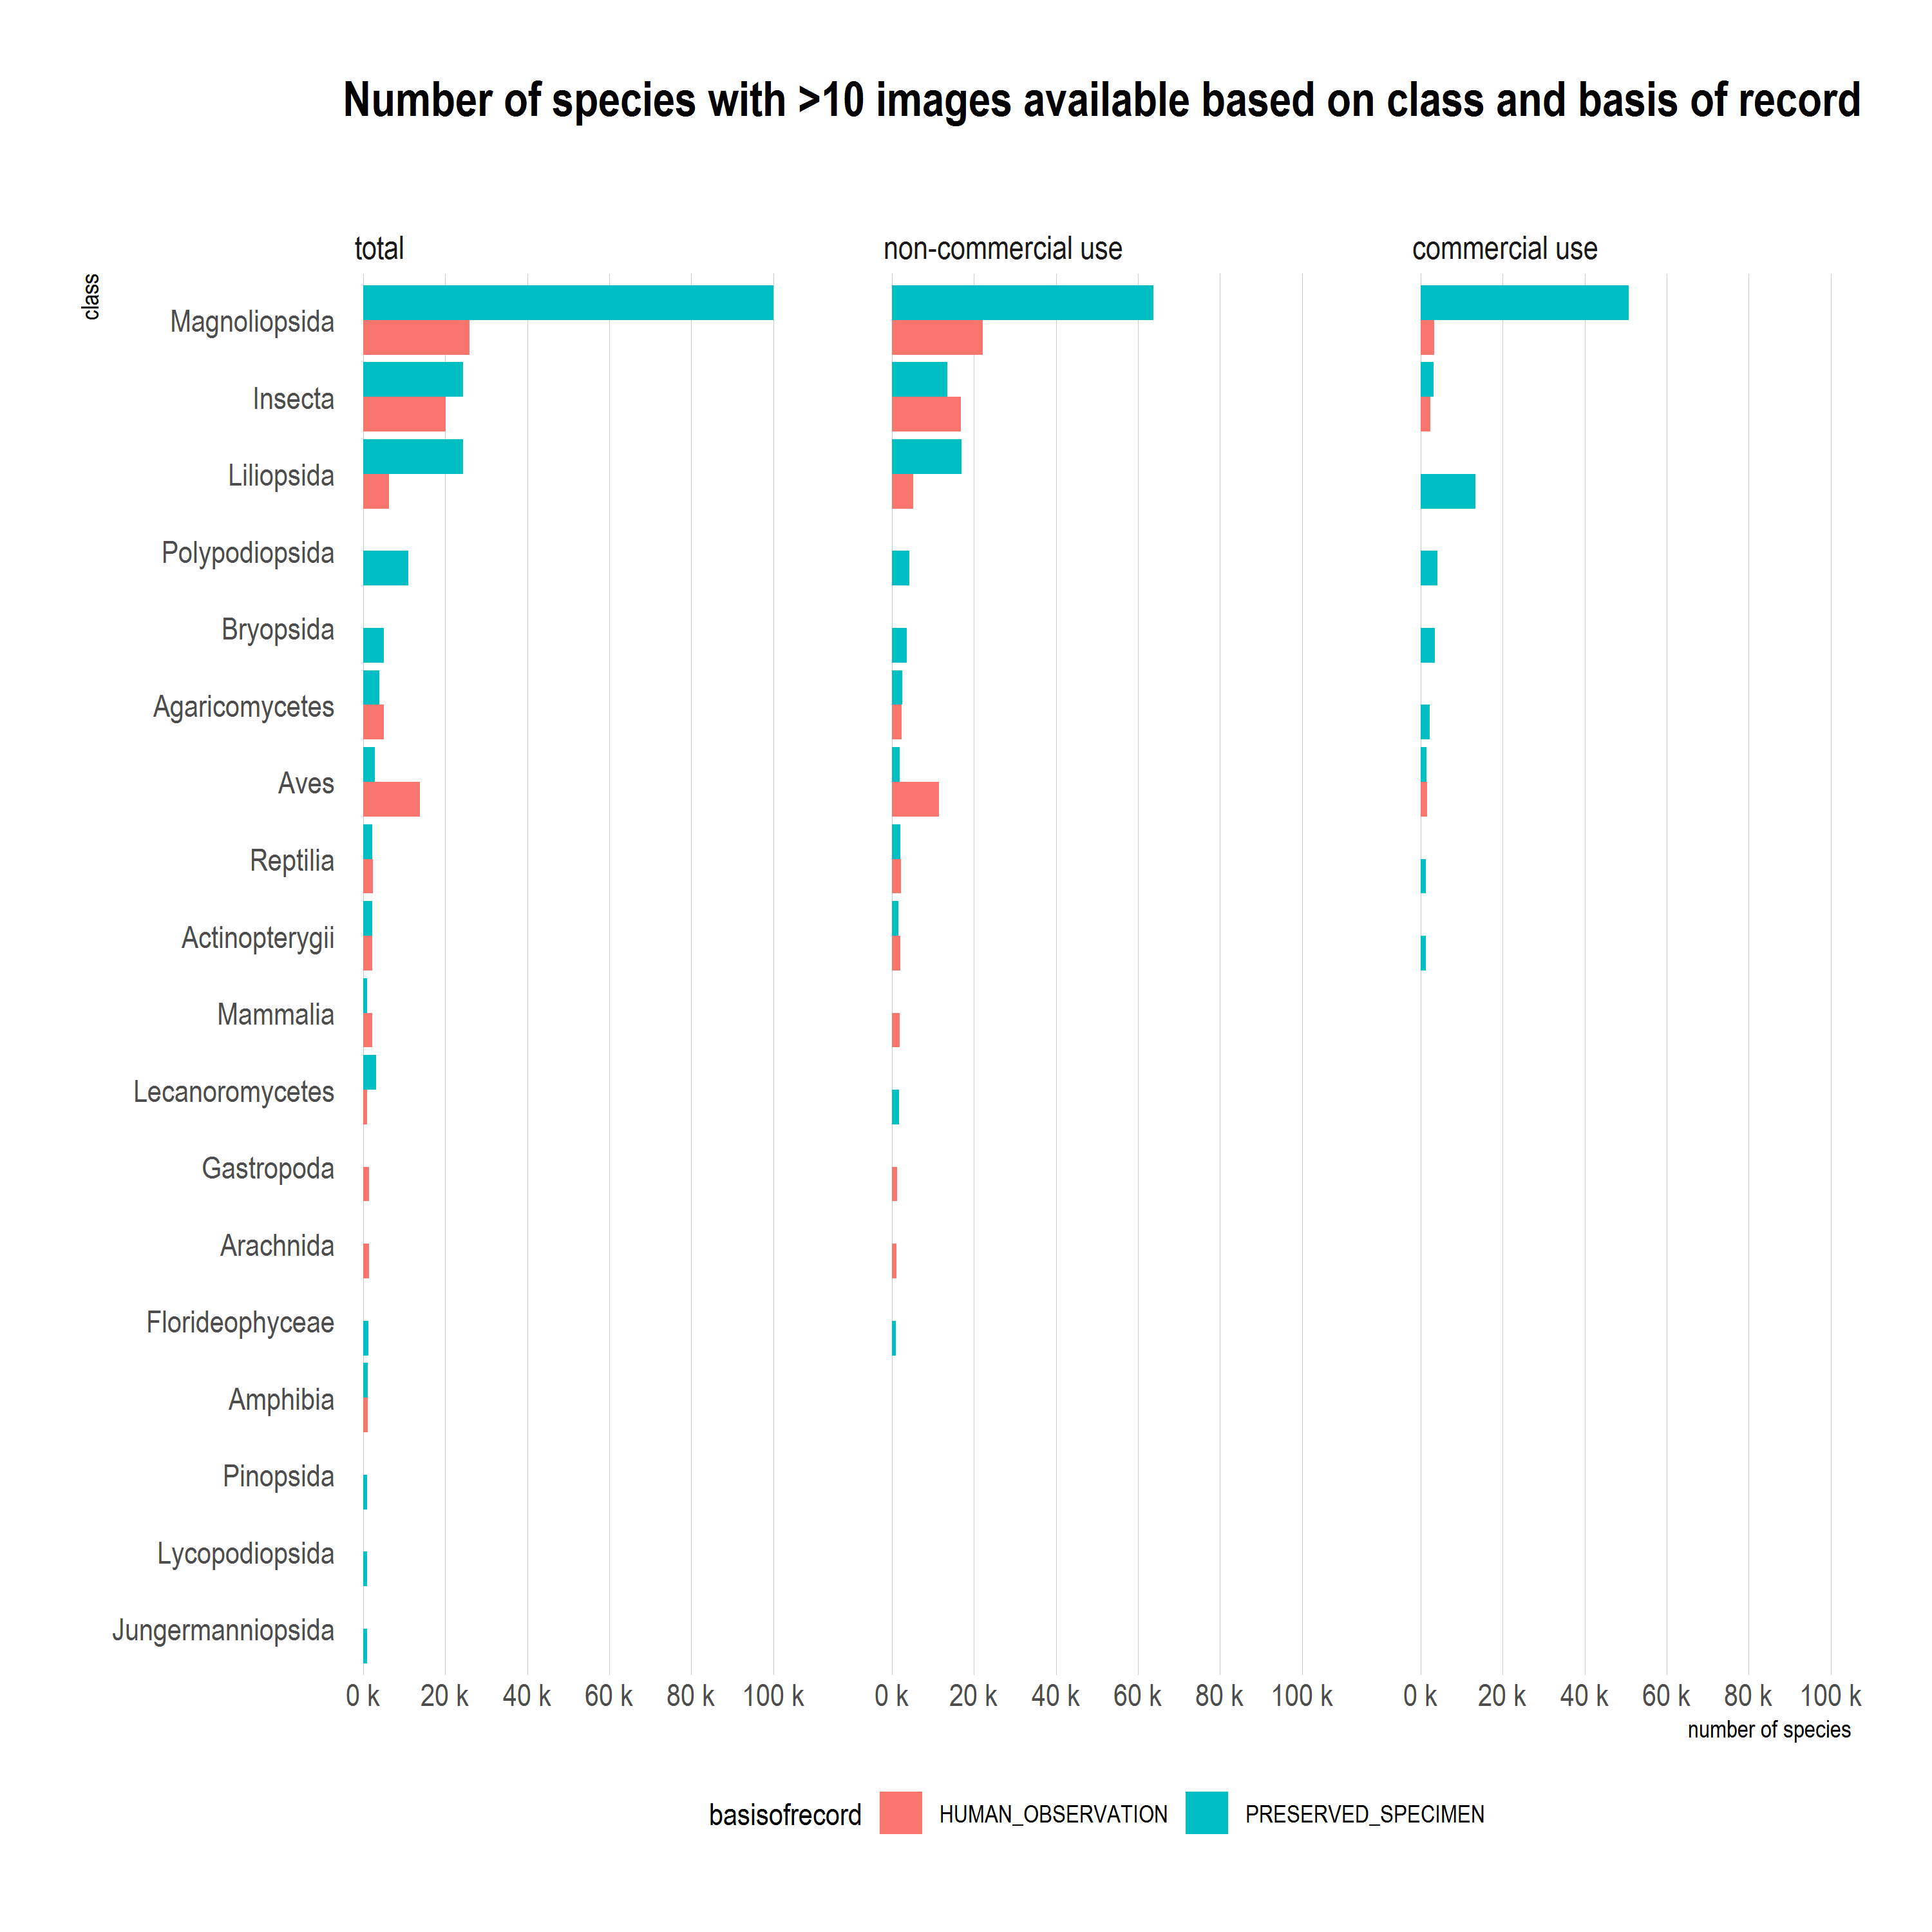
The total number of images is less interesting than the total number of species. Now I want to look at species counts with >10 images rather than total image counts.
In the plot I am only showing classes with more than >1000 species with >10 images.
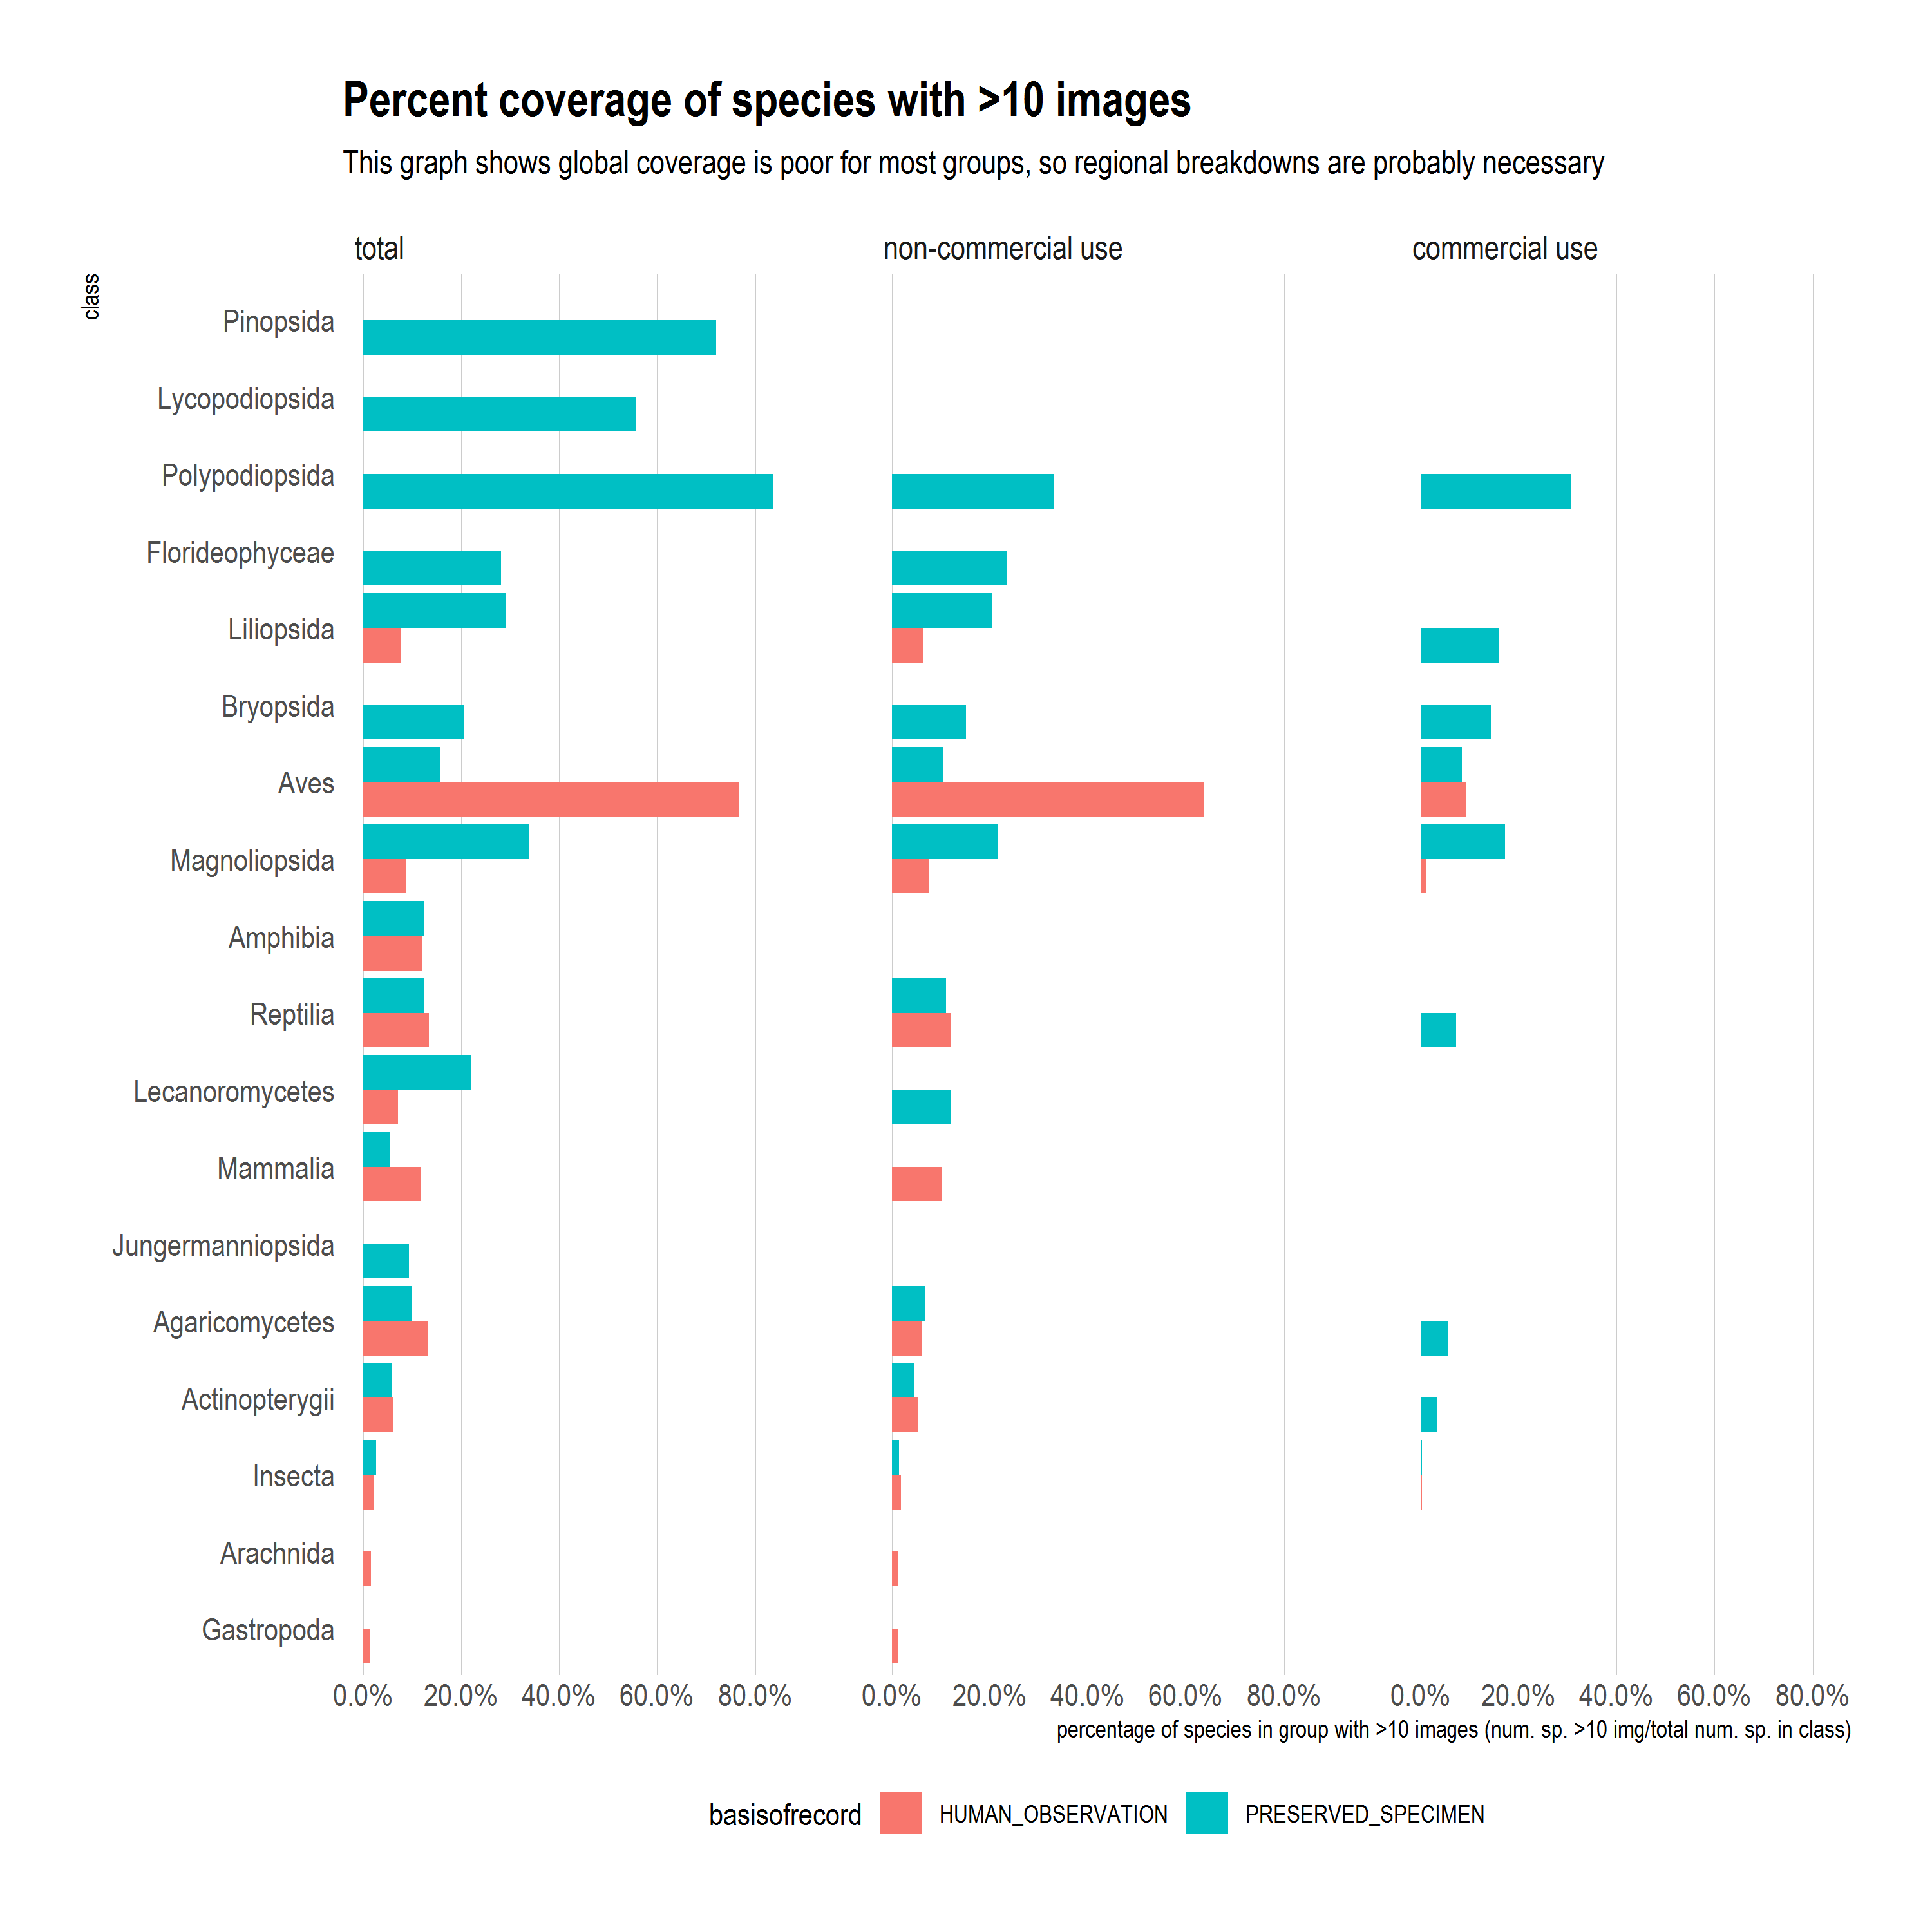
Here I look at what is the percentage coverage in a group.
Percent coverage = num. sp. >10 img/total num. sp. in class
Percent coverage (num. sp. >10 img/total num. sp. in taxonomic class). Here we see that global image coverage is quite poor for most groups with the exception of maybe Aves (birds) and a few plant classes (Pinopsida, Lycopodiopsida, Polypodiopsida), although many of these plant classes are "preserved specimens" aka probably herbarium sheets. Other groups have very poor global image coverage even considering preserved museum specimens.
The global look for images for commercial use is even worse, although there is reasonable non-commercial image coverage.
Species counts were taken from GBIF backbone and probably should be interpreted with caution. A better measure might be the total number of species for which we have at least 1 occurrence. Still this graph shows us that regional breakdowns are probably necessary for an image dataset with good coverage.
Below is a table of potentially good regional image datasets.
An interactive version of this table can be found here. csv here.
I recommend using the interactive version to explore potential datasets.
PercentCoverage = totalSpeciesWith10Images (or more) / totalSpeciesInCountry. I have counted species as being in a country by including it if it at least has one occurrence record in that country. For example, 2773 of 3450 species of birds in the US have >10 images on GBIF, meaning there are 3450 bird species with >1 occurrence record in the US. This differs from the above graph because those totals were taken directly from the backbone.
It might be possible to breakdown these categories even more. For example, certain insect groups like butterflies or dragonflies might have better regional coverage in some areas.