This script offers a method to enhance the visual appearance of plots generated by the PRINCALS function from the Gifi package in R (1), by building upon the source code of the original plotting function. Since PRINCALS produces complex outputs that require further processing for effective visualization, the script leverages the ggplot2 package (2) to improve both the aesthetics and clarity of the resulting plots.
The
The
- x: An object generated by princals(dataset).
- plot.dim: A numeric vector specifying the dimensions to be plotted. Default is c(1, 2).
- var.subset: Specifies a subset of variables to include. Default is "all".
- max.plot.array: Maximum number of plots per array. Default is 2.
- stepvec: A numeric vector indicating whether to include a step function in the plot (see princals documentation for details). Default is NA.
- col.lines: Color of the lines in the plot. Default is "black".
- main: Title of the plot. By default, it uses the name of the princals object.
- show: Logical or numeric (TRUE/FALSE, T/F, 1/0) indicating whether to display the plots. Default is 1 (TRUE).
- save: Logical or numeric (TRUE/FALSE, T/F, 1/0) indicating whether to save the plots. Default is 1 (TRUE).
- name: A label or name for the princals object. Default is the name of the object.
- units: Units for width and height. Default is "mm".
- width]: Width of the output image. Default is 250mm.
- height: Height of the output image. Default is 250mm.
- res: Resolution of the image in pixels. Default is 300.
- dispersion: Controls the spread of scores in the load plot. Default is 3, which corresponds to mean ± 3 * standard deviation.
- point.size.loadplot: Size of the points in the load plot. Default is 1.
- point.alpha.loadplot: Transparency level (alpha) of the points in the load plot. Default is 0.1.
- language: Language for the plot labels. Options are "English" or "Spanish". Default is "English".
- legend.position: Position of the legend. Options are "none", "left", "right", "bottom", and "top". Default is "right".
- legend.group: Logical or numeric (TRUE/FALSE, T/F, 1/0) indicating whether to display grouped legends. Default is 1 (TRUE).
Finally, figures generated by the
#to begin
setwd("~/file")
source(
"https://github.com/jasb3110/g.princals/blob/f286b26f79da57600c3e7f207a6f653f24028a76/g.princals.R"
)
library("Gifi")

# ordinal PCA of Gifi
fitord <- princals(ABC,ndim = 2)

#to use a g.princals

g.princals(fitord,
           save=0,
           show=1,
           dispersion =3,
           legend.group = 0)#show plots

g.princals(fitord,
           save=0,
           show=1,
           dispersion =3,
           colour.group = c(rep("A",5),rep("B",6)),
           legend.group = 1,
           language = "spanish")#show plots

g.princals(fitord,
           save=1,
           show=1,
           dispersion =3,
           legend.group = 0)#save plots in PNG format

g.princals(fitord,
           save=1,
           show=0,
           dispersion =3,
           colour.group = c(rep("A",5),rep("B",6)),
           legend.group = 1,
           language = "spanish")#save plots in PNG format
In this section, an R script and corresponding plots created using the
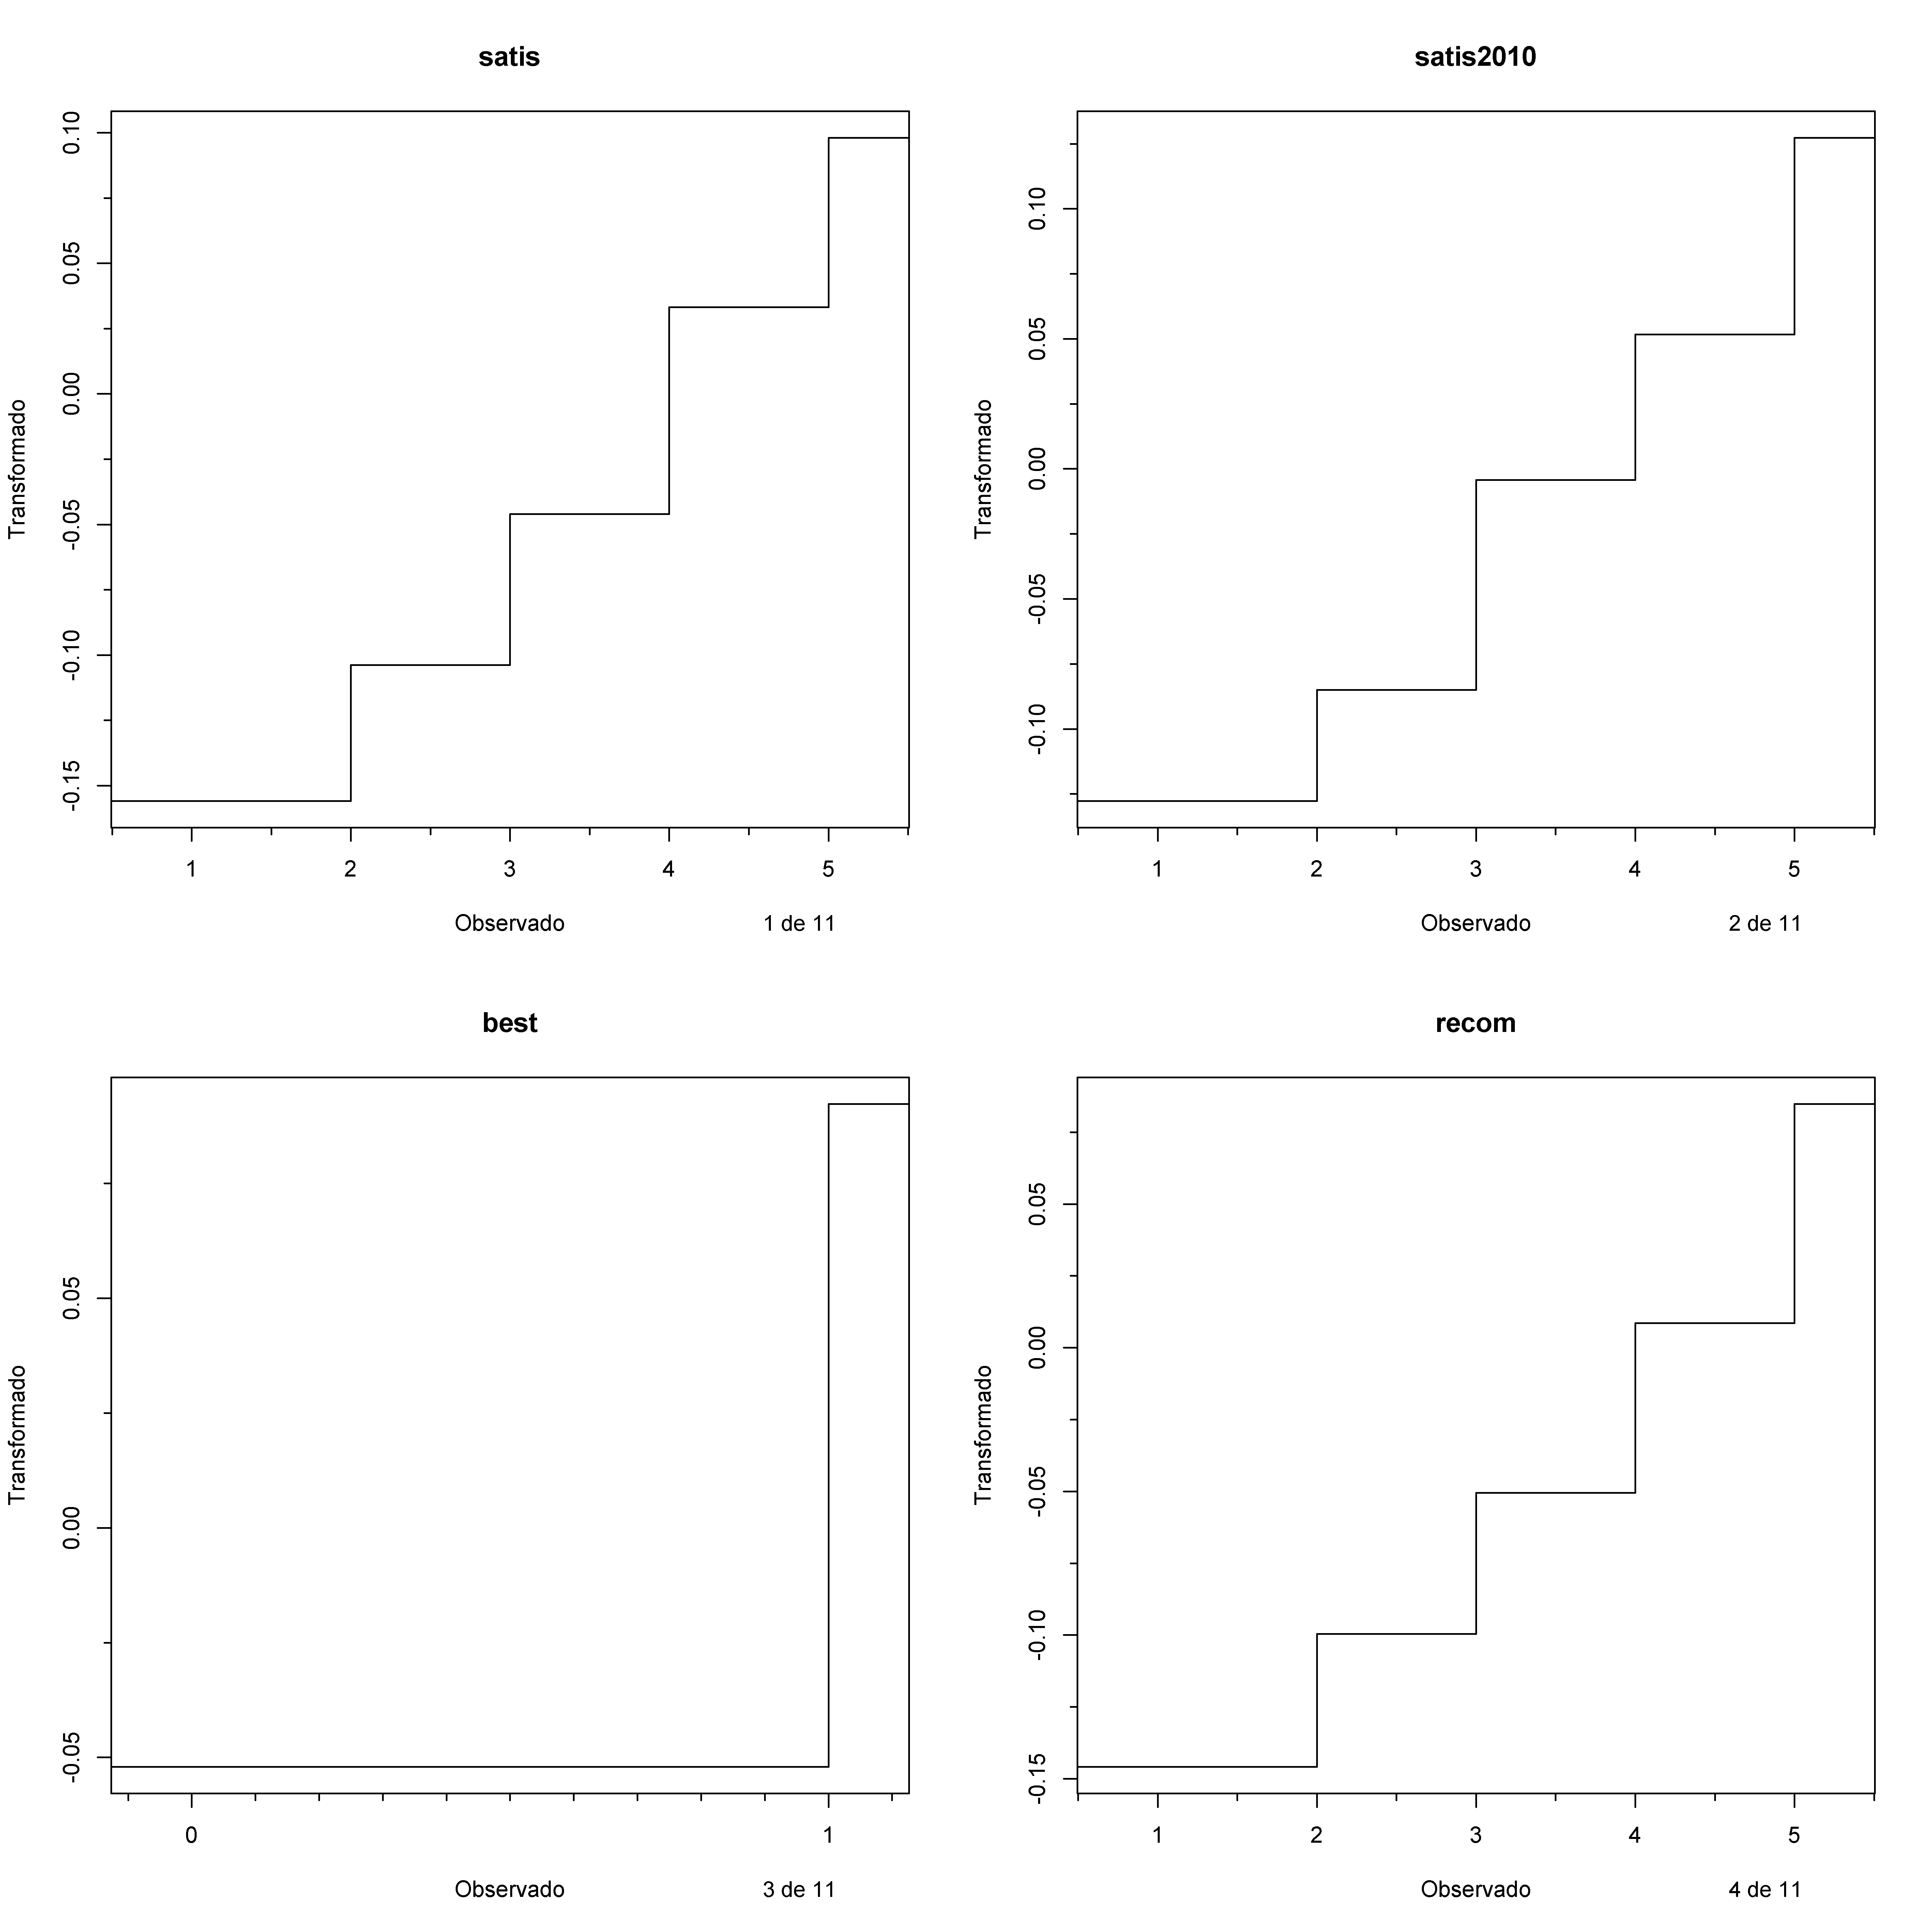 |
|---|
| Picture. Transplots of ABC dataset, just 1 to 4 variables |
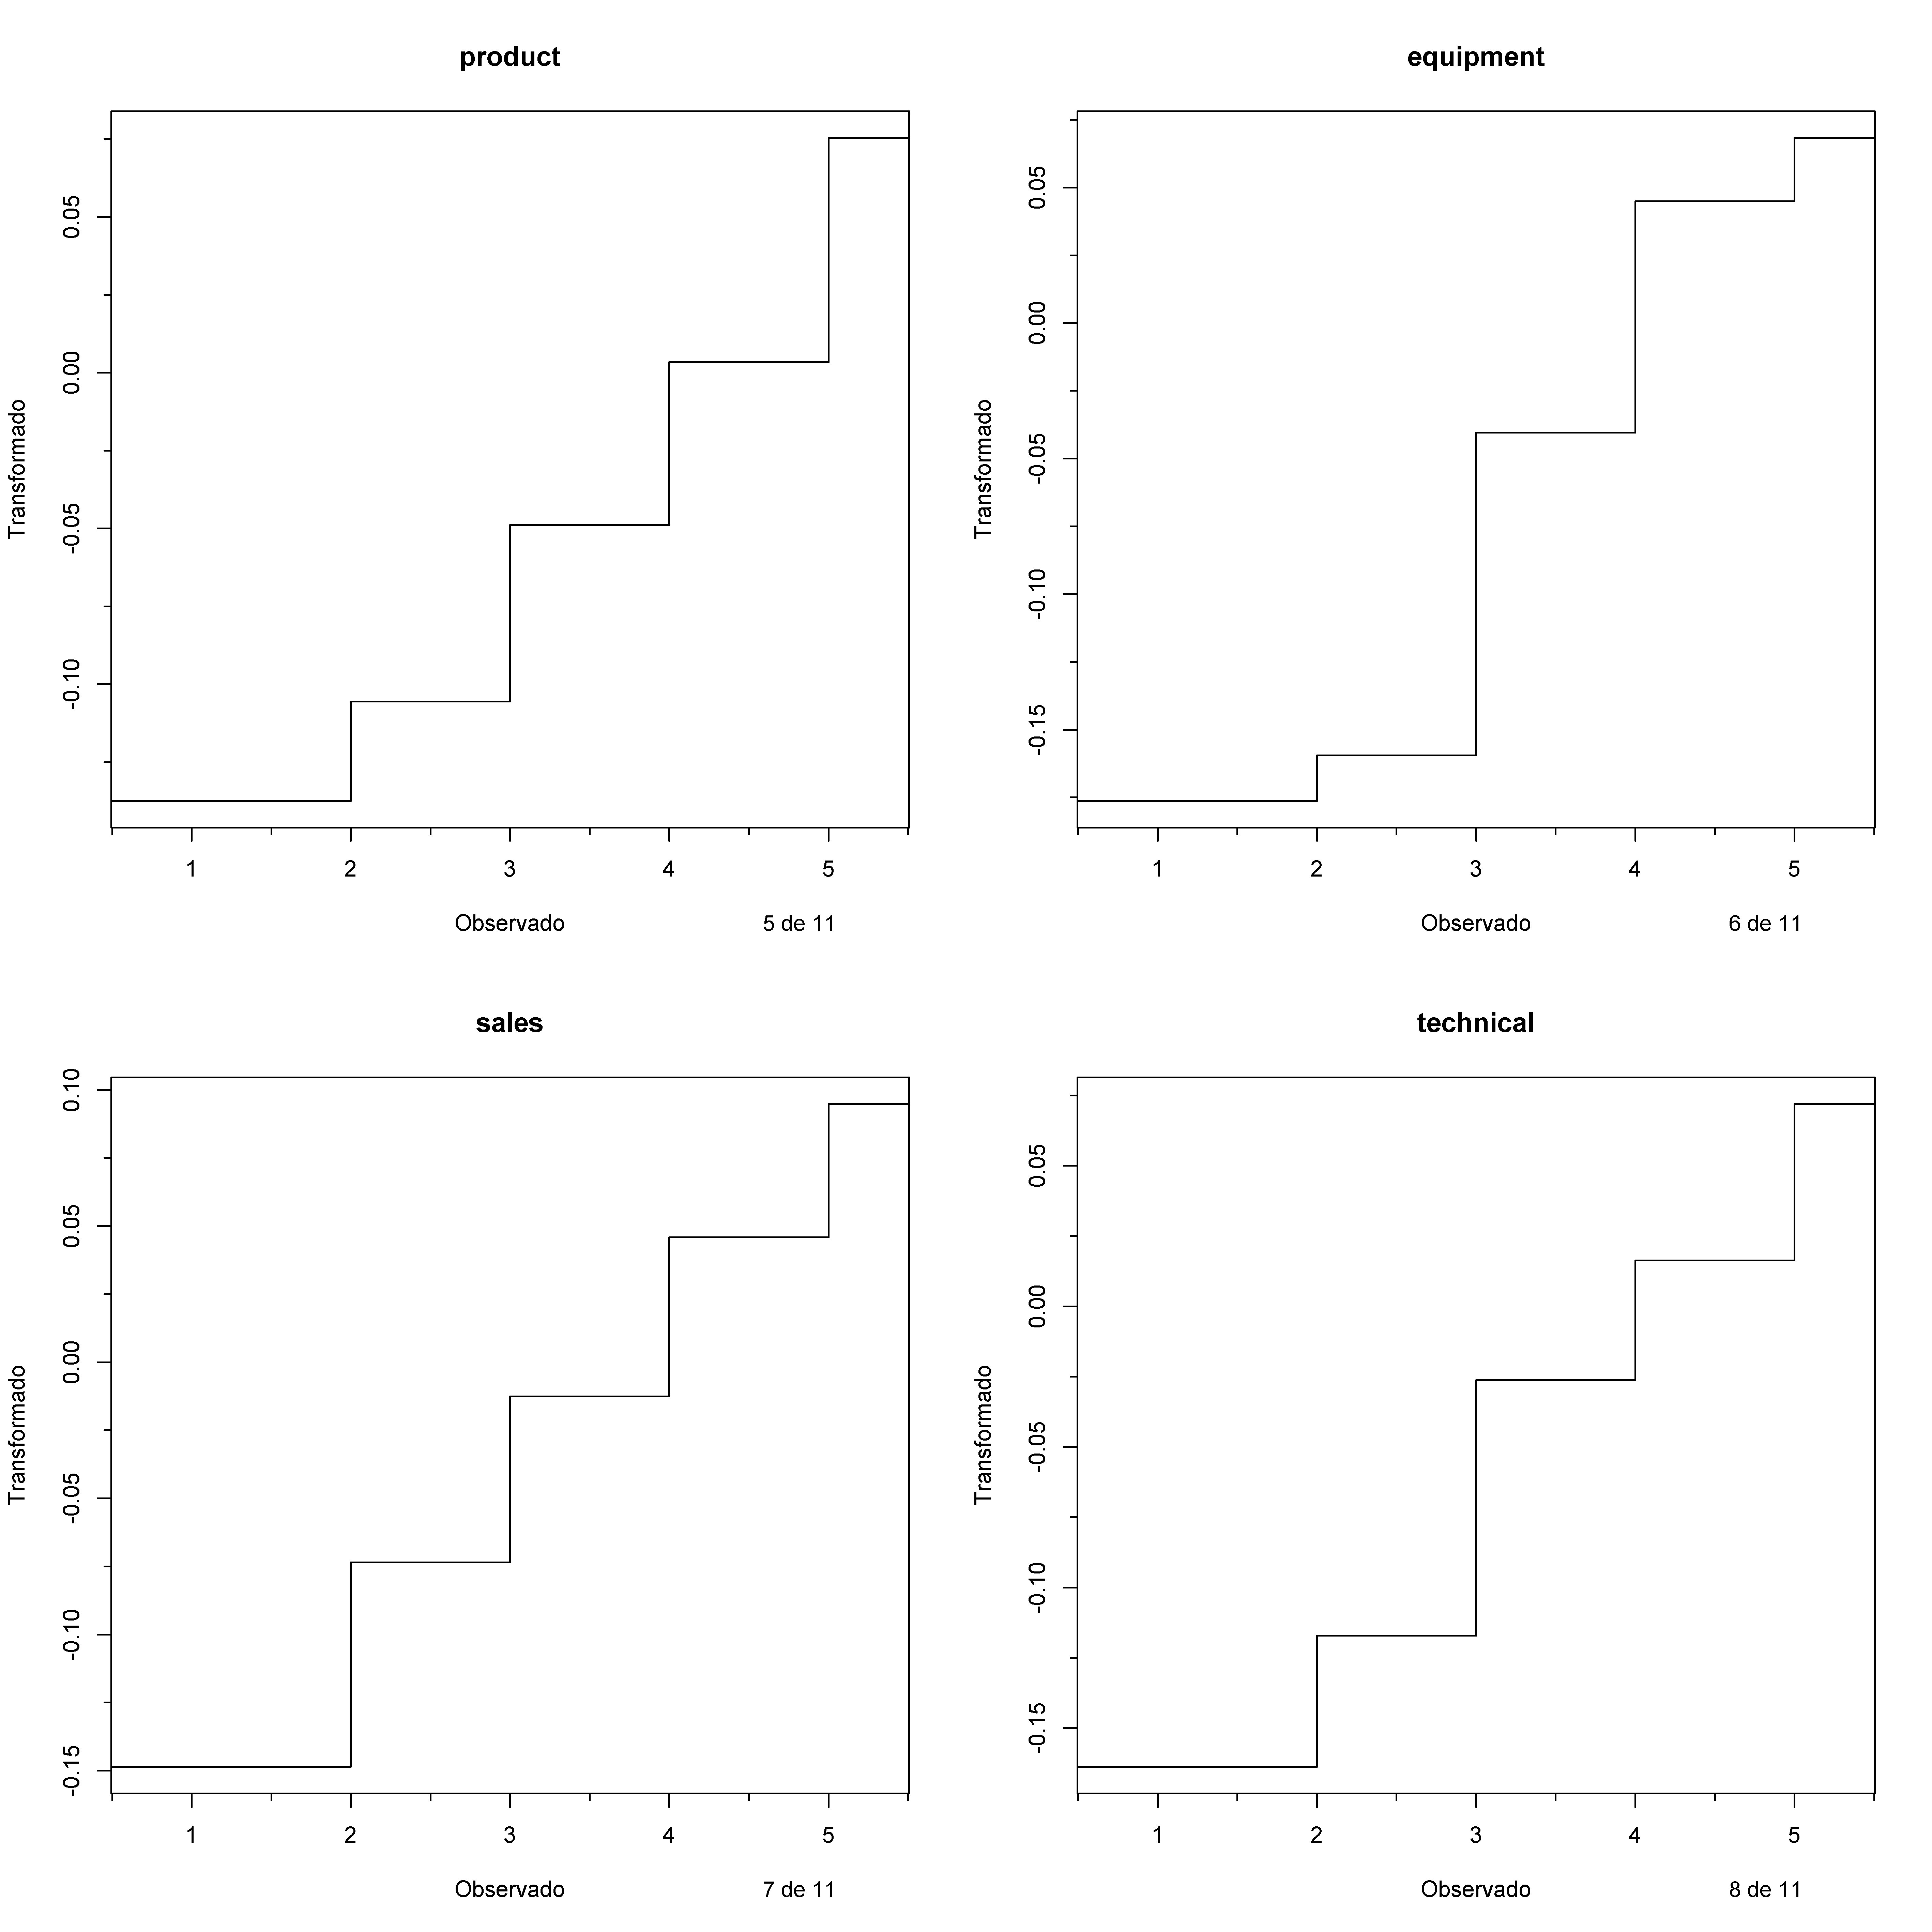 |
|---|
| Picture. Transplots of ABC dataset, just 5 to 8 variables |
 |
|---|
| Picture. Transplots of ABC dataset, just 9 to 11 variables |
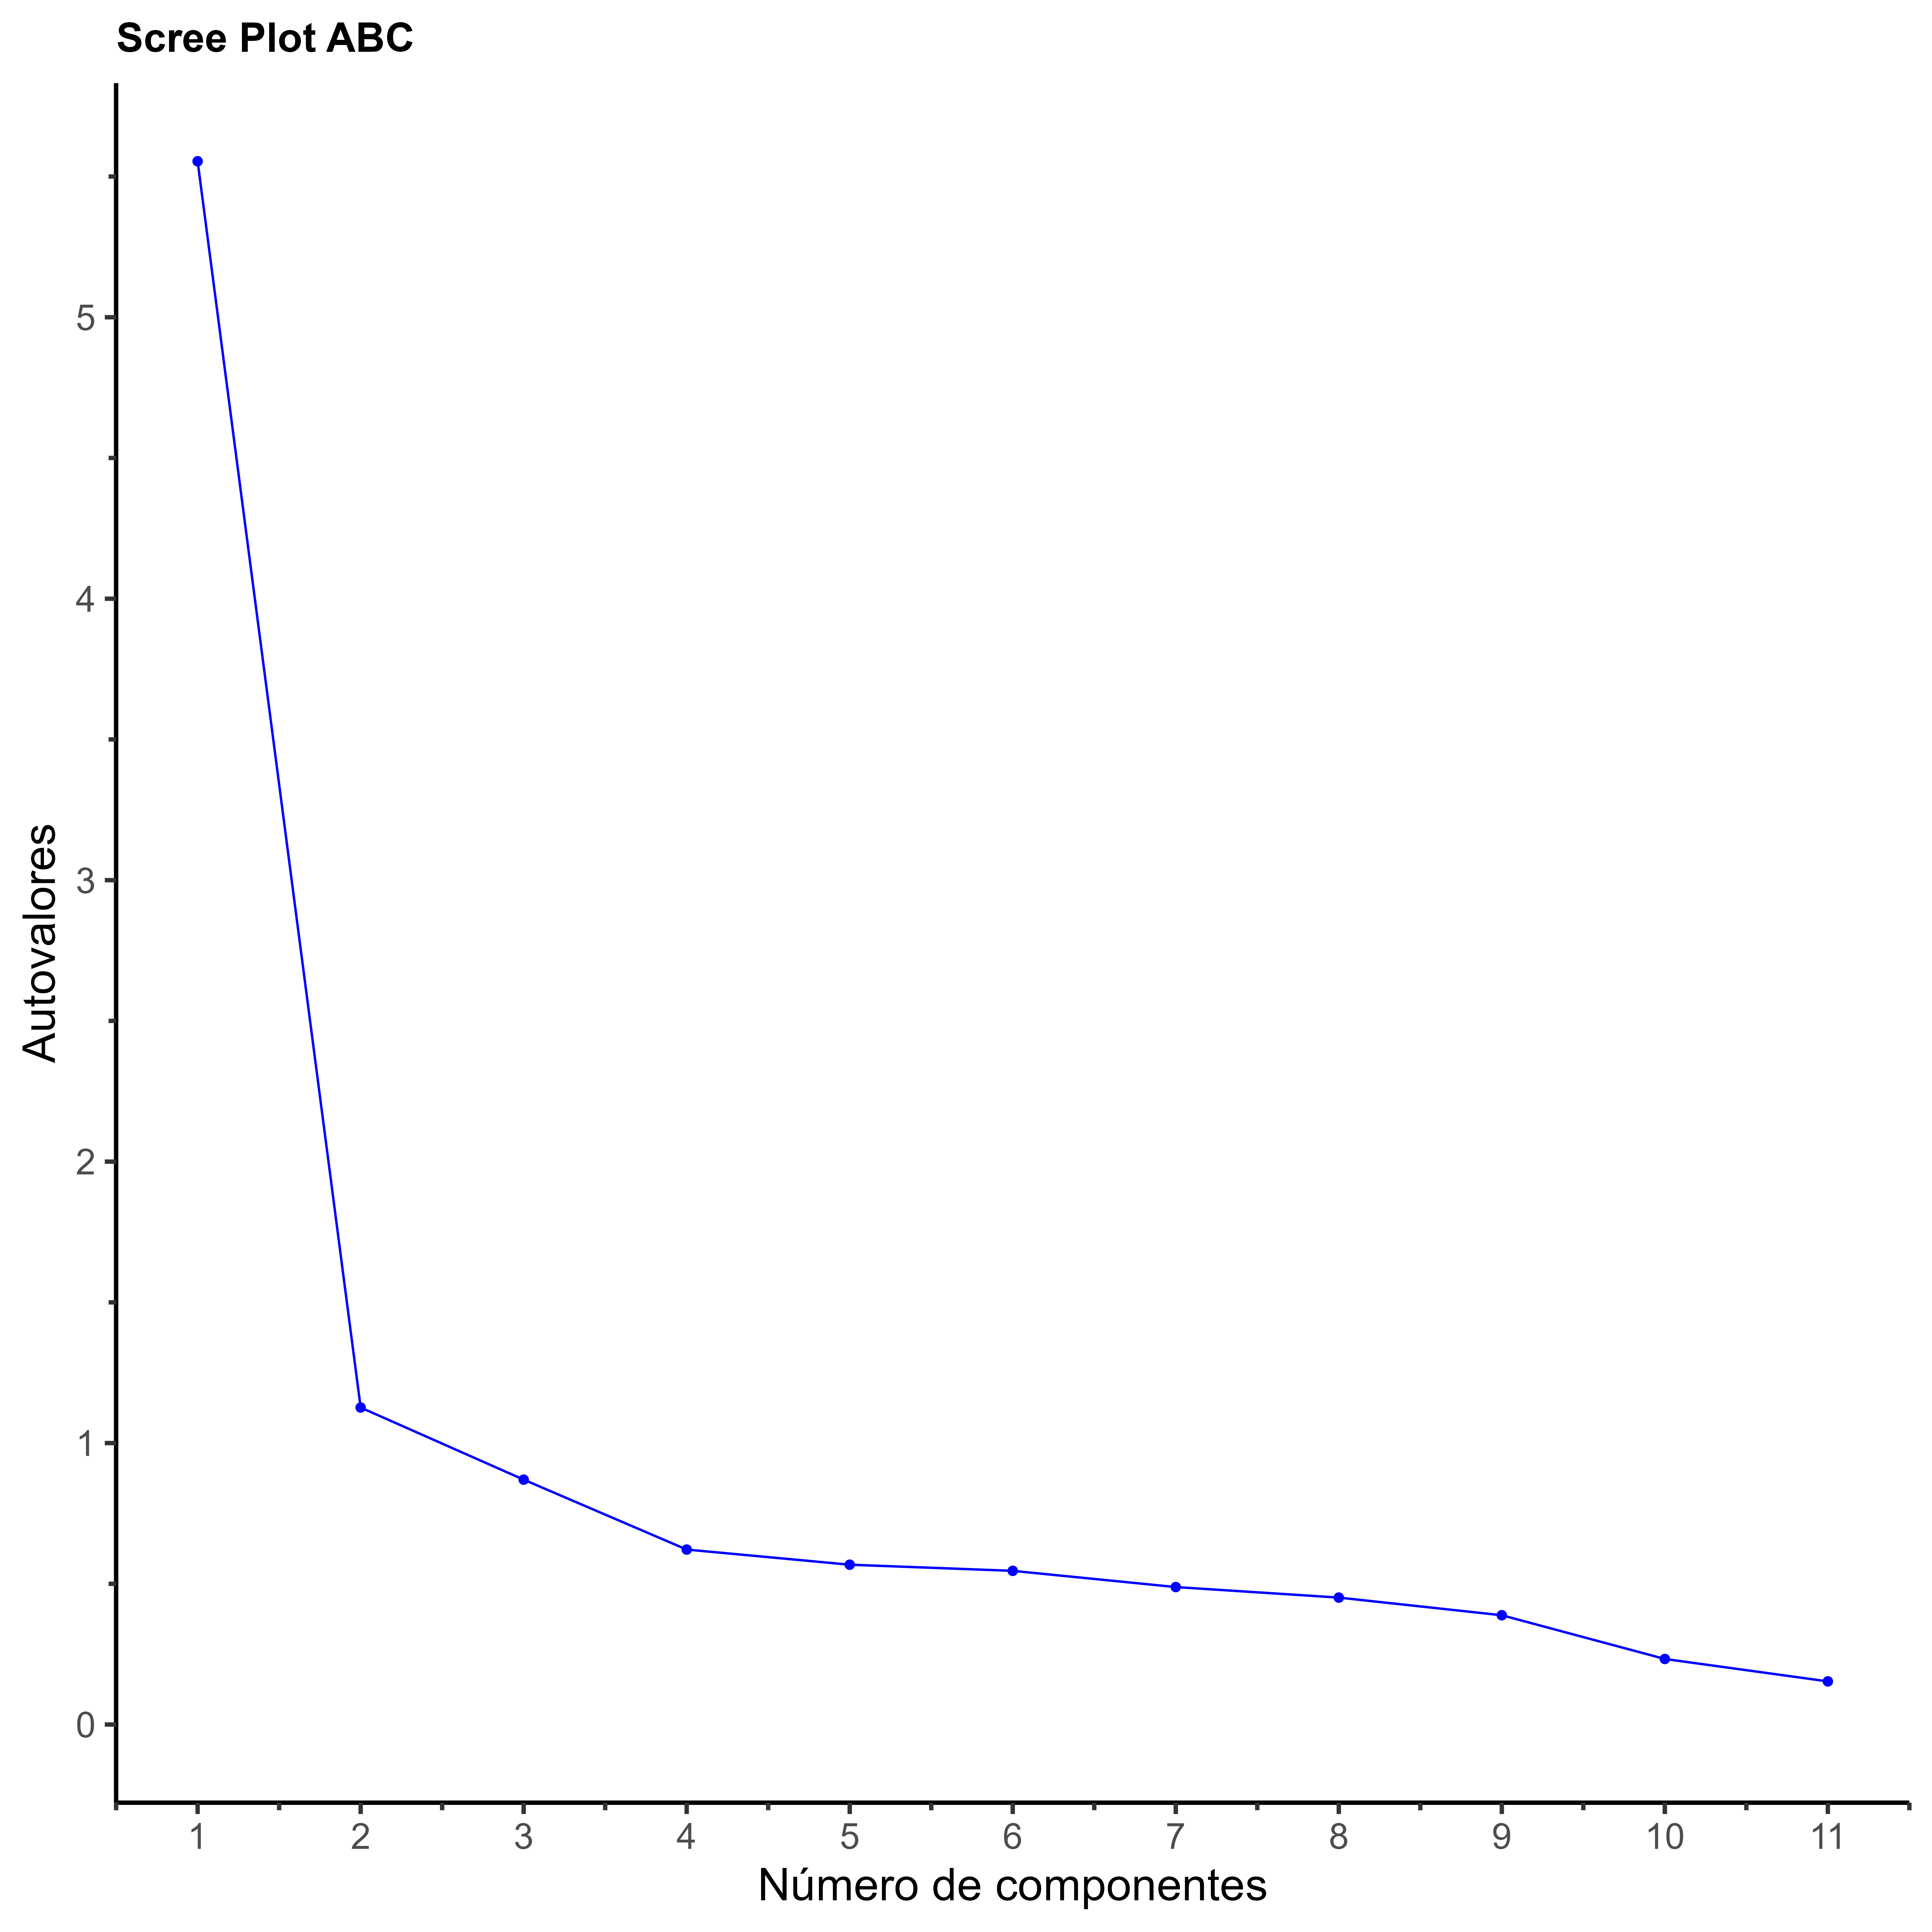 |
|---|
| Picture. Screeplot of ABC dataset |
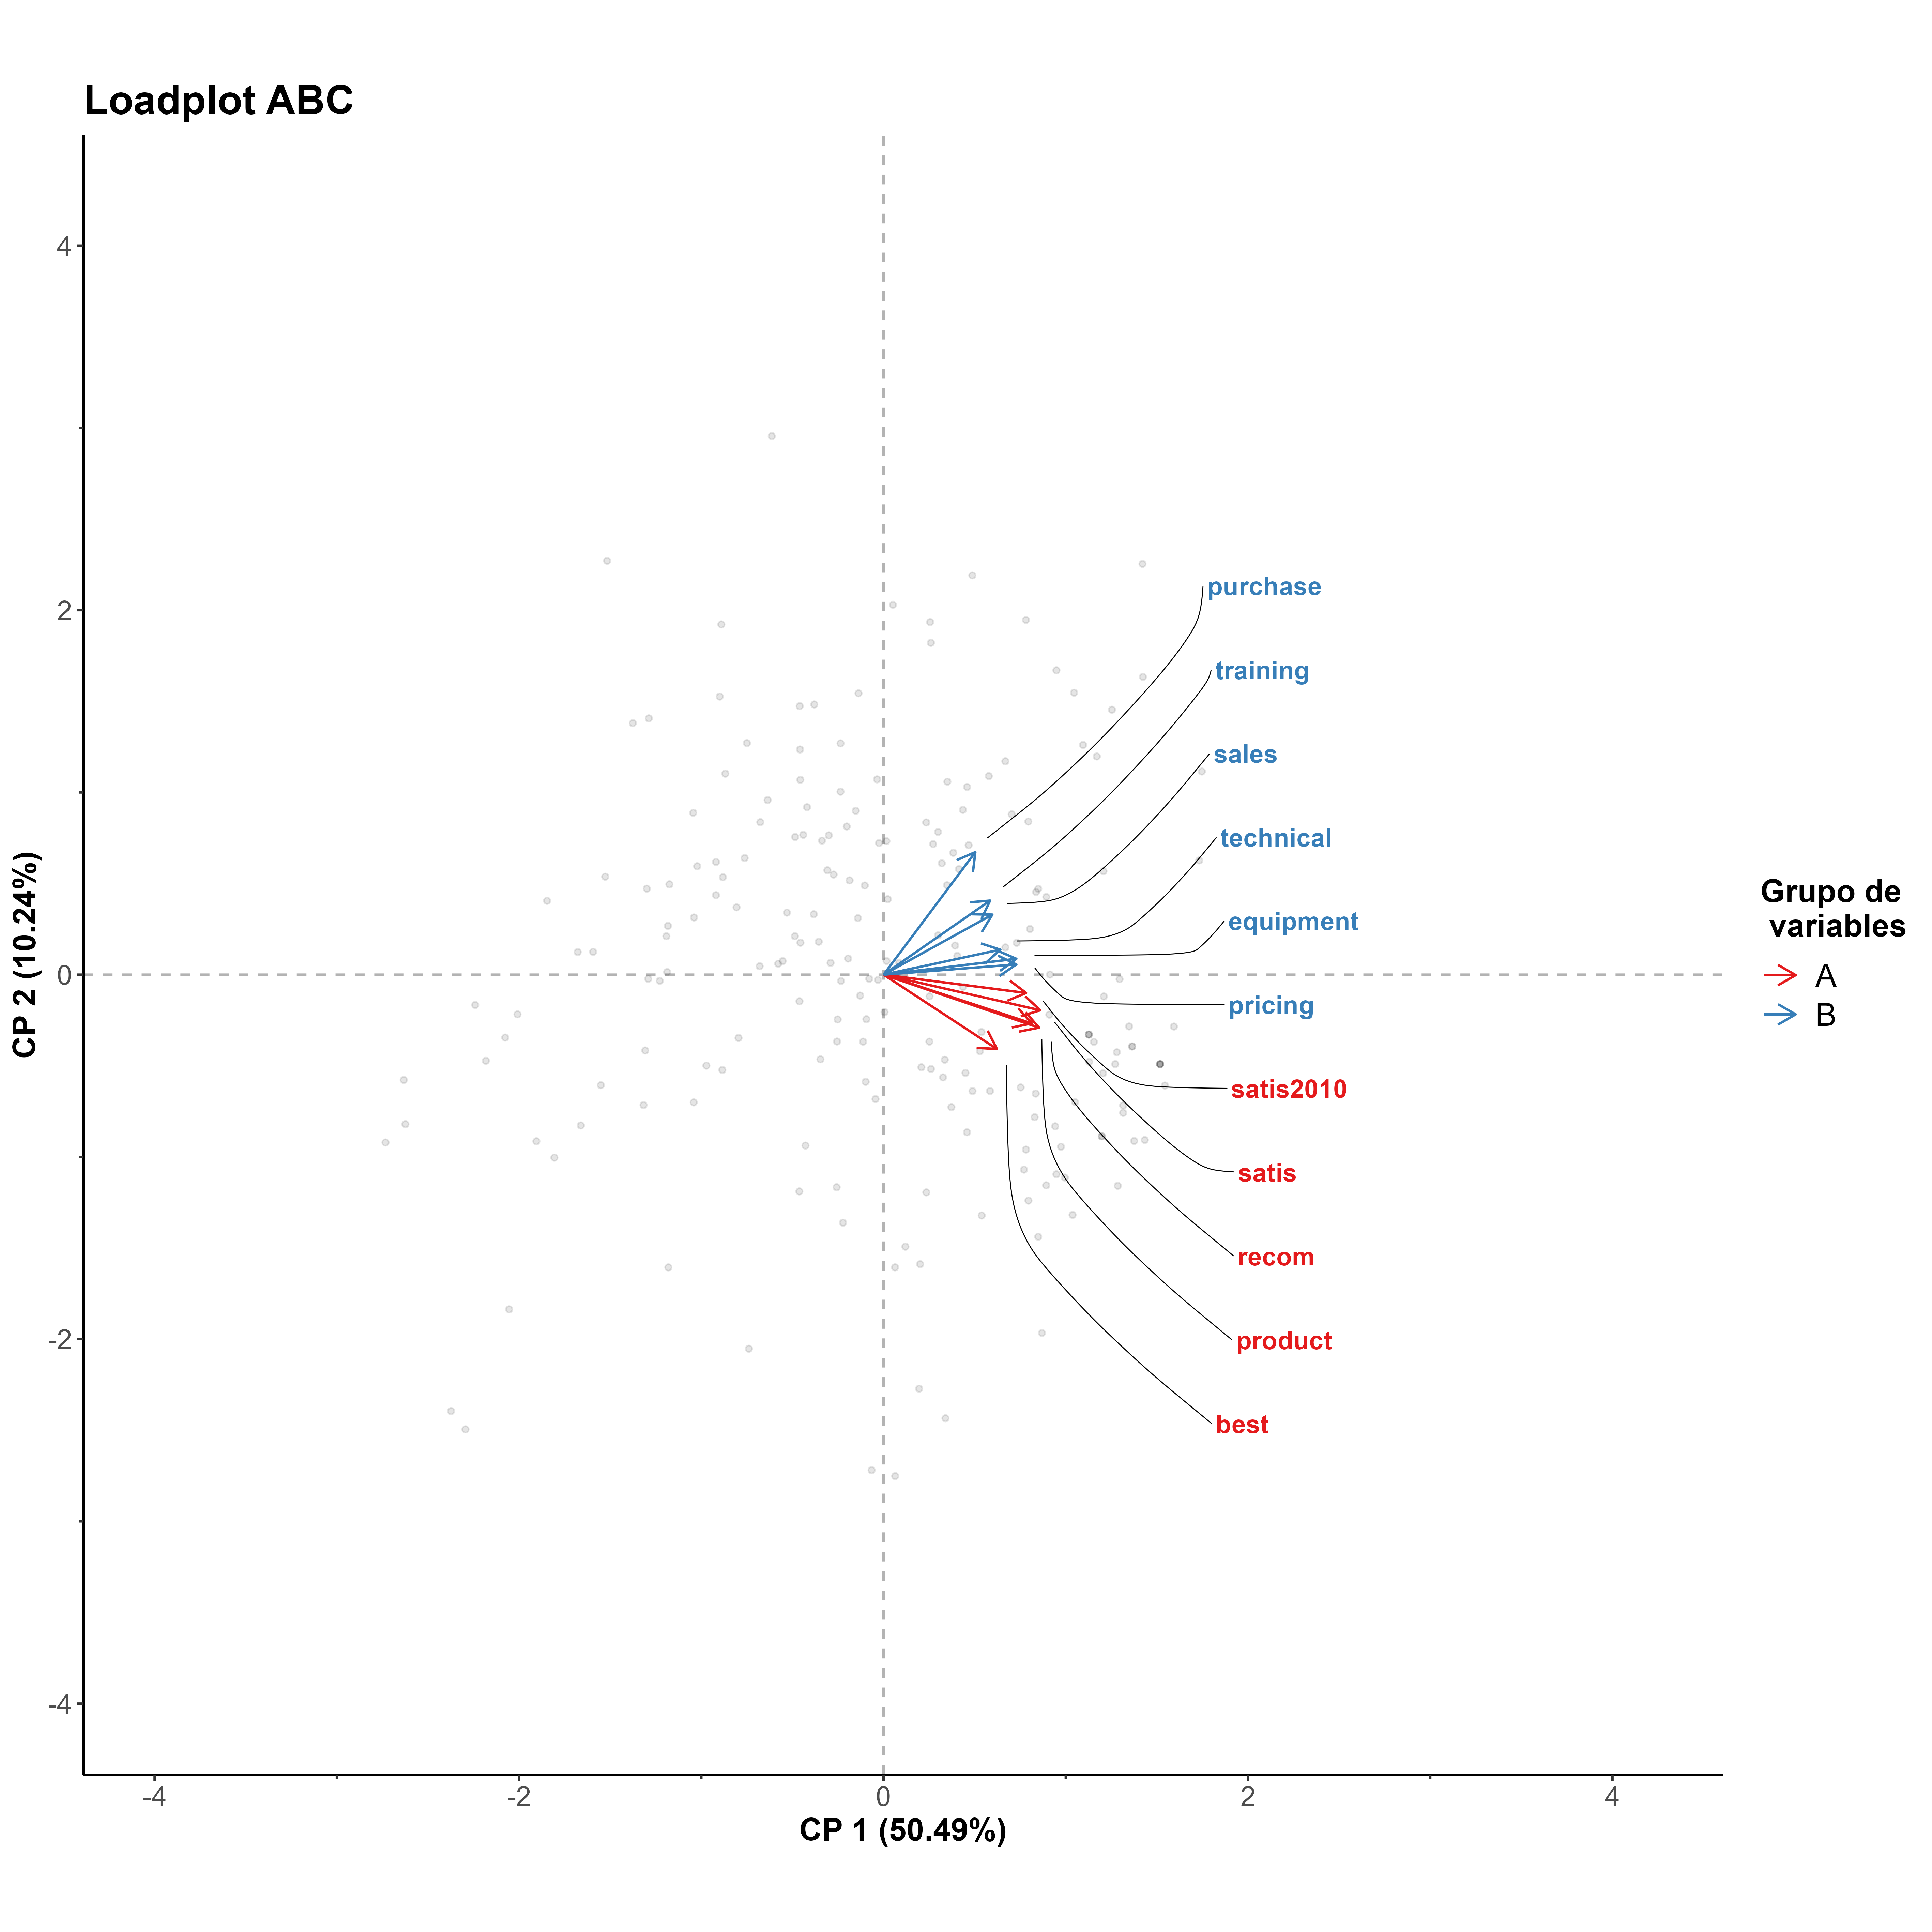 |
|---|
| Picture. Loadplot of ABC dataset |
 |
|---|
| Picture. Biplot of ABC dataset |
- (1) https://cran.r-project.org/web/packages/Gifi/index.html
- (2) https://ggplot2.tidyverse.org/
- (3) https://rdrr.io/rforge/Gifi/src/R/plot.princals.R
- (4) https://github.com/jasb3110/g.princals/blob/0ed7b04adcb1039de5f9cafca0c6315a36a37e09/g.princals.R
- (5) https://github.com/jasb3110/g.princals/blob/61f4d52d20102da5a6440d6416a29b3f23739b94/example.R