Color Chart ROI Tool

- Allows creating of ROIs for chips in a color chart in a way similar to Color Calibrator
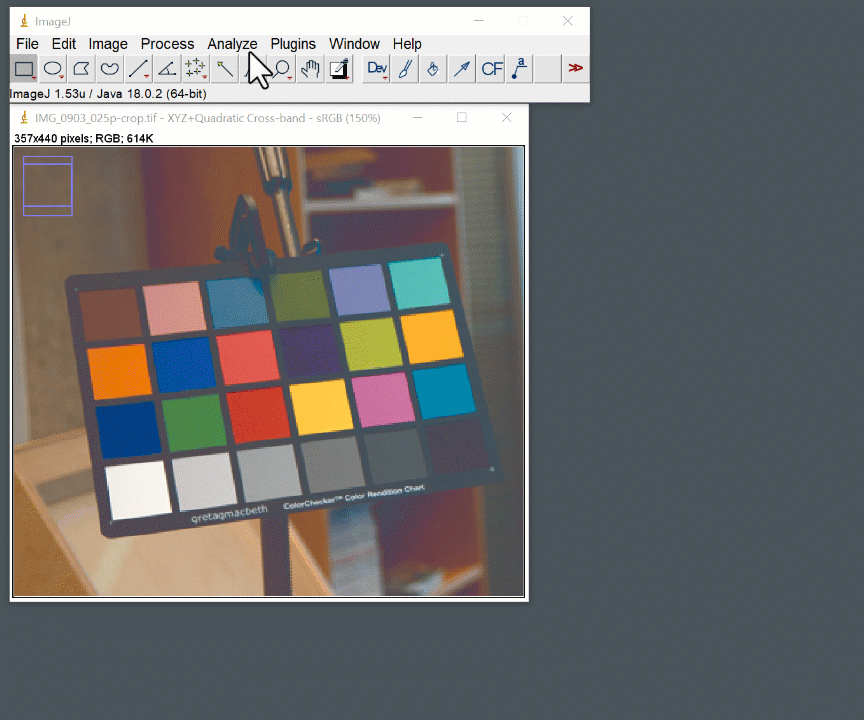
- Select Polygon selection Tool
- Mark 4 corners of the chart
- Set number of rows and columns
- Adjust chip margin
- Set Overlay color
- Set Overlay stroke width (line width)
- Save overlay to a file without closing the dialog. This can be useful when combined with loading next image (File > Open Next). You can create chart overlays for images in a directory without closing the Color Chart Tool
- Sends color chart chip ROI to ROI Manager
- Measures color of each chip. Supports color images (RGB-24) or stacks of gray level images - any number of slices
- Send list of chip's vertices to a Result Table