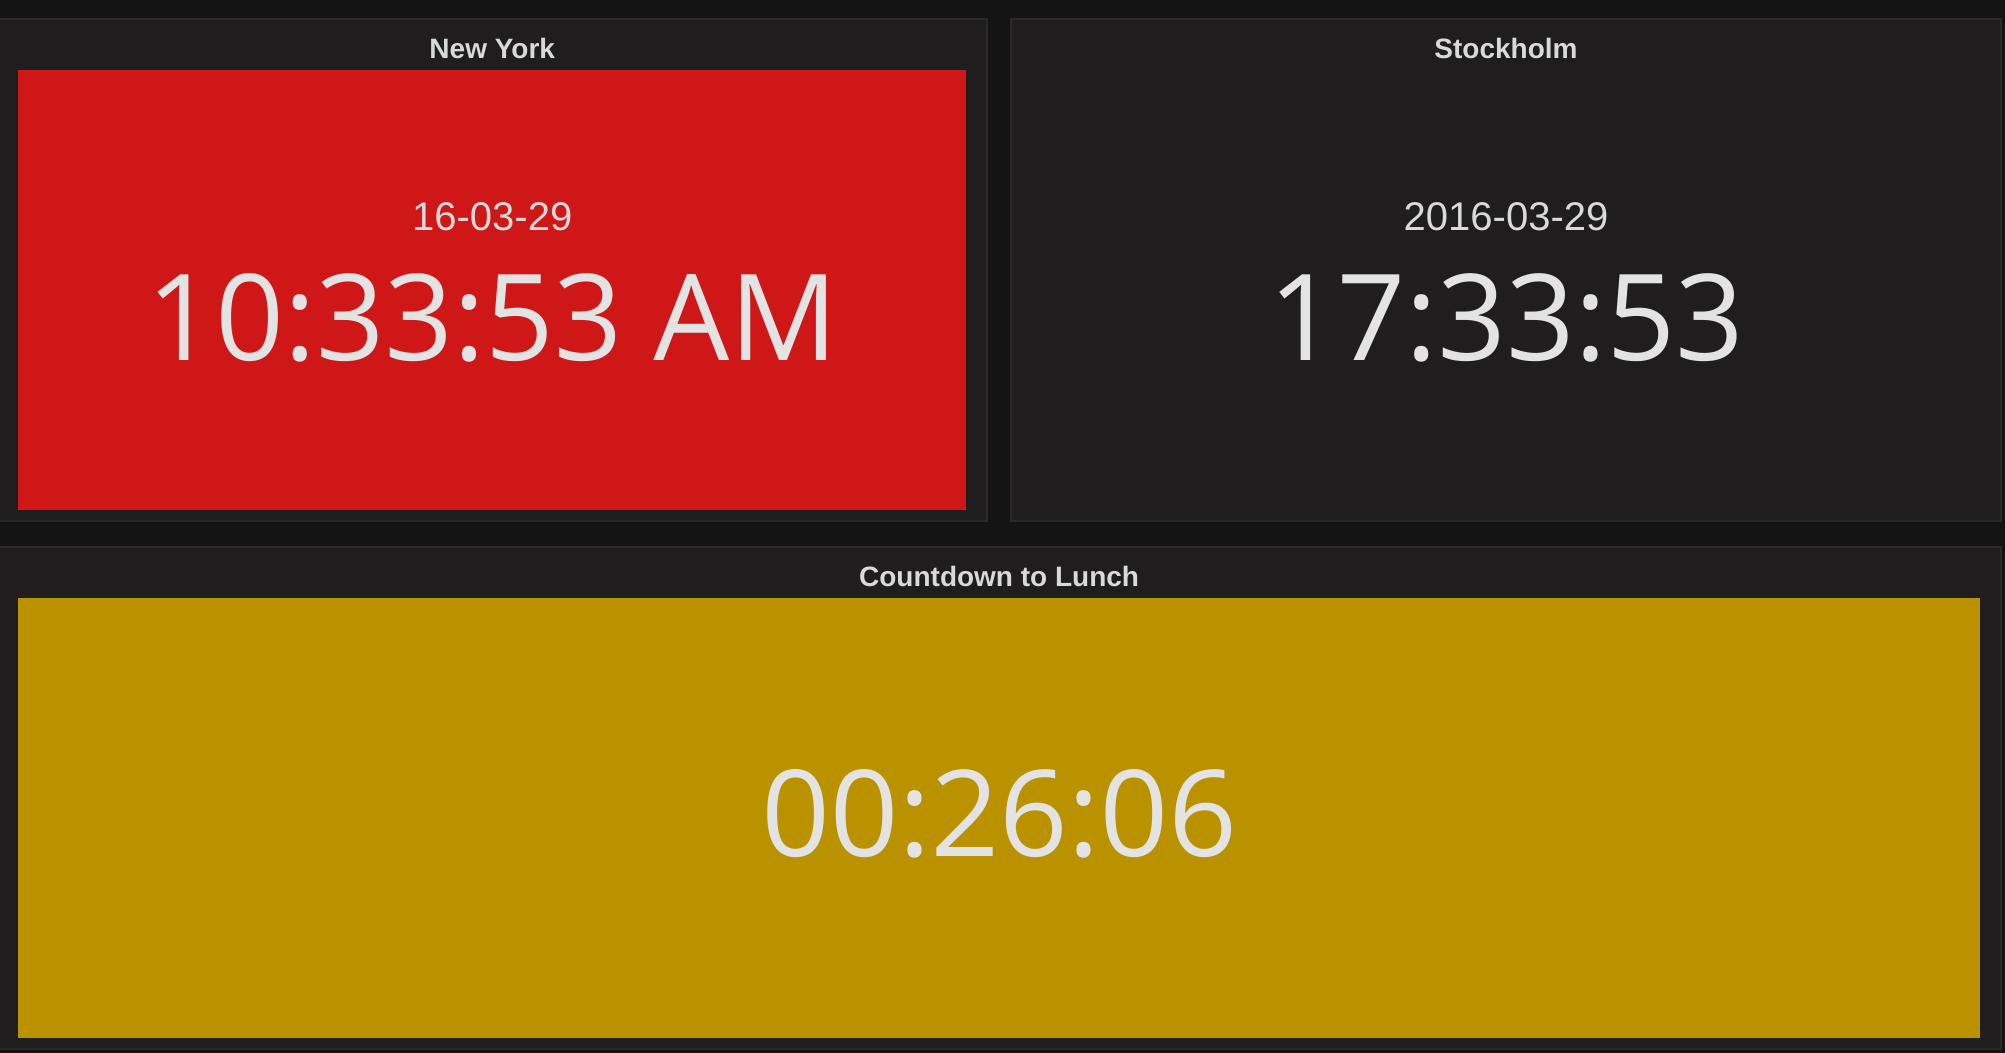
The Clock Panel shows either the current time or a countdown/countup. It updates every second.
You can use the Clock Panel to display the time in another office, or to track a count-down or count-up to an important event.
-
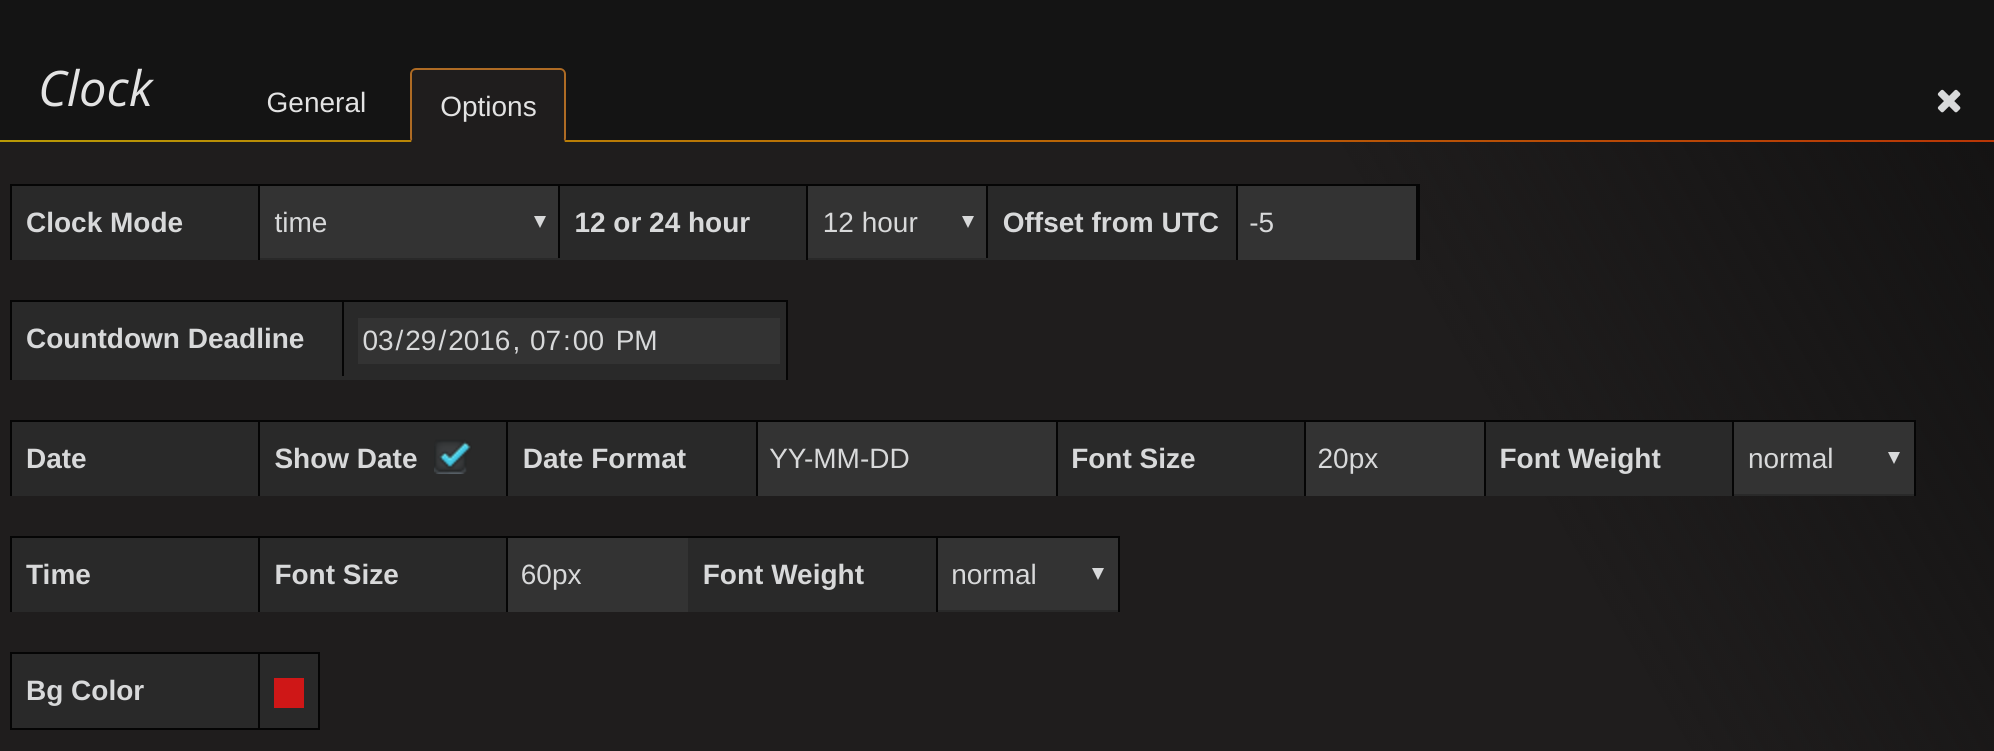
Mode:
The default mode is Time. If you want to use countdown mode, then set the End Time to start the count-down. If you want to use countup mode, then set the Begin Time to start the count-up.
-
Clock Type:
To display time choose between the following formats: 24 Hour, 12 Hour, or Custom.
-
Timezone:
Timezones are supplied by the moment timezone library. You can specify your Timezone or leave it as default to moment's guess using your computer's settings.
Timezone is also used to calculate countdown deadline in countdown mode.
-
Locale:
Locales for date-formatting are supplied by the moment library. You can specify your Locale or leave it as default to moment's guess using your computer's settings.
-
End Time (Countdown mode):
Used in conjunction with mode when set to countdown. Choose a date and time to count down to.
This field also supports dashboard (constant) variables (e.g.
${countdown_target}) to dynamically set the countdown deadline for the Dashboard. -
End Text (Countdown mode):
The text to show when the countdown ends. E.g. LIFTOFF
-
Begin Time (Countup mode):
Used in conjunction with mode when set to countup. Choose a date and time to count up from.
-
Begin Text (Countup mode):
The text to show before the countup starts. E.g. LIFTOFF
-
Date/Time formatting options:
Customize the font size, weight and date/time formatting with this setting.
If second ticking annoys you then change the time format to HH:mm (for the 24-hour clock) or h:mm (for the 12-hour clock), or see the full list of formatting options.
-
Font Monospace:
Enable monospace font for consistent character width and alignment.
-
Description Settings:
Configure descriptive text to display alongside the time:
- Source: Choose between three options:
- None: No descriptive text will be displayed
- Input: Display static text that you enter manually
- Query: Display dynamic text retrieved from a datasource query
- Description Text: Manual text input (only available when using Input source)
- Font Size/Weight: Customize description text appearance
- Source: Choose between three options:
-
Show Date:
Toggle date visibility alongside the time.
-
Date Format:
Customize date formatting using moment.js patterns.
-
Date Locale:
Set locale for date formatting.
-
Date Font Size/Weight:
Customize date text appearance.
-
Timezone Display Options:
Control timezone display:
- Show Timezone: Toggle timezone visibility
- Display Format: Choose between different timezone display formats:
- Normal: Shows full timezone name (e.g. "America/New_York", "UTC")
- Name + Offset: Shows timezone name with offset and abbreviation on separate lines (e.g. "America/New_York" with "(-05:00 EST)" below)
- Offset + Abbreviation: Shows ISO 8601 offset with abbreviation (e.g. "-05:00 EST", "+00:00 UTC")
- Offset: Shows only the ISO 8601 offset (e.g. "-05:00", "+00:00")
- Abbreviation: Shows only the timezone abbreviation (e.g. "EST", "UTC", "PST")
- Font Size/Weight: Customize timezone text appearance
-
Query Configuration (for Countdown/Countup modes):
When using datasource queries for target times:
- Calculation Method: Choose how to select datetime from multiple query results:
- Countdown: Last, Last*, First, First*, Min, Max, Min Future (*excludes null/NaN values)
- Countup: Last, Last*, First, First*, Min, Max, Max Past (*excludes null/NaN values)
- Field Selection: Specify which field contains datetime values
- Error Handling: Configure "No Value Text" and "Invalid Value Text" for query errors
- Calculation Method: Choose how to select datetime from multiple query results:
-
Background Color:
Choose a background color for the clock with the color picker.
-
Refresh:
Choose between "Every second" (default) or "With the dashboard".
When set to "With the dashboard", the clock is paused and only updated when the dashboard refreshes. The clock will show the timestamp for the last refresh.
If you see a red triangle error in the top-left corner of the panel it's likely because:
- You selected a datasource but there are no actual queries for your clock configuration
- The selected datasource has an empty or invalid query that produces an error
- Delete the query from the Query tab to remove the error
- Use the "Grafana" datasource as an alternative that won't generate errors even when not actively used