| Latest Release |
|
| Examples |
|
| PyPI Downloads |
|
| License |
|
RadViz-Plotly is an open-source Python package designed for data scientists to create 2D and 3D Radial Visualization (RadViz) plots for high-dimensional datasets. These visualizations provide a comprehensive view of data distribution across dimensions, enabling better understanding and discovery of hidden insights. The package leverages the powerful interactive tools of the Plotly library.
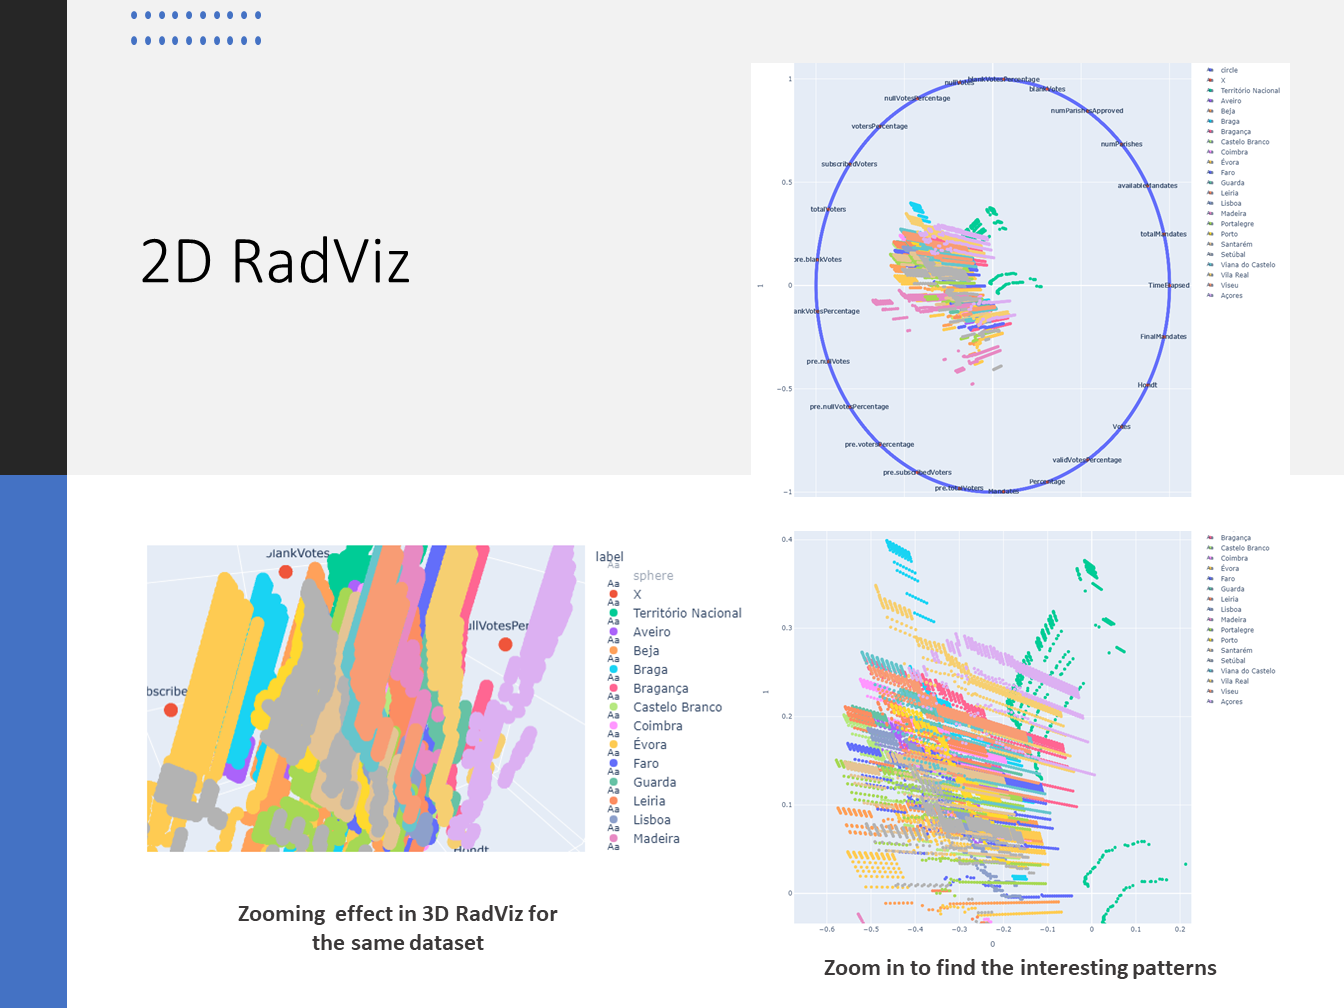
- 2DRadViz: Generates 2D Radial Visualizations.
- 3DRadViz: Creates 3D Radial Visualizations.
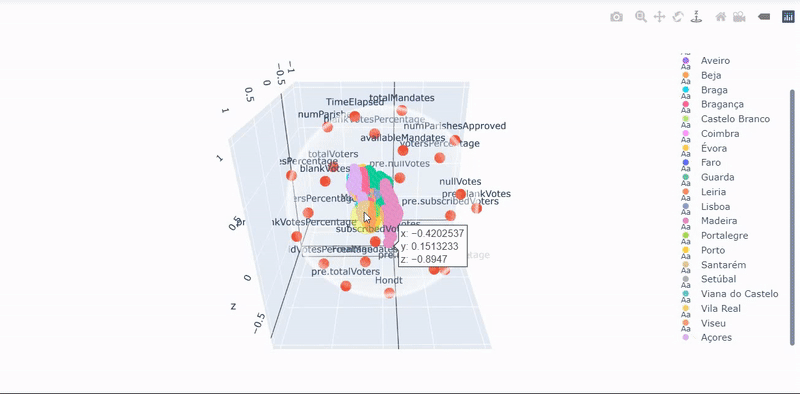
- Interactive Visualizations: Zoom, filter labels, and rotate 3D graphs.
You can try RadViz-Plotly without installing it locally by following these steps:
- Click here to access interactive Jupyter notebooks. This repository contains three folders, each with datasets and a Jupyter notebook demonstrating RadViz-Plotly.
- Note: The Jupyter environment may take some time to load.
- Open one of the folders (e.g., Car Evaluation Dataset, Election Dataset, or Iris Dataset).
- Open the file with the
.ipynbextension (Jupyter notebook). - From the Cell menu in the toolbar, select Run All to execute the notebook.
Hints:
- The first run may take time to install dependencies.
- The package supports interactive features like zooming, filtering labels, and rotating 3D graphs.
- RadViz-Plotly depends on the Plotly library.
- Install RadViz-Plotly using pip:
pip install RadViz-Plotly
- Clone the examples repository:
Alternatively, download the repository as a ZIP file here.
git clone https://github.com/elewah/RadViz-Plotly-Examples.git
- Run the examples using Jupyter Lab to understand how to use the RadViz-Plotly package.


RadViz-Plotly was developed by a research group at the IoT Lab, Ontario Tech University. It provides tools for creating 2D and 3D Radial Visualizations, enabling data scientists to explore high-dimensional datasets interactively.
If you use RadViz-Plotly in your research, please cite the following paper:
This project is licensed under the MIT License.

