This R package, which has no dependencies, contains a variety of functions for a variety of applications. Download it by running the line of code devtools::install_github("davidblakneymoore/DBM.functions").
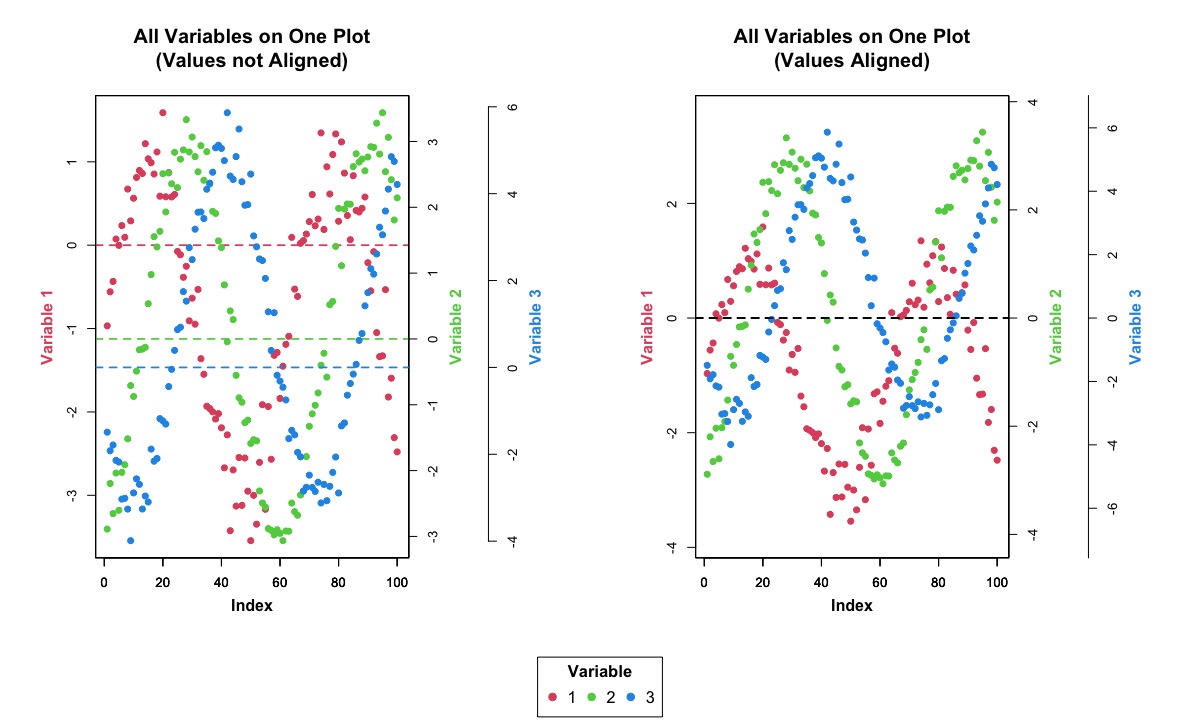
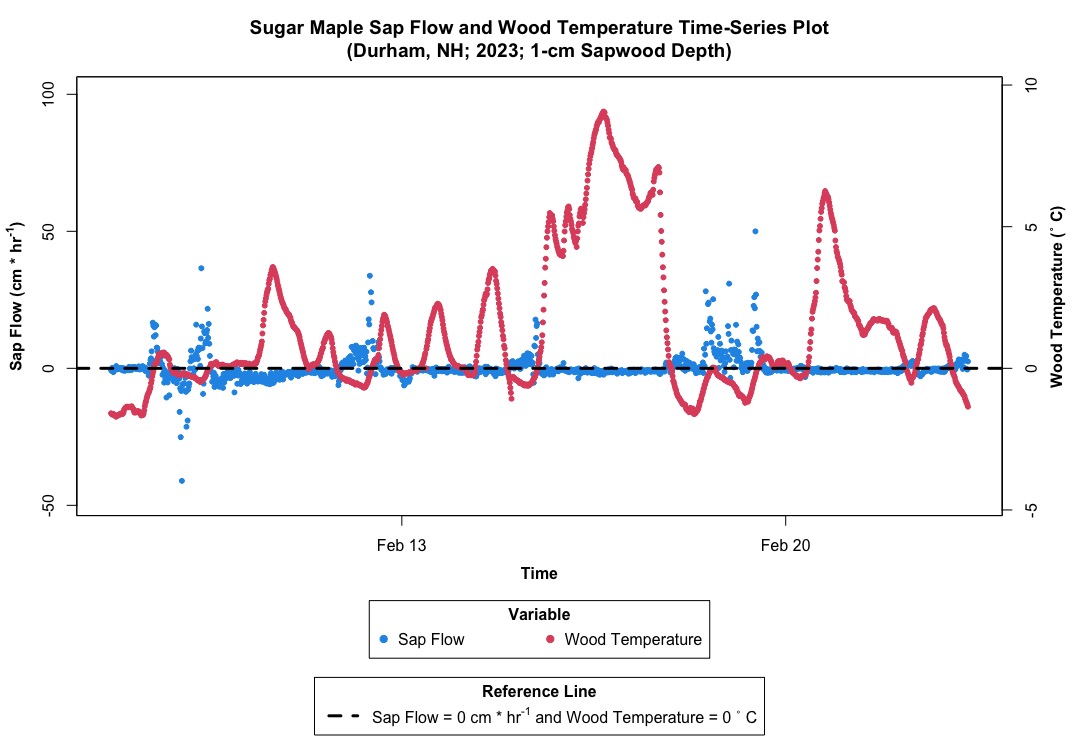
The function Aligning_Values_Across_Multiple_Vertical_Axes generates axis limits for aligning values across multiple vertical axes on plots. Here and here are example figures that used this function to align values across multiple vertical axes.
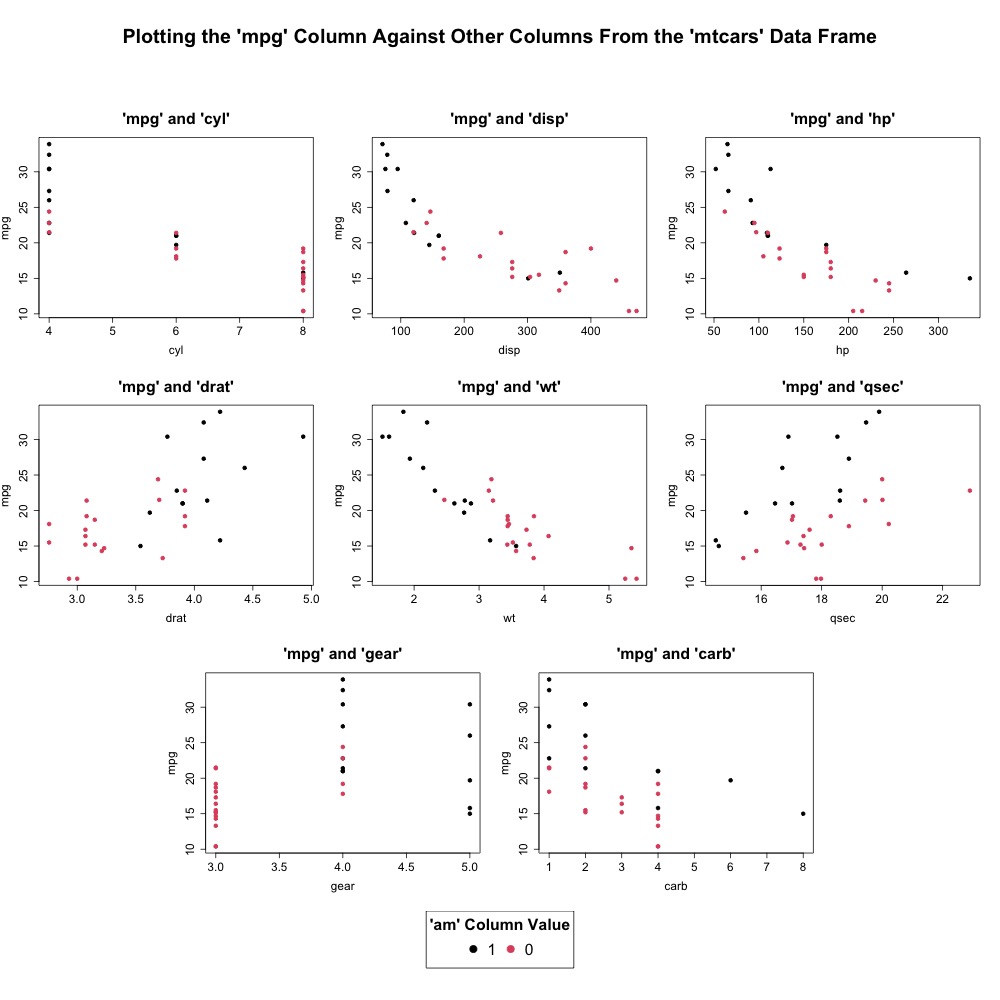
The function Arranging_Plots_Nicely generates a plot layout matrix that is as square as possible - in other words, it generates a plot layout matrix whose number of rows and number of columns differ by either 0 (if possible) or 1 (as a last resort). Here is an example figure that was made using this function.
The function Attempting_to_Diagonalize_a_Matrix_Based_on_Its_Full_Diagonal performs row exchanges and column exchanges on a matrix until the largest entries in the matrix lie as close as possible to the full diagonal and the smallest entries in the matrix lie as far as possible from the full diagonal. This procedure is useful for creating bipartite interaction matrix visualization plots where the species (nodes) from different trophic levels that interact more frequently are closer together and species (nodes) that interact less frequently are farther apart on the bipartite interaction visualization plot.
The function Checking_Layout_Matrix_Viability determines if a potential layout matrix (for plotting) is viable by determining if any plot numbers are skipped and if all potential plotting regions are single, contiguous, perfect rectangles.
The function Comparing_Multiple_Independent_Correlation_Coefficients compares multiple correlation coefficients from independent correlations (Levy, 1977). This function generates p values for pairwise correlation coefficient comparisons as well as means separation lettering. It has been cited in several publications (Beghin, 2023; Chue and Yeo, 2022; Findor et al., 2021; Karakai and Moskotina, 2024; Matko and Sedlmeier, 2023).
The function Finding_the_Full_Diagonal_of_a_Matrix finds the full diagonal of a matrix. A full diagonal of a matrix is the diagonal of the matrix that is the line segment that starts at the entry in the first row and the first column of the matrix and that ends at the entry in the last row and the last column of the matrix. If the numbers of rows and columns are coprime, the only two matrix entries that fall perfectly along the full diagonal are its two endpoints; when the numbers of rows and coliumns are not coprime, there will be more than two elements of the full diagonal. For square matrices, the main diagonal and the full diagonal are identical, but for non-square matrices, the main diagonal and the full diagonal are not identical.
The function 'Finding_the_Least_Common_Denominator_of_Imperfect_Fractions' takes, as its input, a vector of imperfect fractions and returns a number which, when multiplied by each element of the input vector, returns a vector of integers. This function was originally developed to turn vectors of heights and widths for a plot layout matrix into a layout matrix where each entry in the layout matrix represents a region in the plot layout matrix of equal size (in other words, it can be used to create a plot layout matrix for which heights and widths are not required because they are implied by the plot layout matrix). (It was specifically developed with this use in mind for the Making_Replicable_Layout_Matrices_for_Complicated_Figures and Generating_Figures_Containing_a_Bipartite_Interaction_Matrix_Visualization_Plot_and_Corresponding_Higher_and_Lower_Trophic_Level_Phenology_Plots_by_Factors functions that are also in this package.)
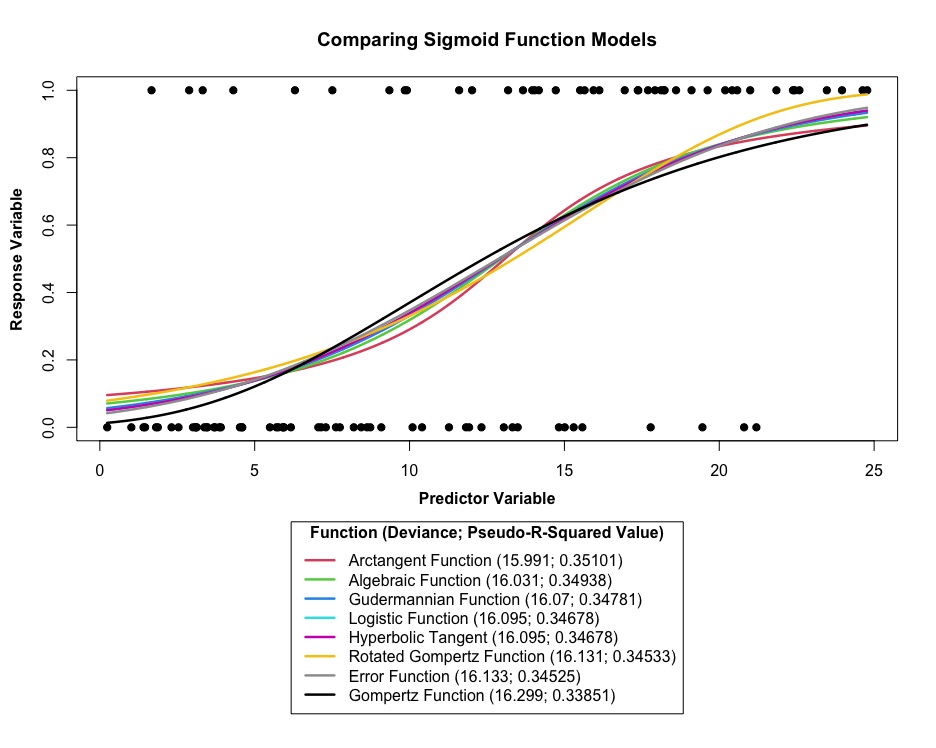
The function Finding_the_Optimal_Sigmoid_Function_Model determines which sigmoid function best fits a binary response data set (a data set where the response variable contains only 1s and 0s) from ten different, fully differentiable sigmoid functions. Here is a plot that shows what this function can do.
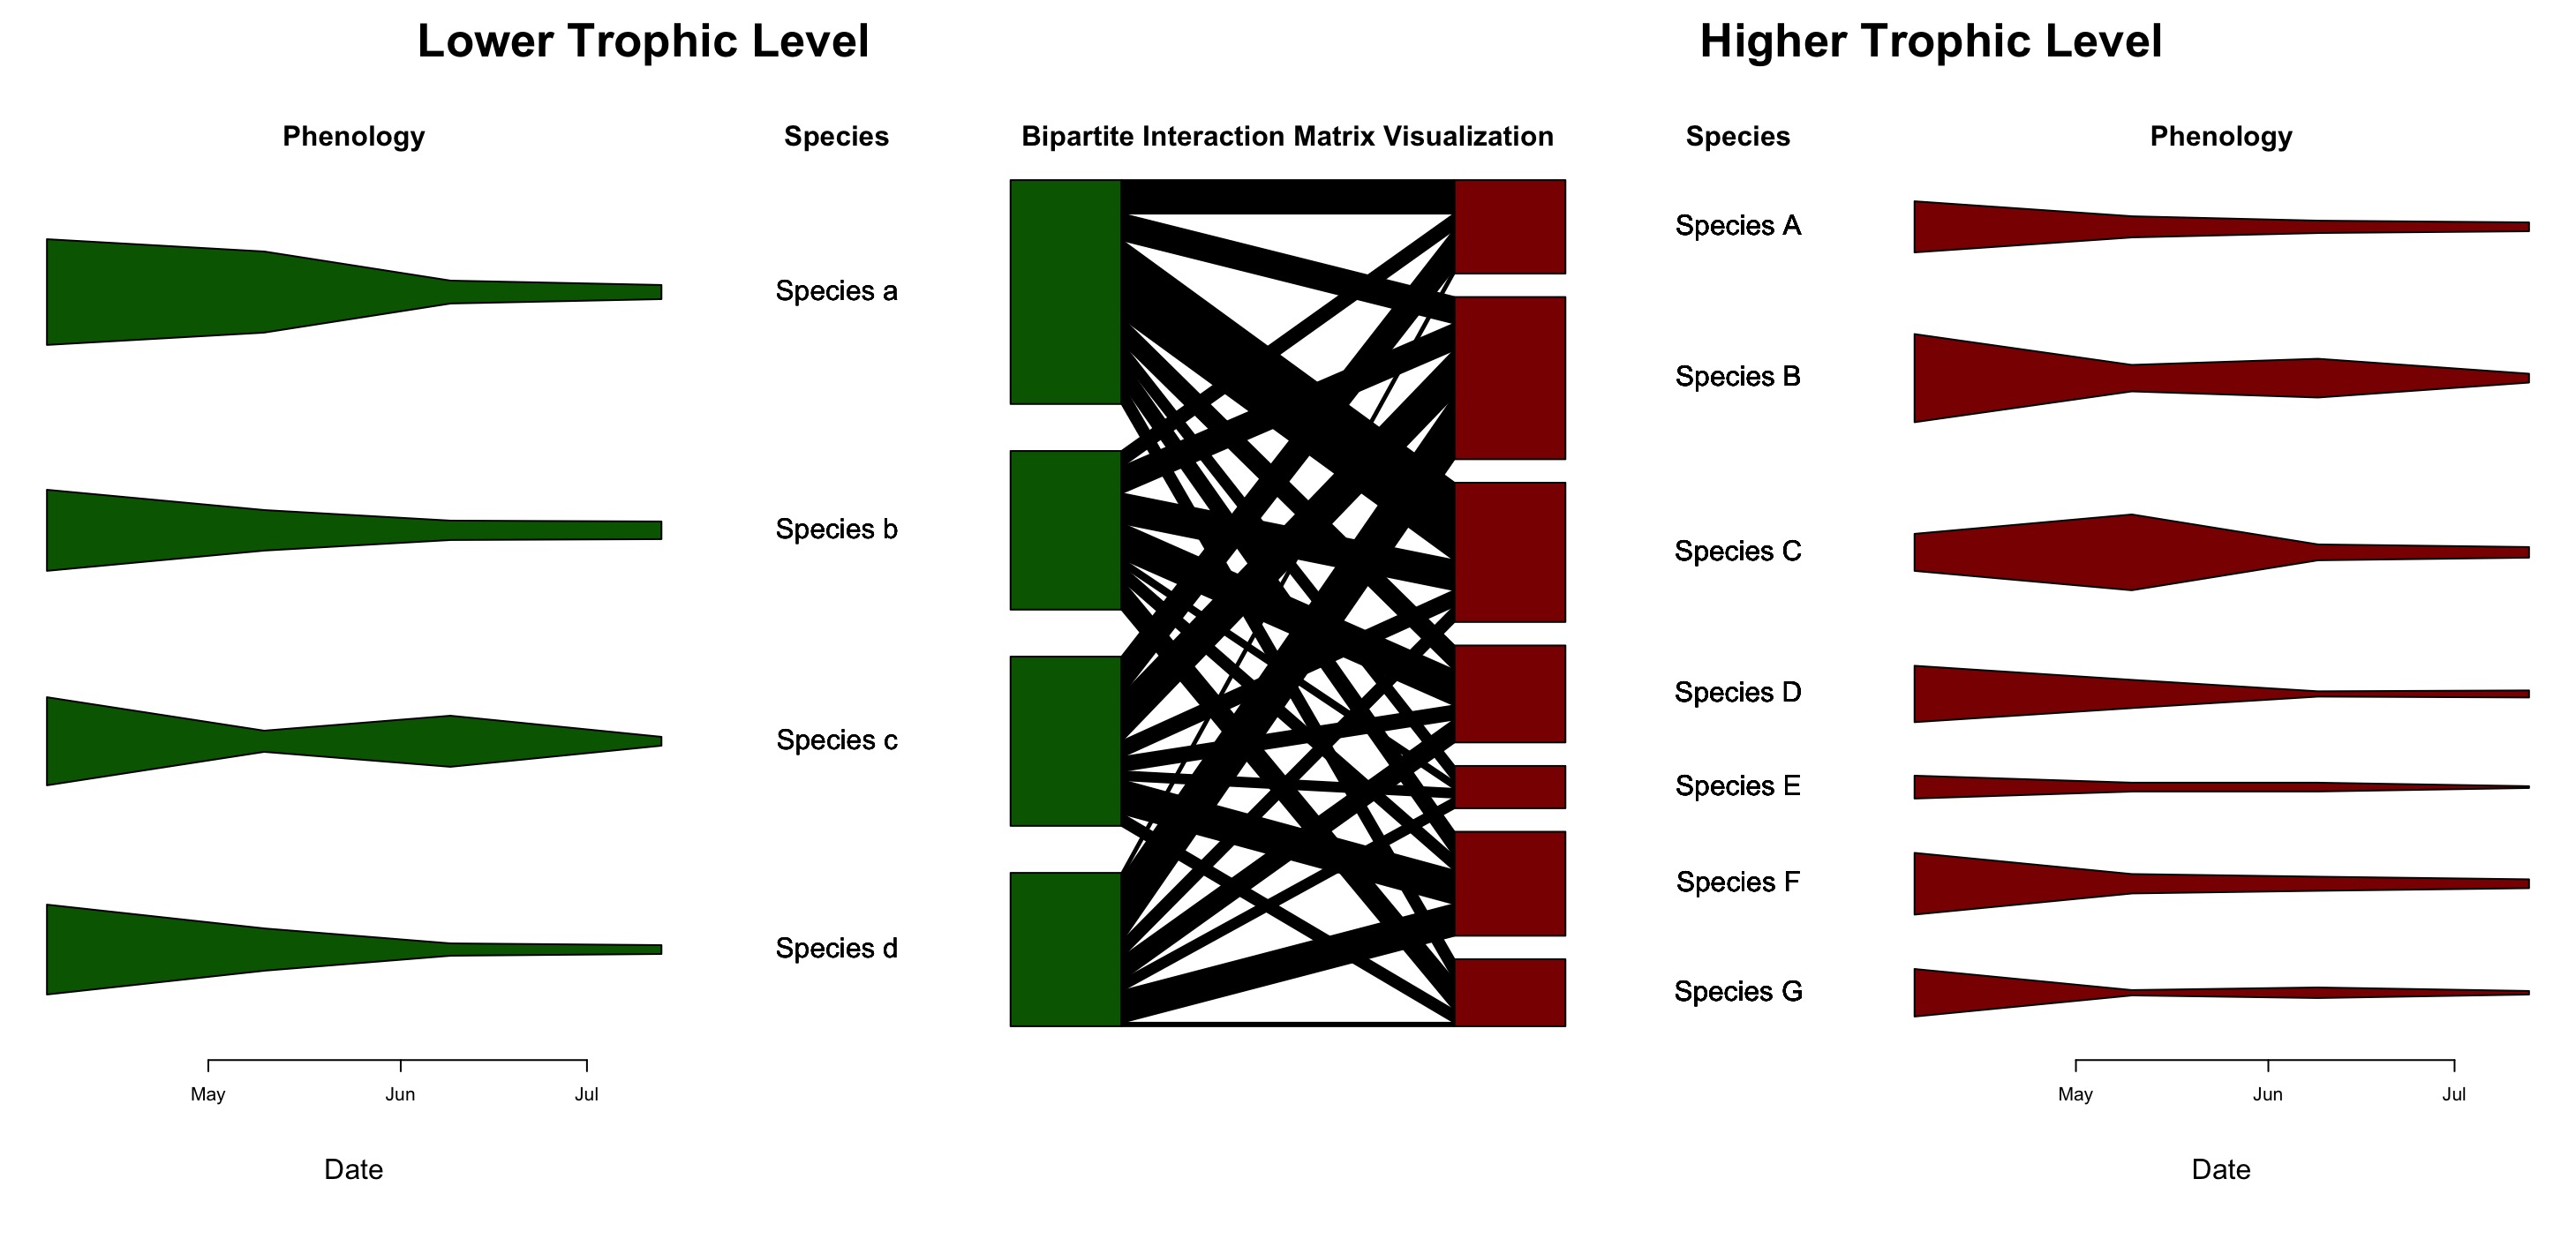
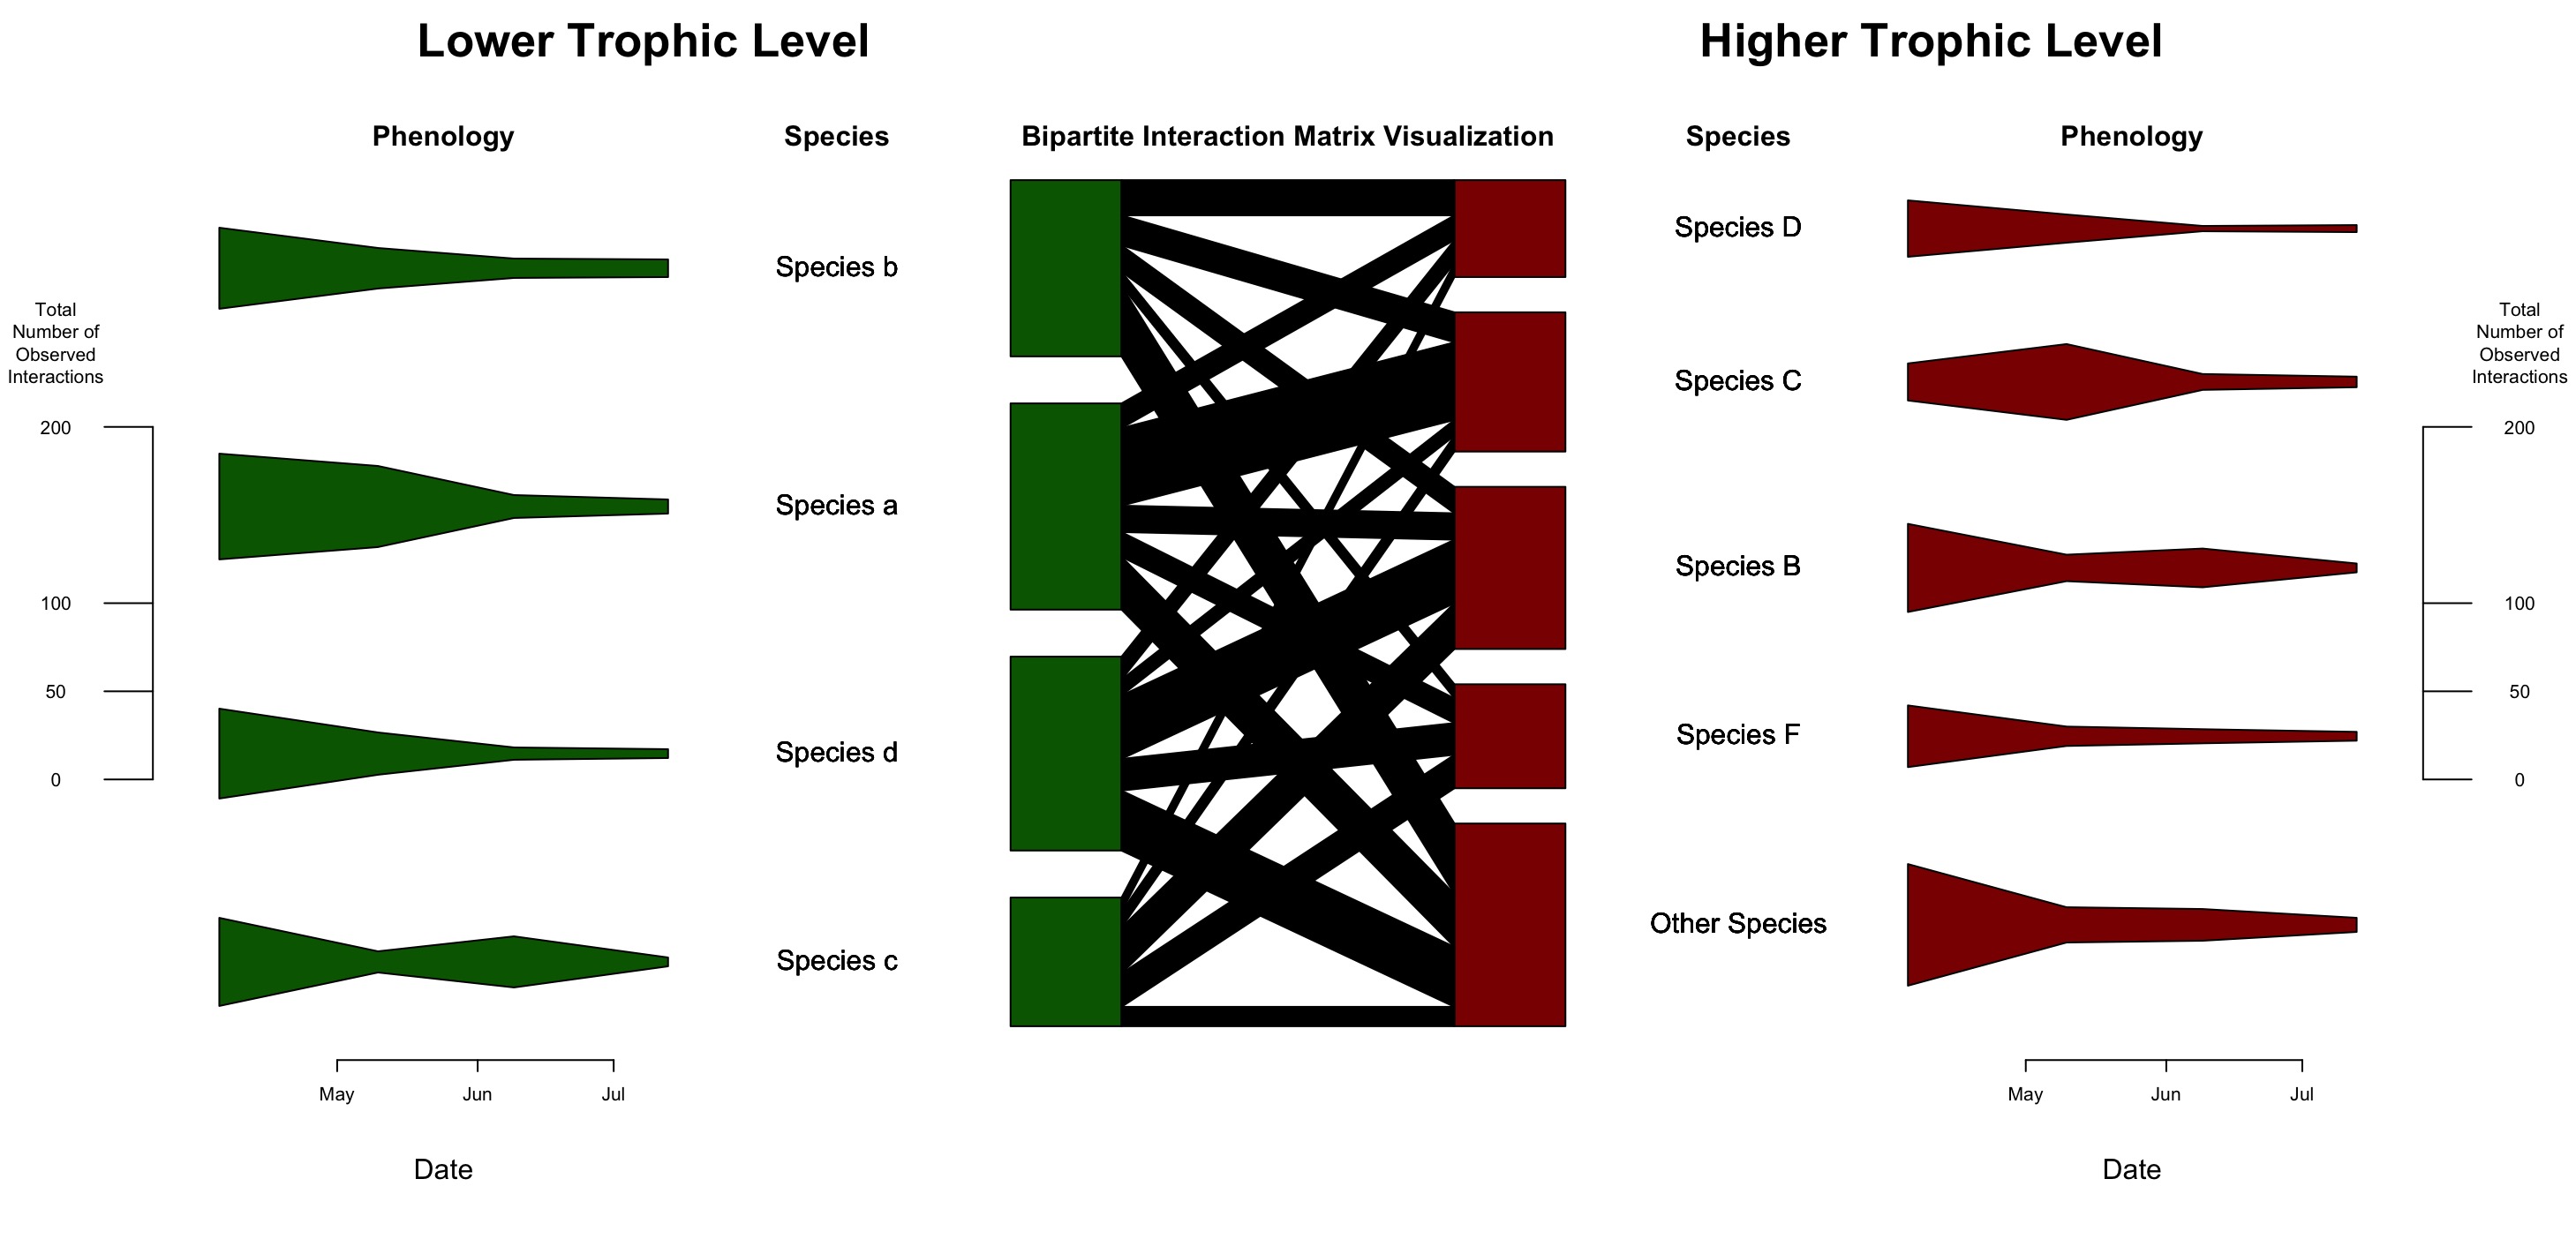
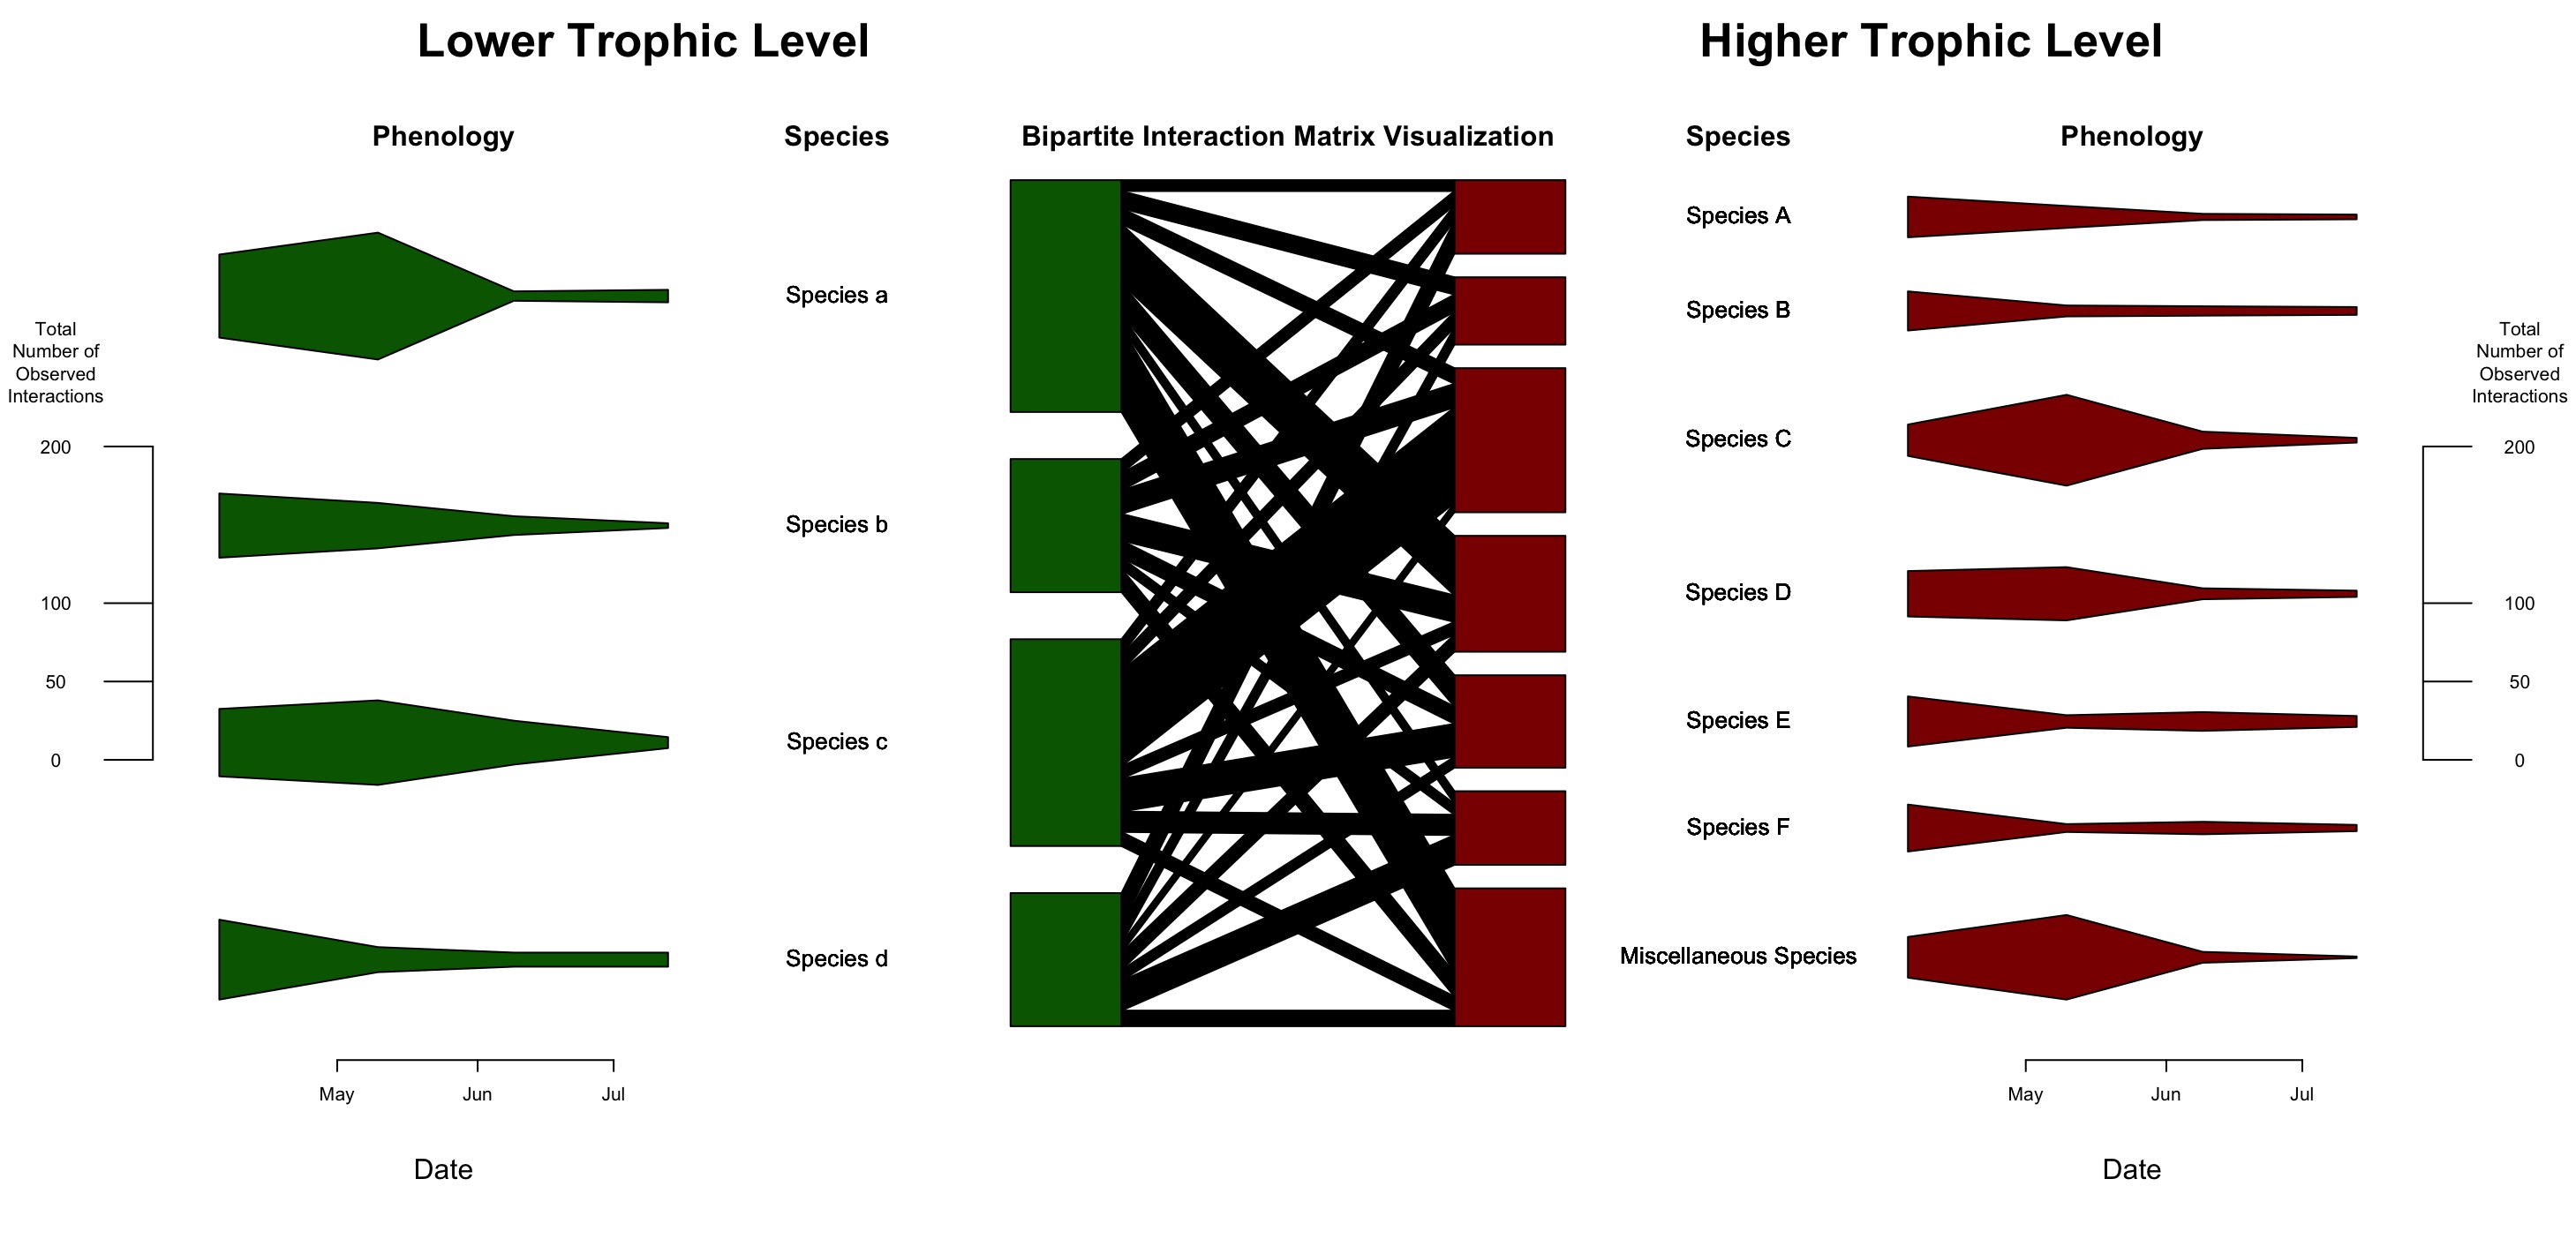
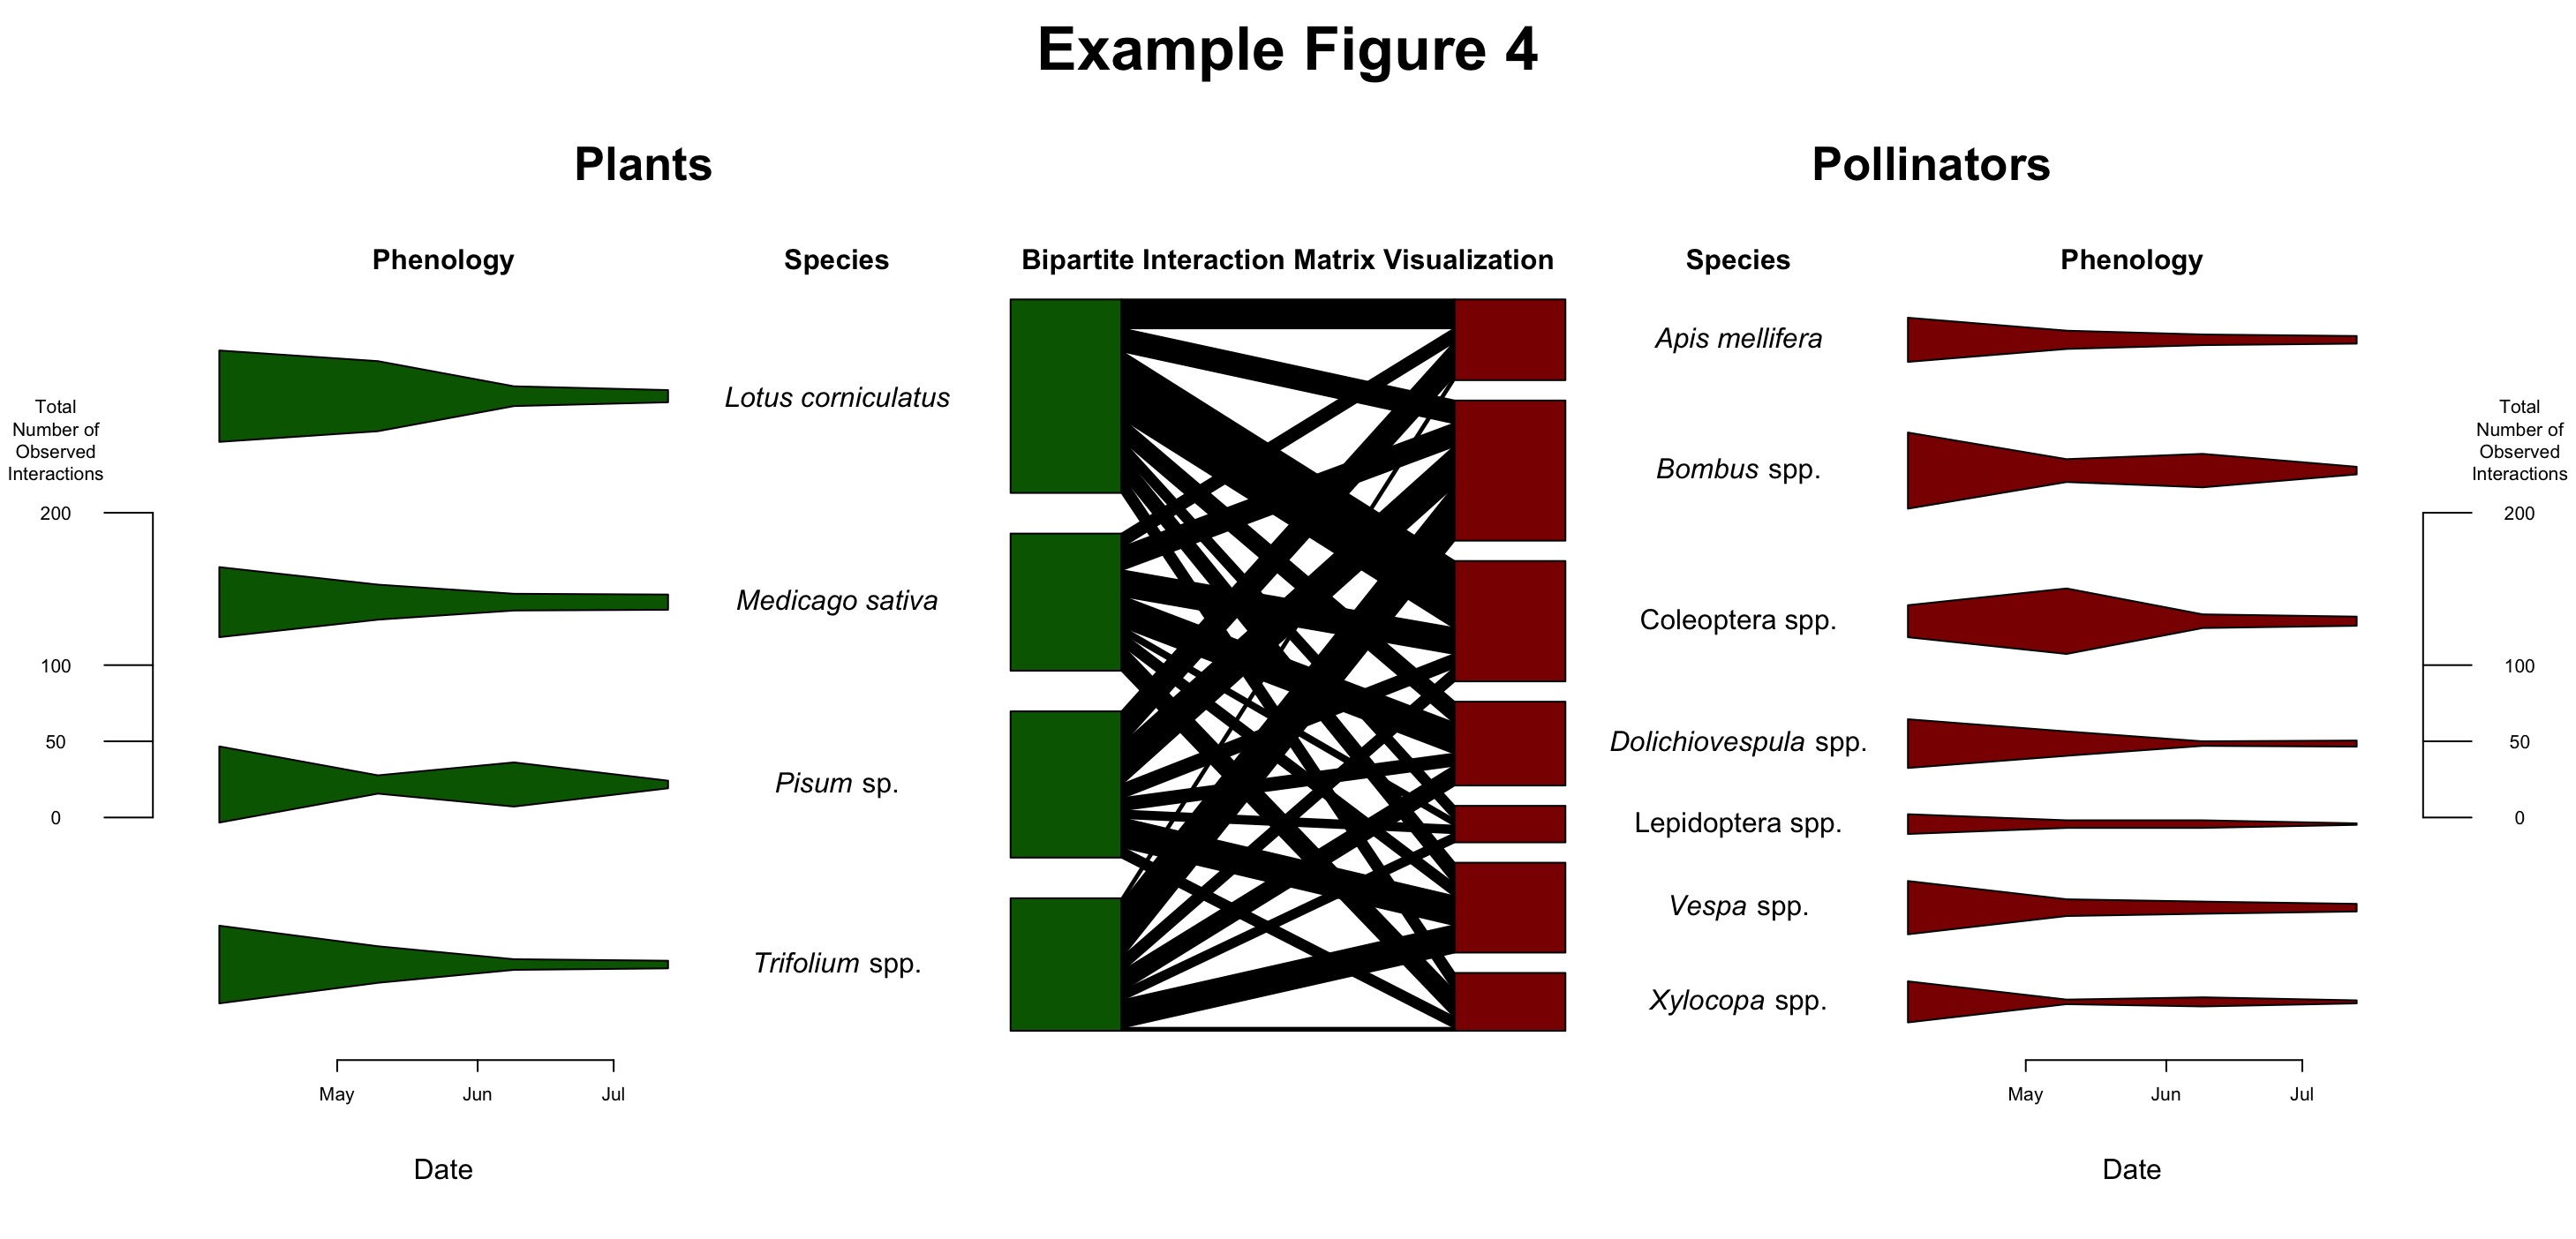
The function Generating_Figures_Containing_a_Bipartite_Interaction_Matrix_Visualization_Plot_and_Corresponding_Upper_and_Lower_Trophic_Level_Phenology_Plots generates violin-like phenology plots that depict the relative abundances of lower-trophic-level and higher-trophic-level species over time. It also generates bipartite interaction matrix visualization plots which are positioned centrally between the two sets of phenology plots. Here, here, here, and here are figures created using made-up data with this function. This function was heavily inspired by a manuscript that contained a figure very similar to the one this function returns (Russo et al., 2013), and it was also heavily inspired by my good friend Isaac Ativor's work.
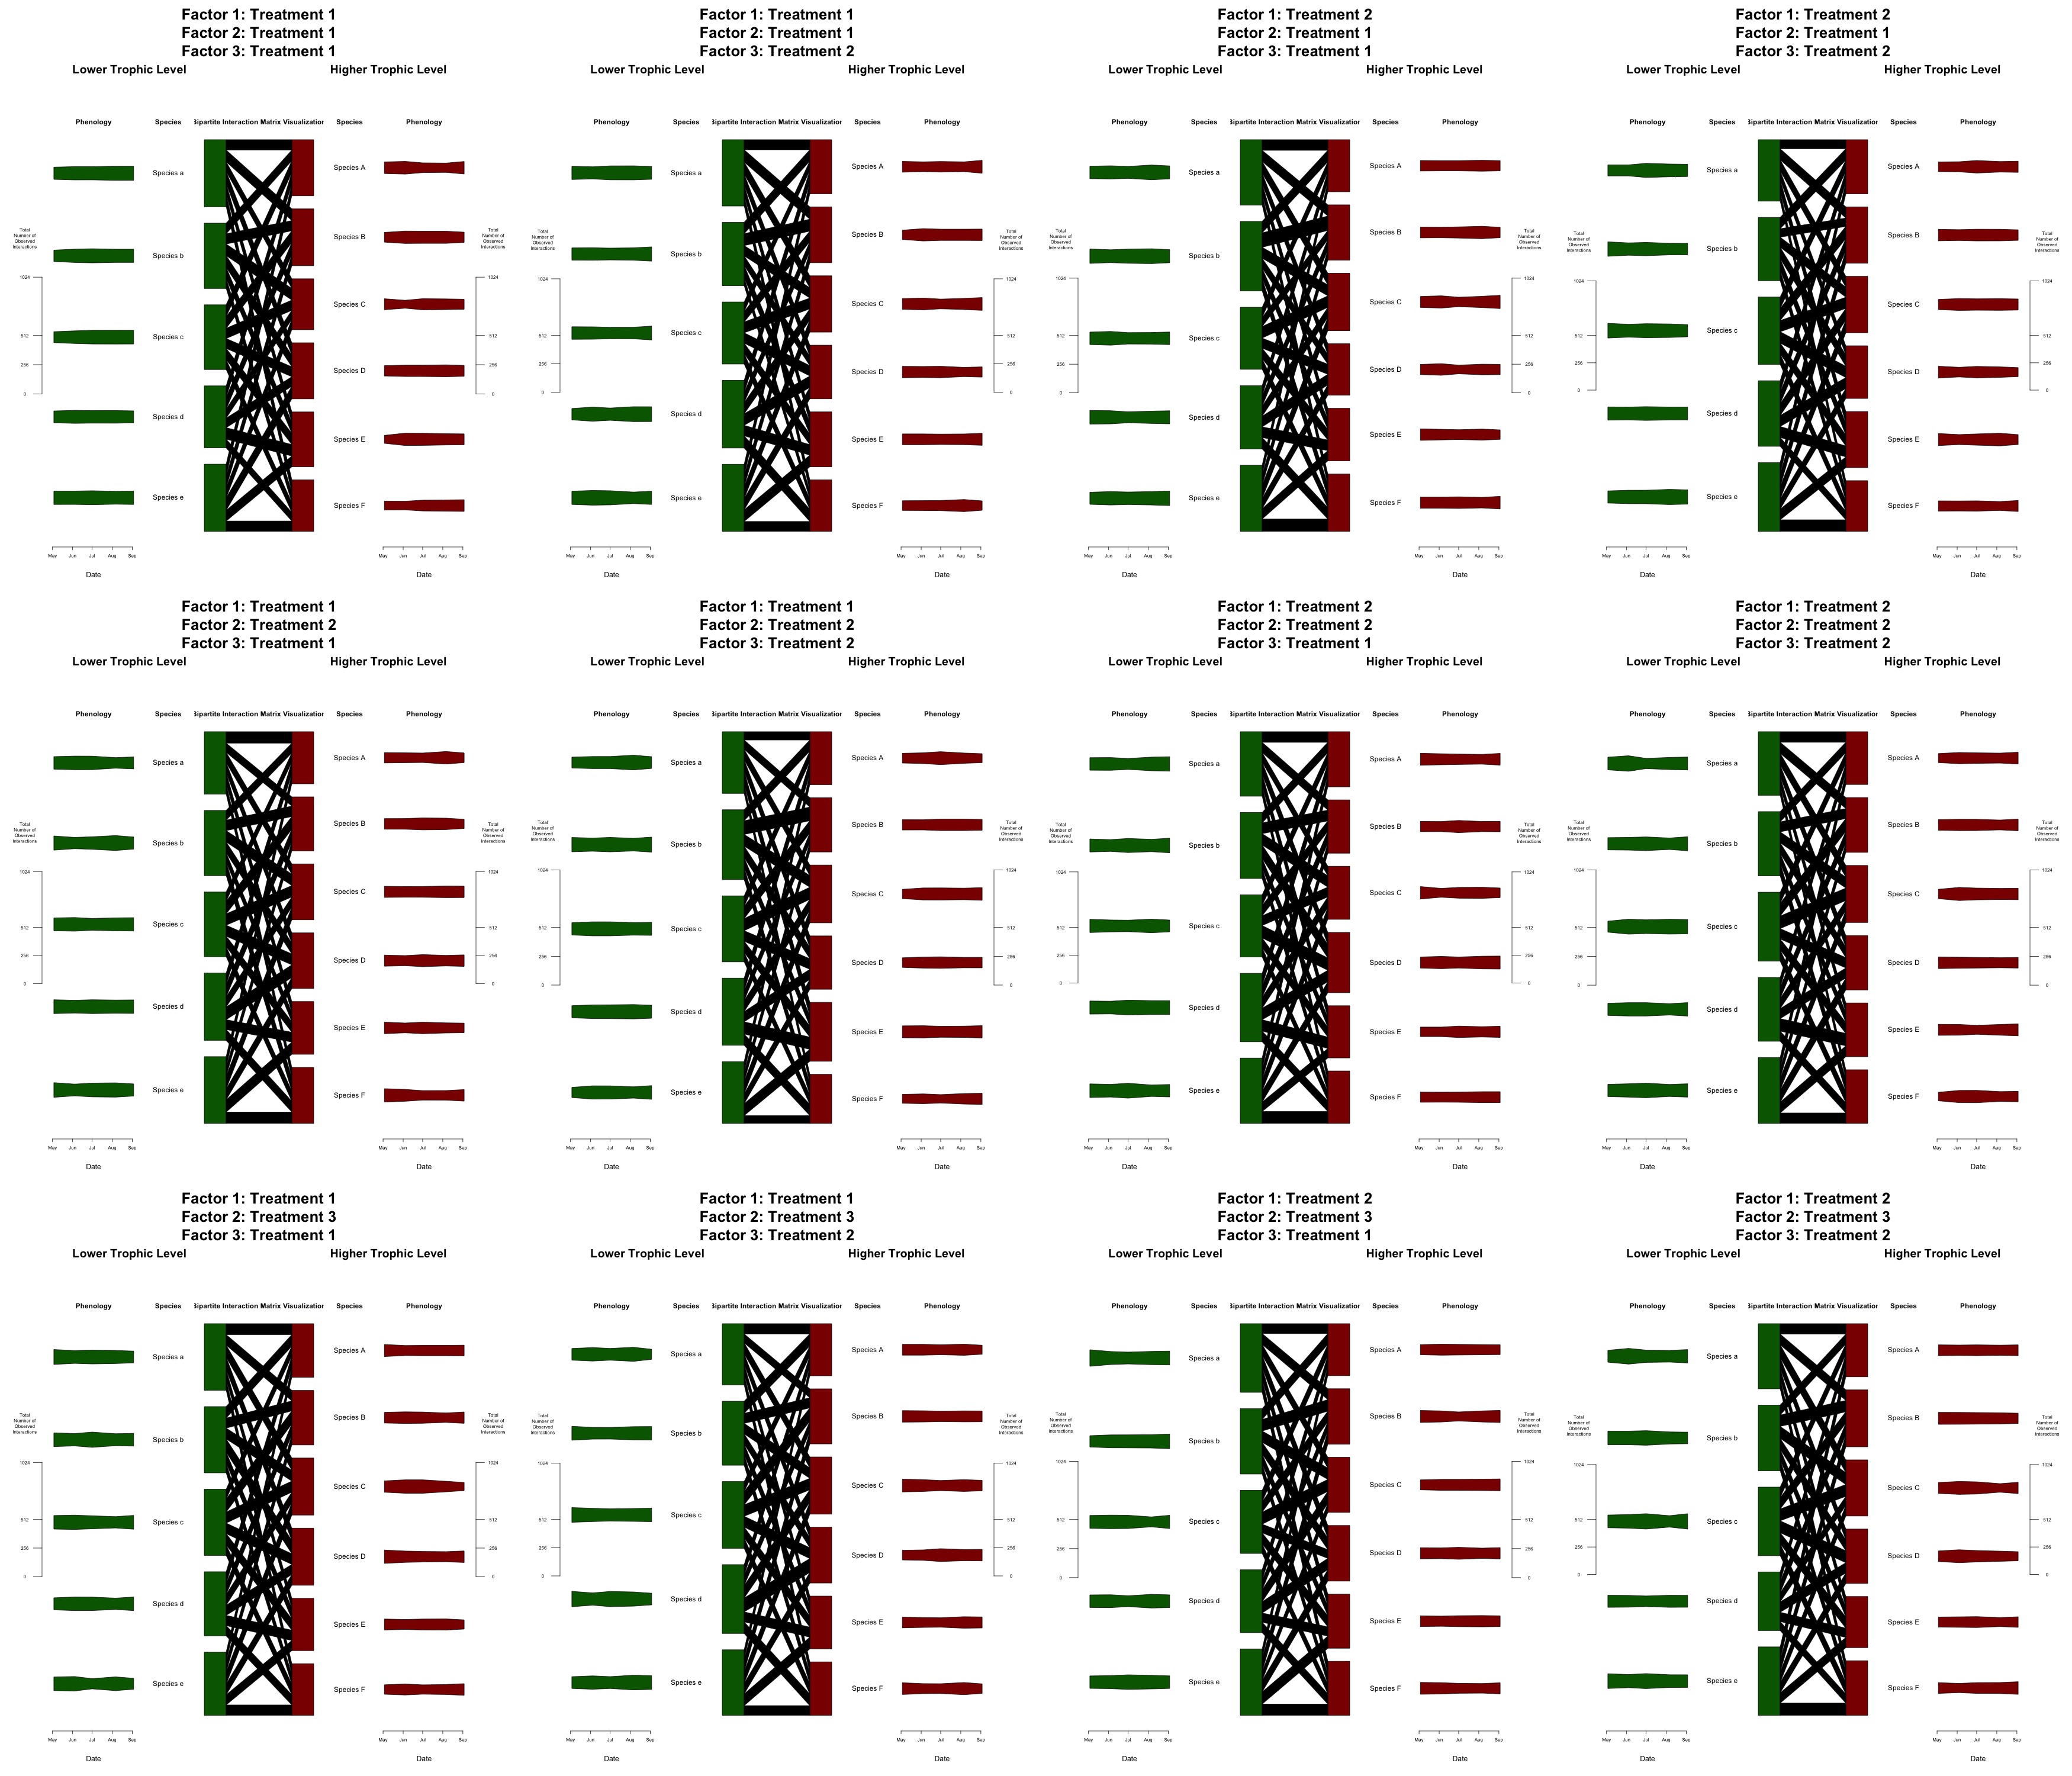
The function Generating_Figures_Containing_a_Bipartite_Interaction_Matrix_Visualization_Plot_and_Corresponding_Higher_and_Lower_Trophic_Level_Phenology_Plots_by_Factors generates violin-like phenology plots that depict the relative abundances of lower-trophic-level and higher-trophic-level species over time. It also generates bipartite interaction matrix visualization plots which are positioned centrally between the two sets of phenology plots, with the lower-trophic-level information on the left and the higher-trophic-level information on the right. Unlike the Generating_Figures_Containing_a_Bipartite_Interaction_Matrix_Visualization_Plot_and_Corresponding_Higher_and_Lower_Trophic_Level_Phenology_Plots function in this package, which can only create one of these figures at a time, this function splits a balanced data set up by one or more factors and then arranges figures for each factor or combination of factors nicely. This function requires perfectly balanced experimental designs - for multifactorial experimental designs, all of the levels of each factor must be perfectly crossed with all of the levels of the other factors. Here is a figure that shows what this function is capable of doing. This function was heavily inspired by a manuscript that contained a figure very similar to the one this function returns (Russo et al., 2013), and it was also heavily inspired by my good friend Isaac Ativor's work.
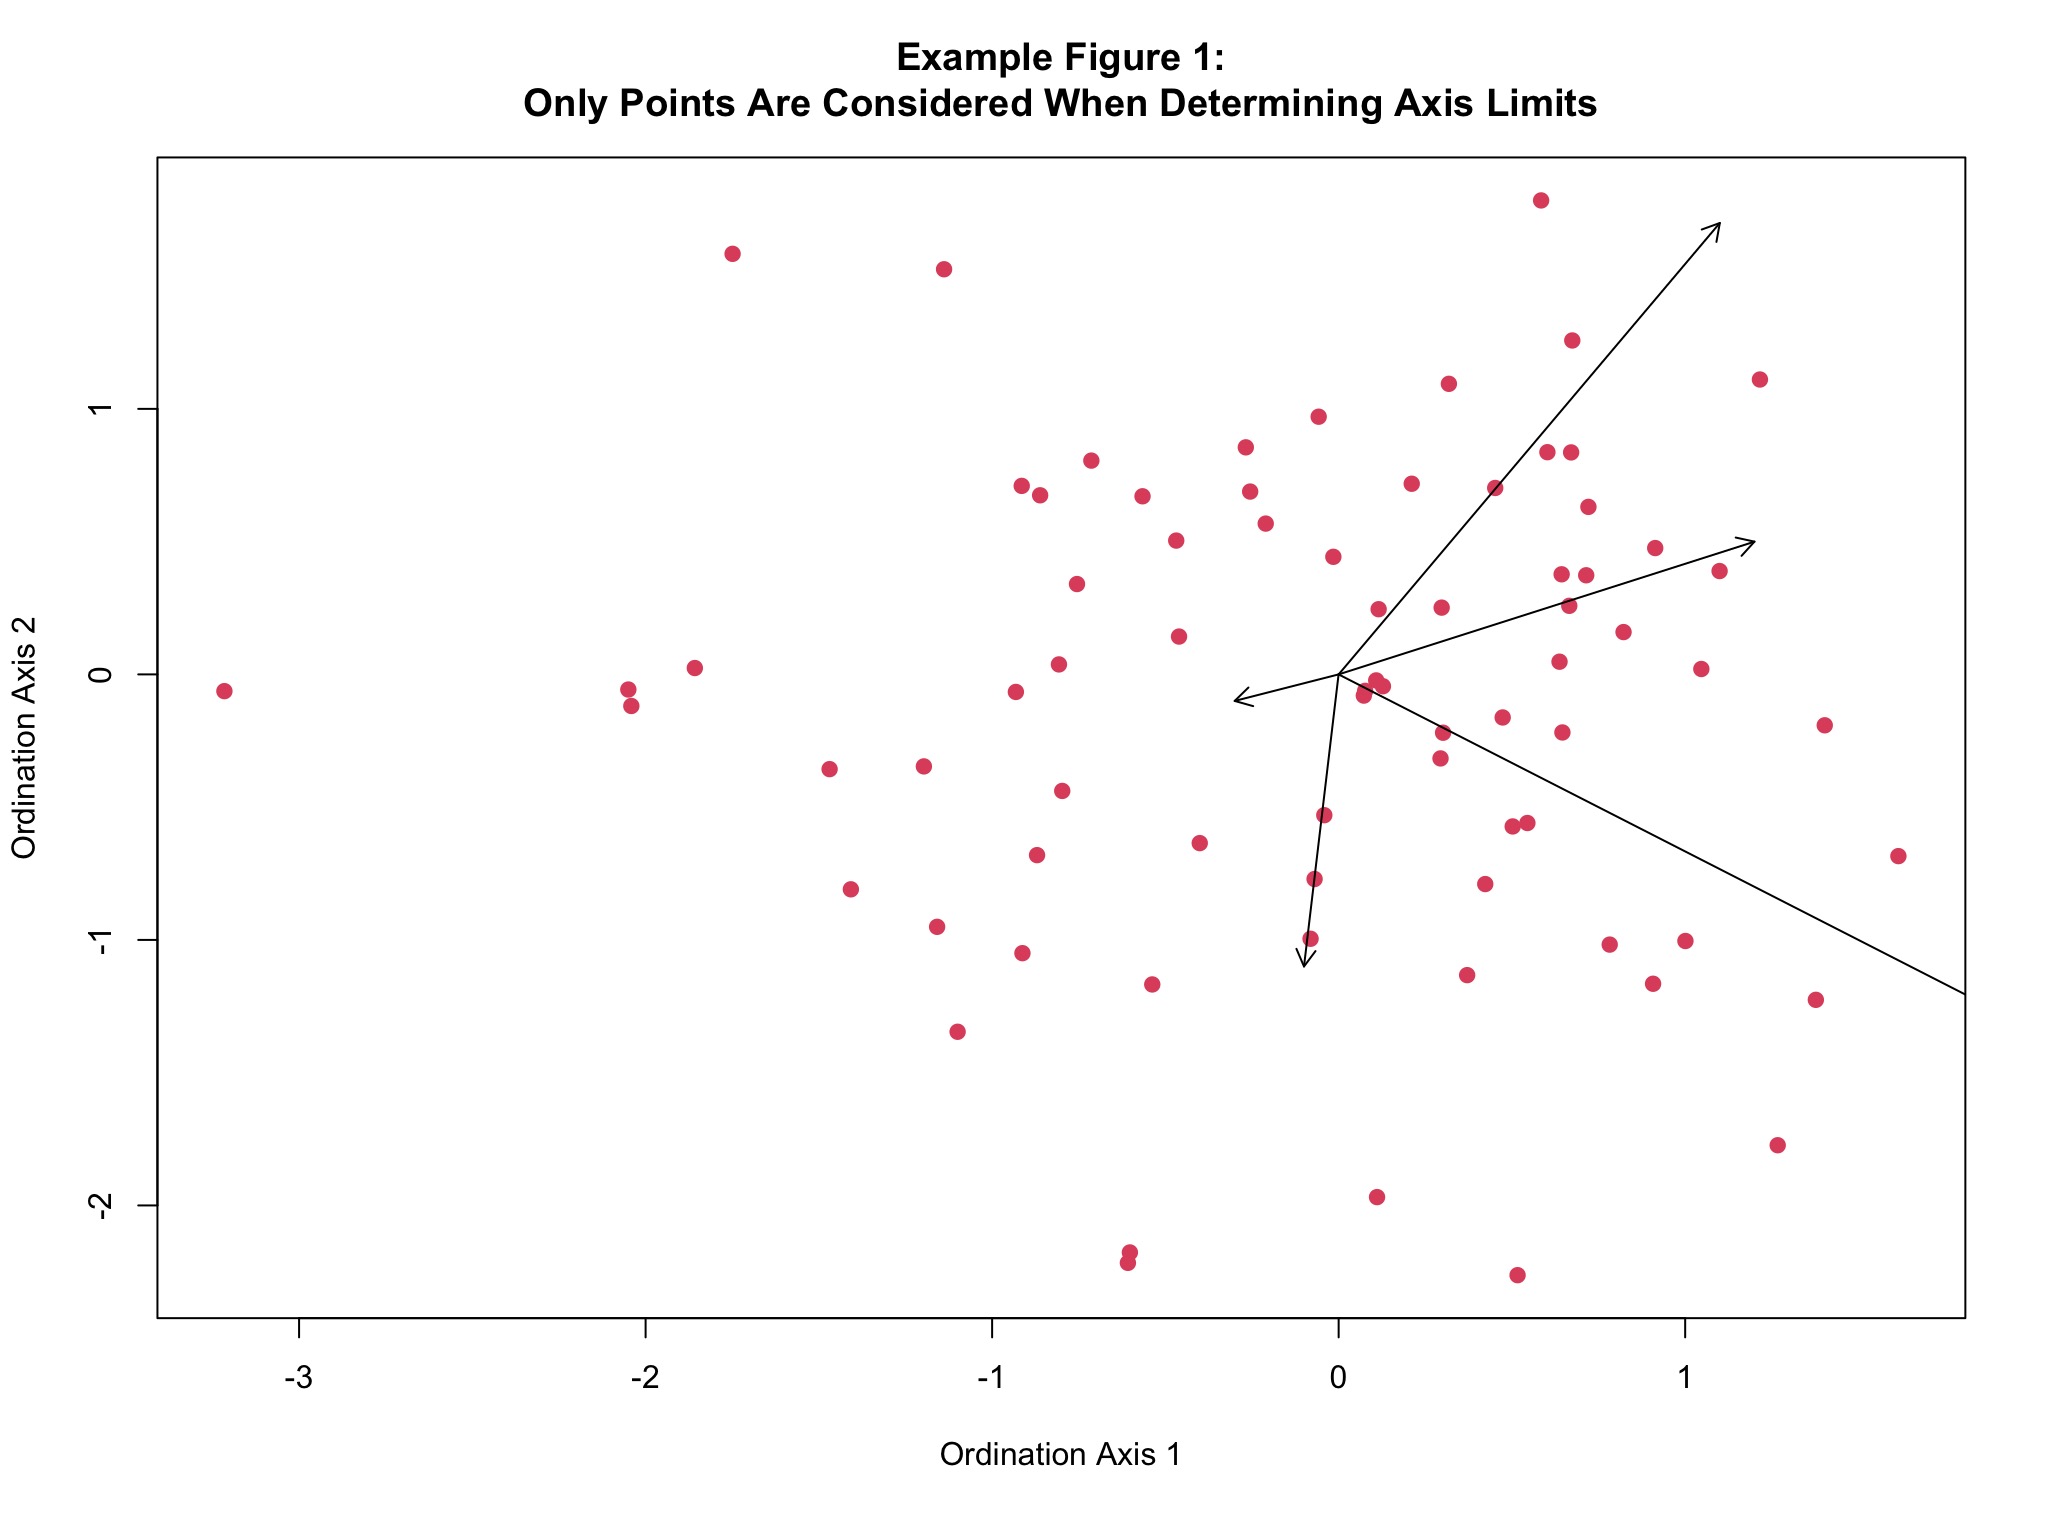
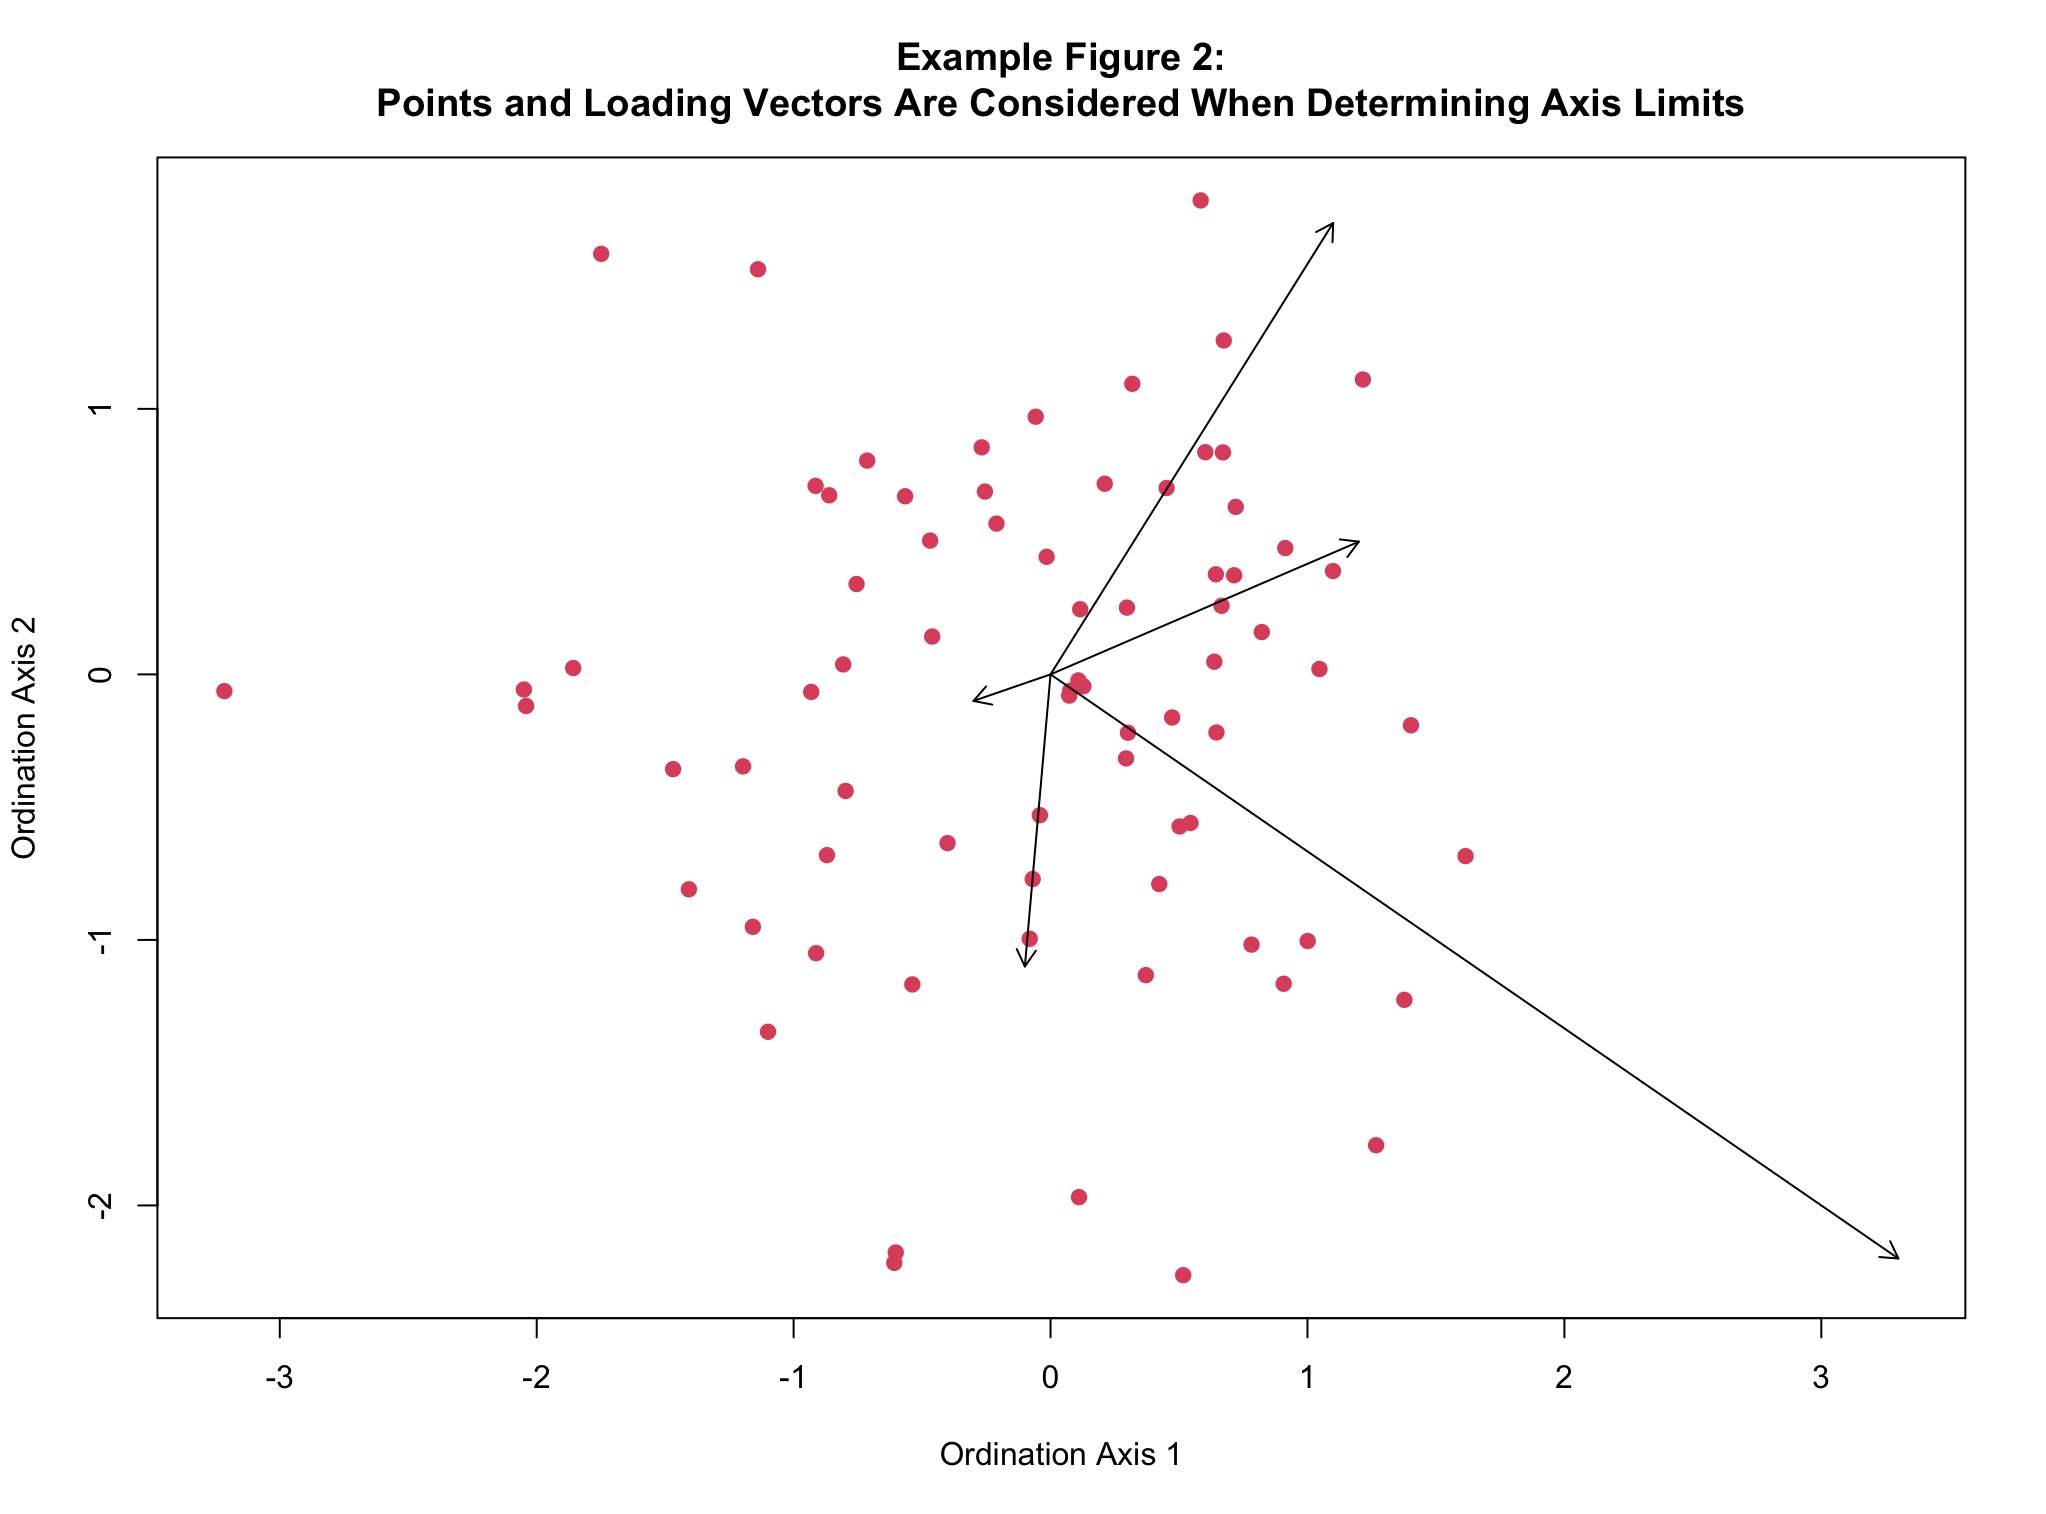
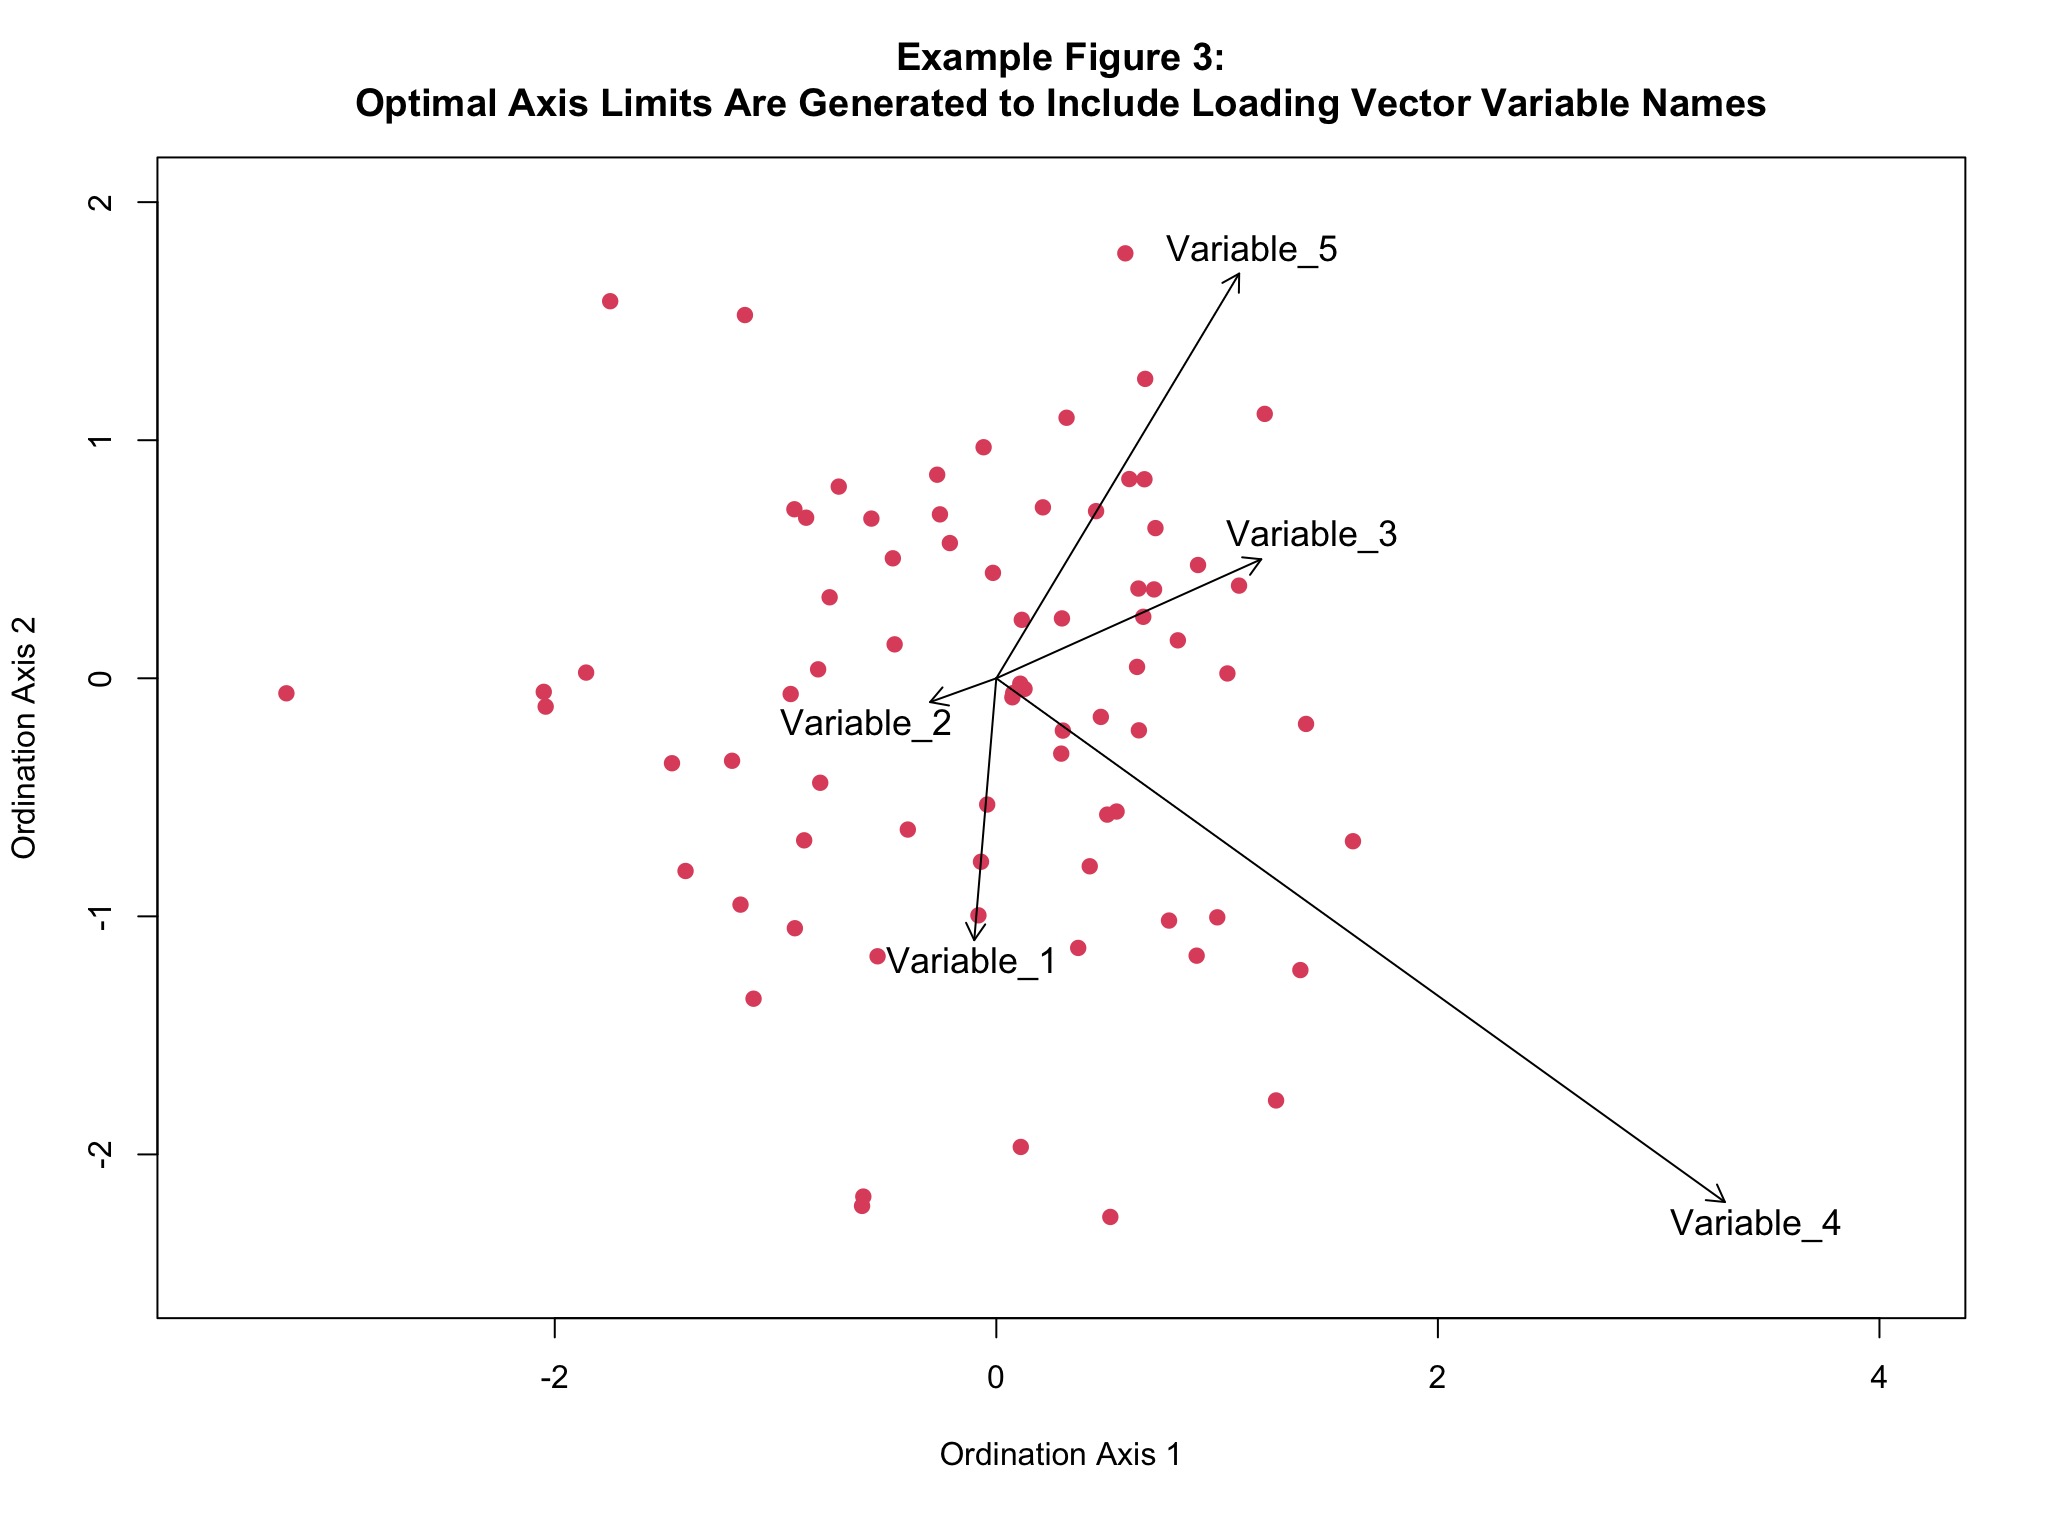
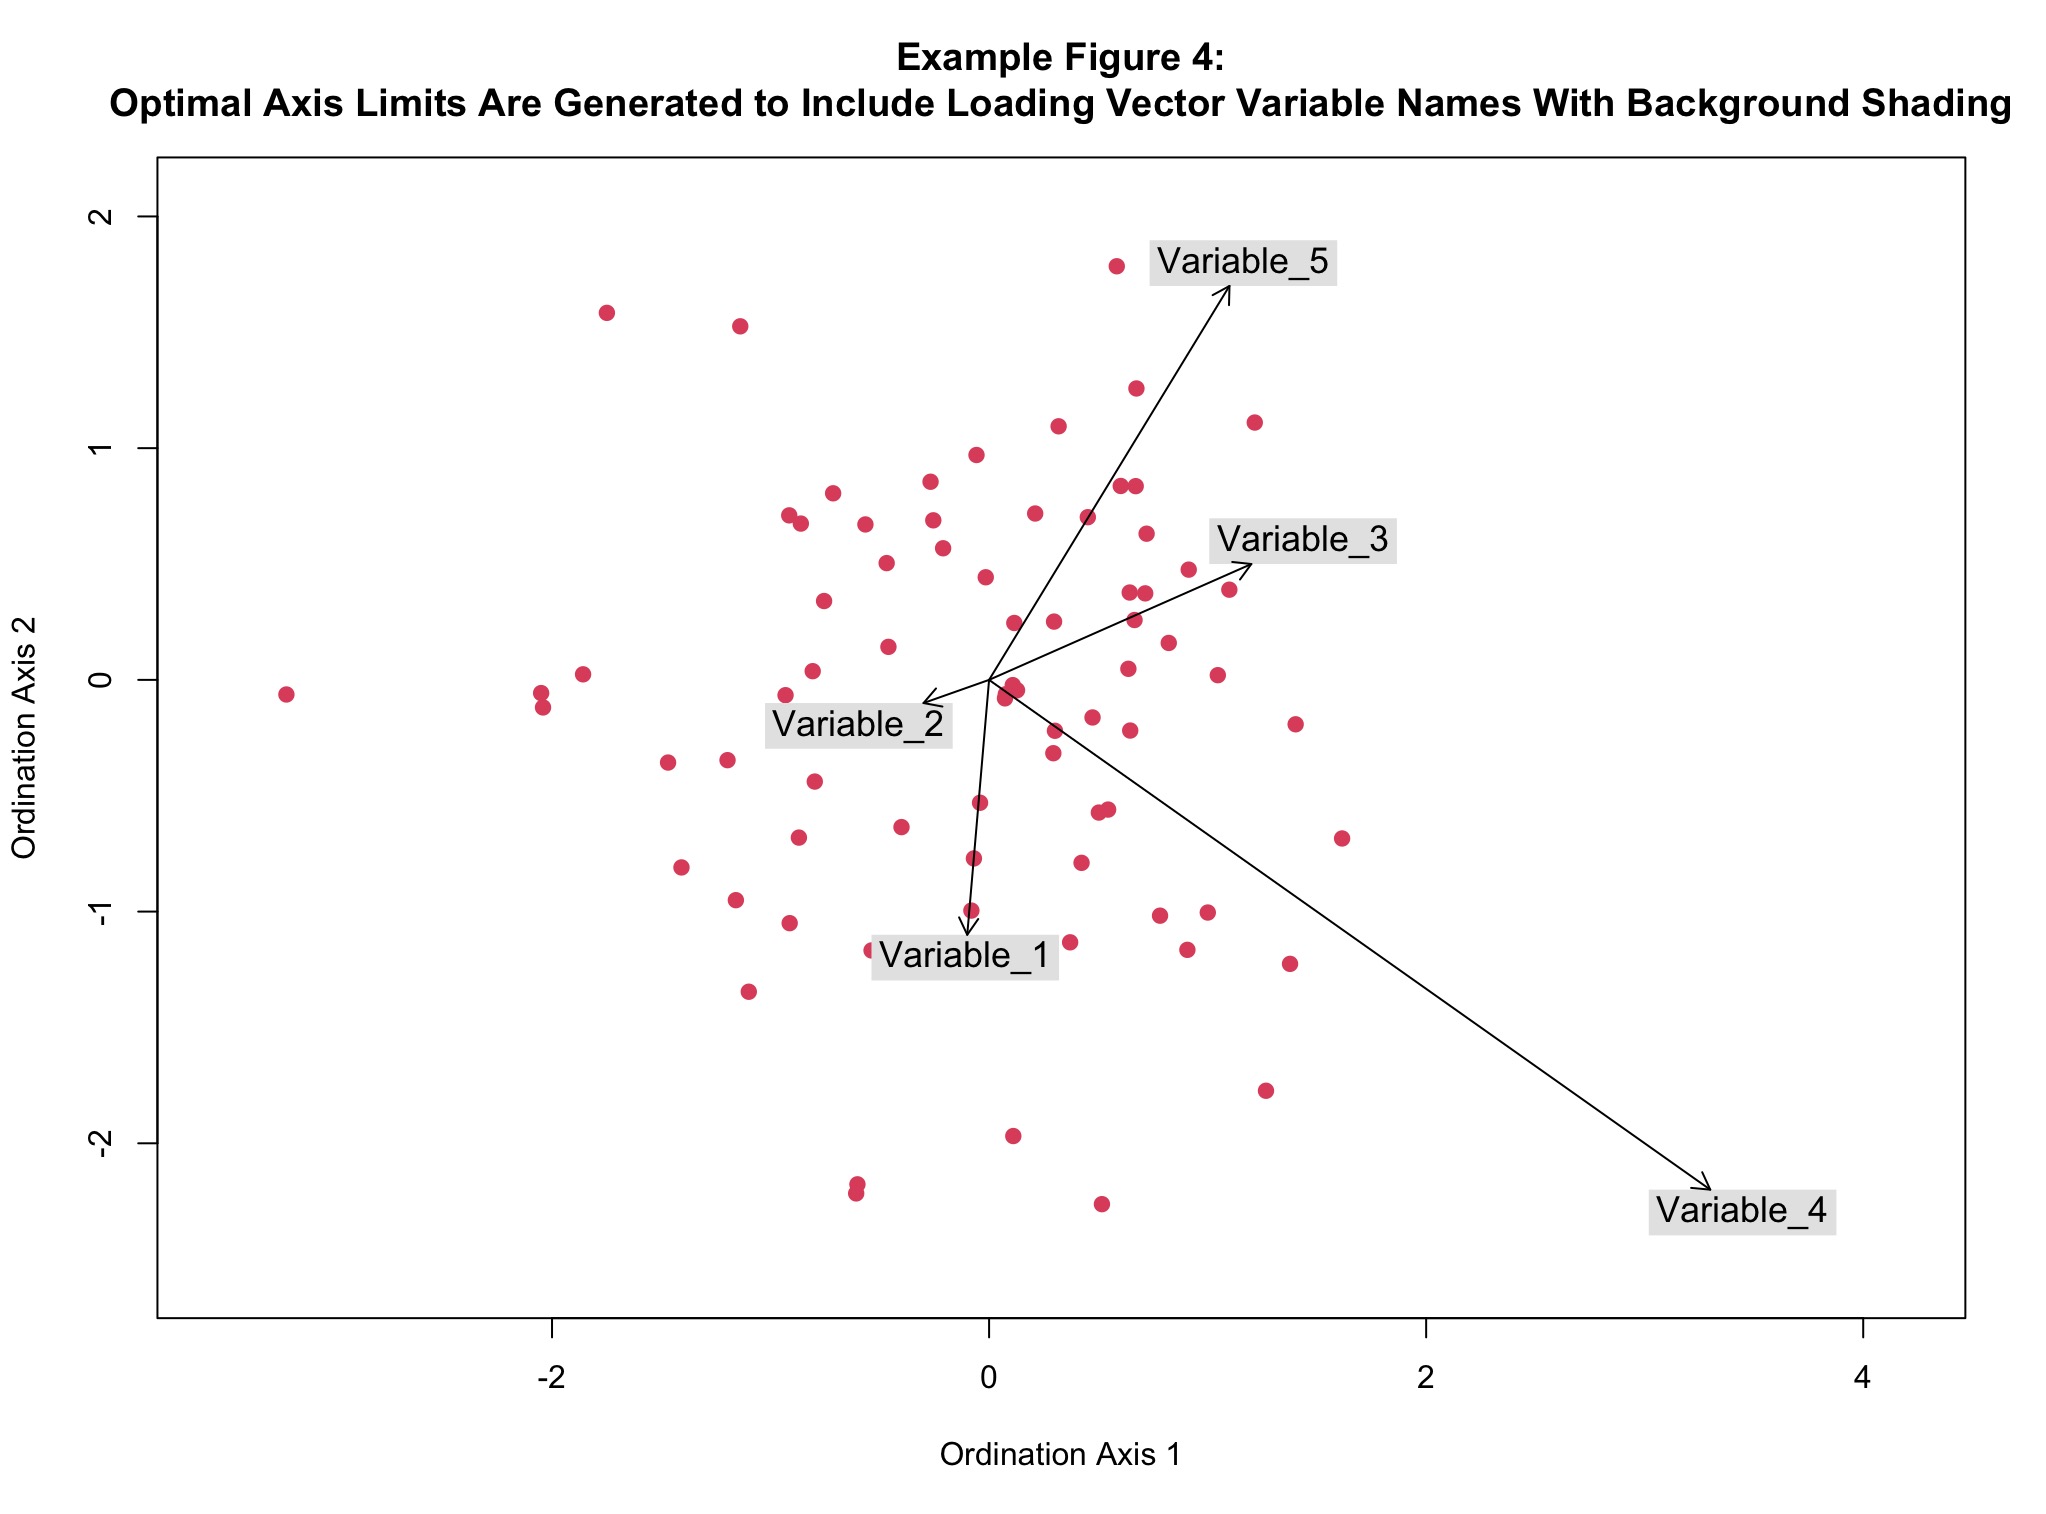
The function Generating_Optimal_Axis_Limits_for_Figures_With_Text_Boxes may be used to generate axis limits for plots when both text and points (or vectors) are present. It was developed for ordinations (such as principal components analysis or non-metric multidimensional scaling) when data points are plotted alongside loadings vectors and when these loadings vectors are identified with text on the plot. This function optimizes the plotting region - all points (and vectors, if vectors are present) and text are visible, and there is no extra, wasted space near the outside of the plotting region. Here, here, here, and here are examples of plots that illustrate how this function works (in the first two plots, which were made without the use of this function, loading vector names would fall at least partly outside of the plotting region).
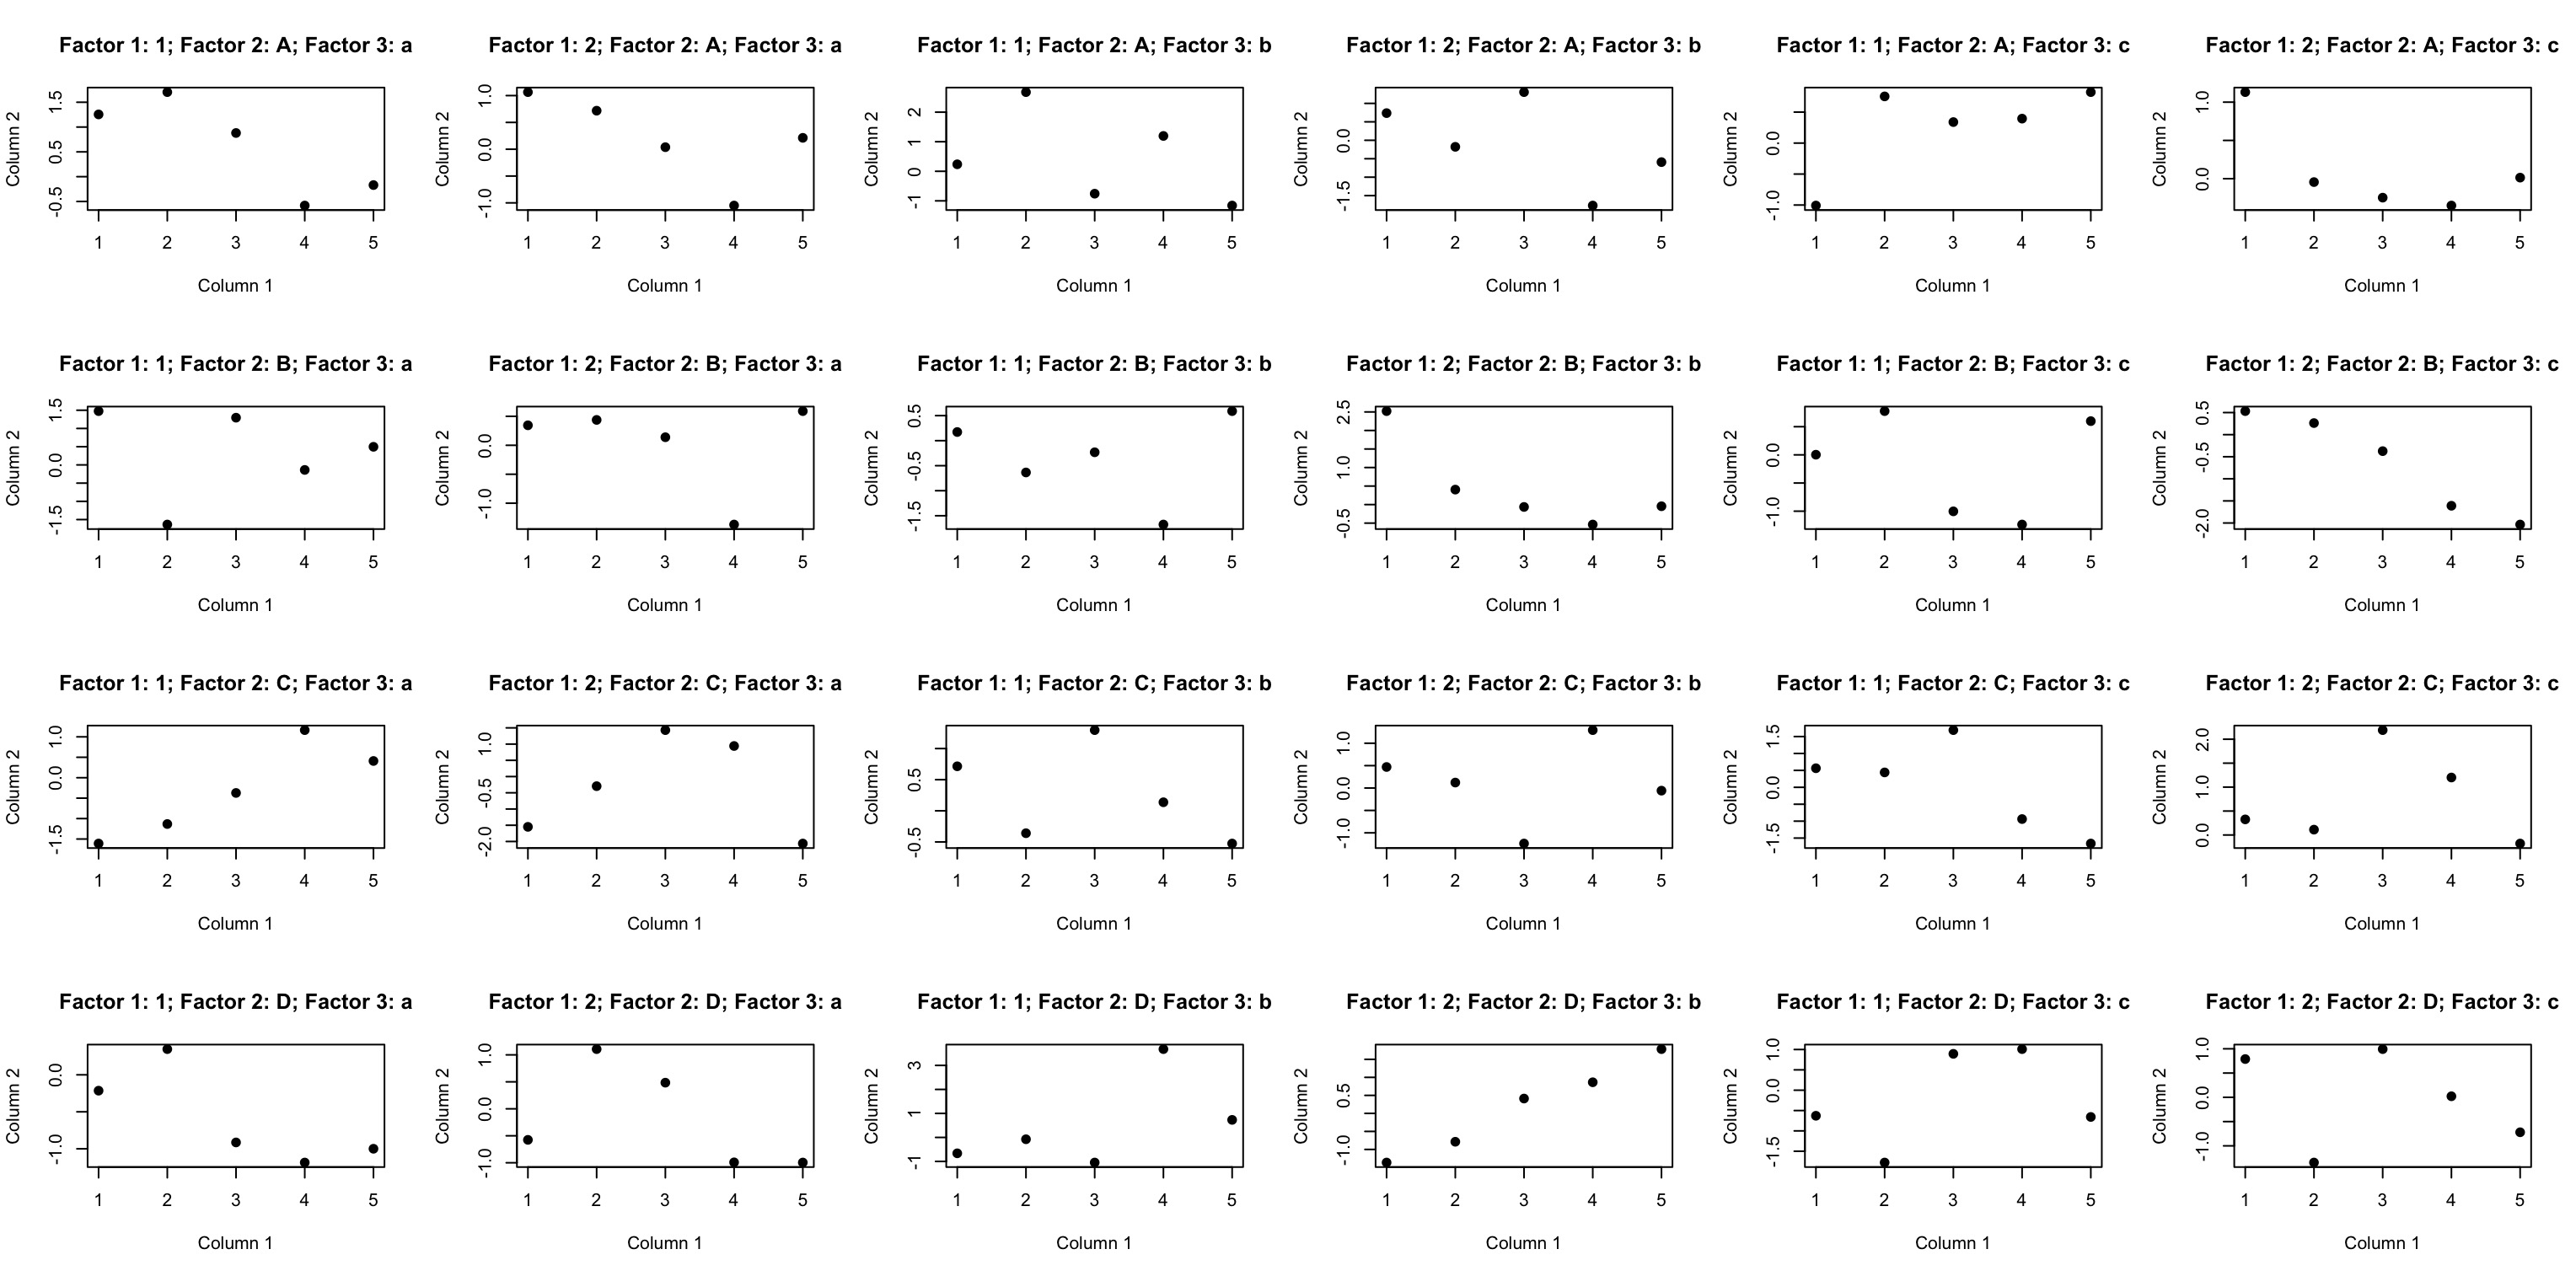
The function Generating_Overall_Plot_Layout_Matrices may be used to create plotting layout matrices when data are split up by more than one factor. The plotting layout matrices generated by this function create highly organized and ordered plot arrangements where plots are first grouped by levels of the first factor, then by levels of the sescond factor, then by levels of the third factor, and so on and so forth. The levels of the first factor are placed in separate columns. If a second factor is present, the levels of this second factor are placed in separate rows. If a third factor is present, these matrices containing the first and second factors are then themselves replicated and placed side by side (horizontally). If a fourth factor is present, these matrices containing the first, second, and third factors are then themselves replicated and placed on top of each other (vertically). If a fifth factor is present, these matrices containing the first, second, third, and fourth factors are then themselves replicated and placed side by side (horizontally). If a sixth factor is present, these matrices containing the first, second, third, fourth, and fifth factors are then themselves replicated and placed on top of each other (vertically). This process continues until all of the factors of interest have been accounted for. Factors must be balanced for this function to work - in other words, each level of each factor must appear with every level of every other factor. It's used in the Generating_Figures_Containing_a_Bipartite_Interaction_Matrix_Visualization_Plot_and_Corresponding_Higher_and_Lower_Trophic_Level_Phenology_Plots_by_Factors function in this package. Here is an example figure that shows what this function does - it depicts the case when there are three factors (in this case, the first factor has 2 levels, the second factor has 4 levels, and the third factor has 3 levels).
The function Generating_Permutations generates all possible permutations for a given number of items.
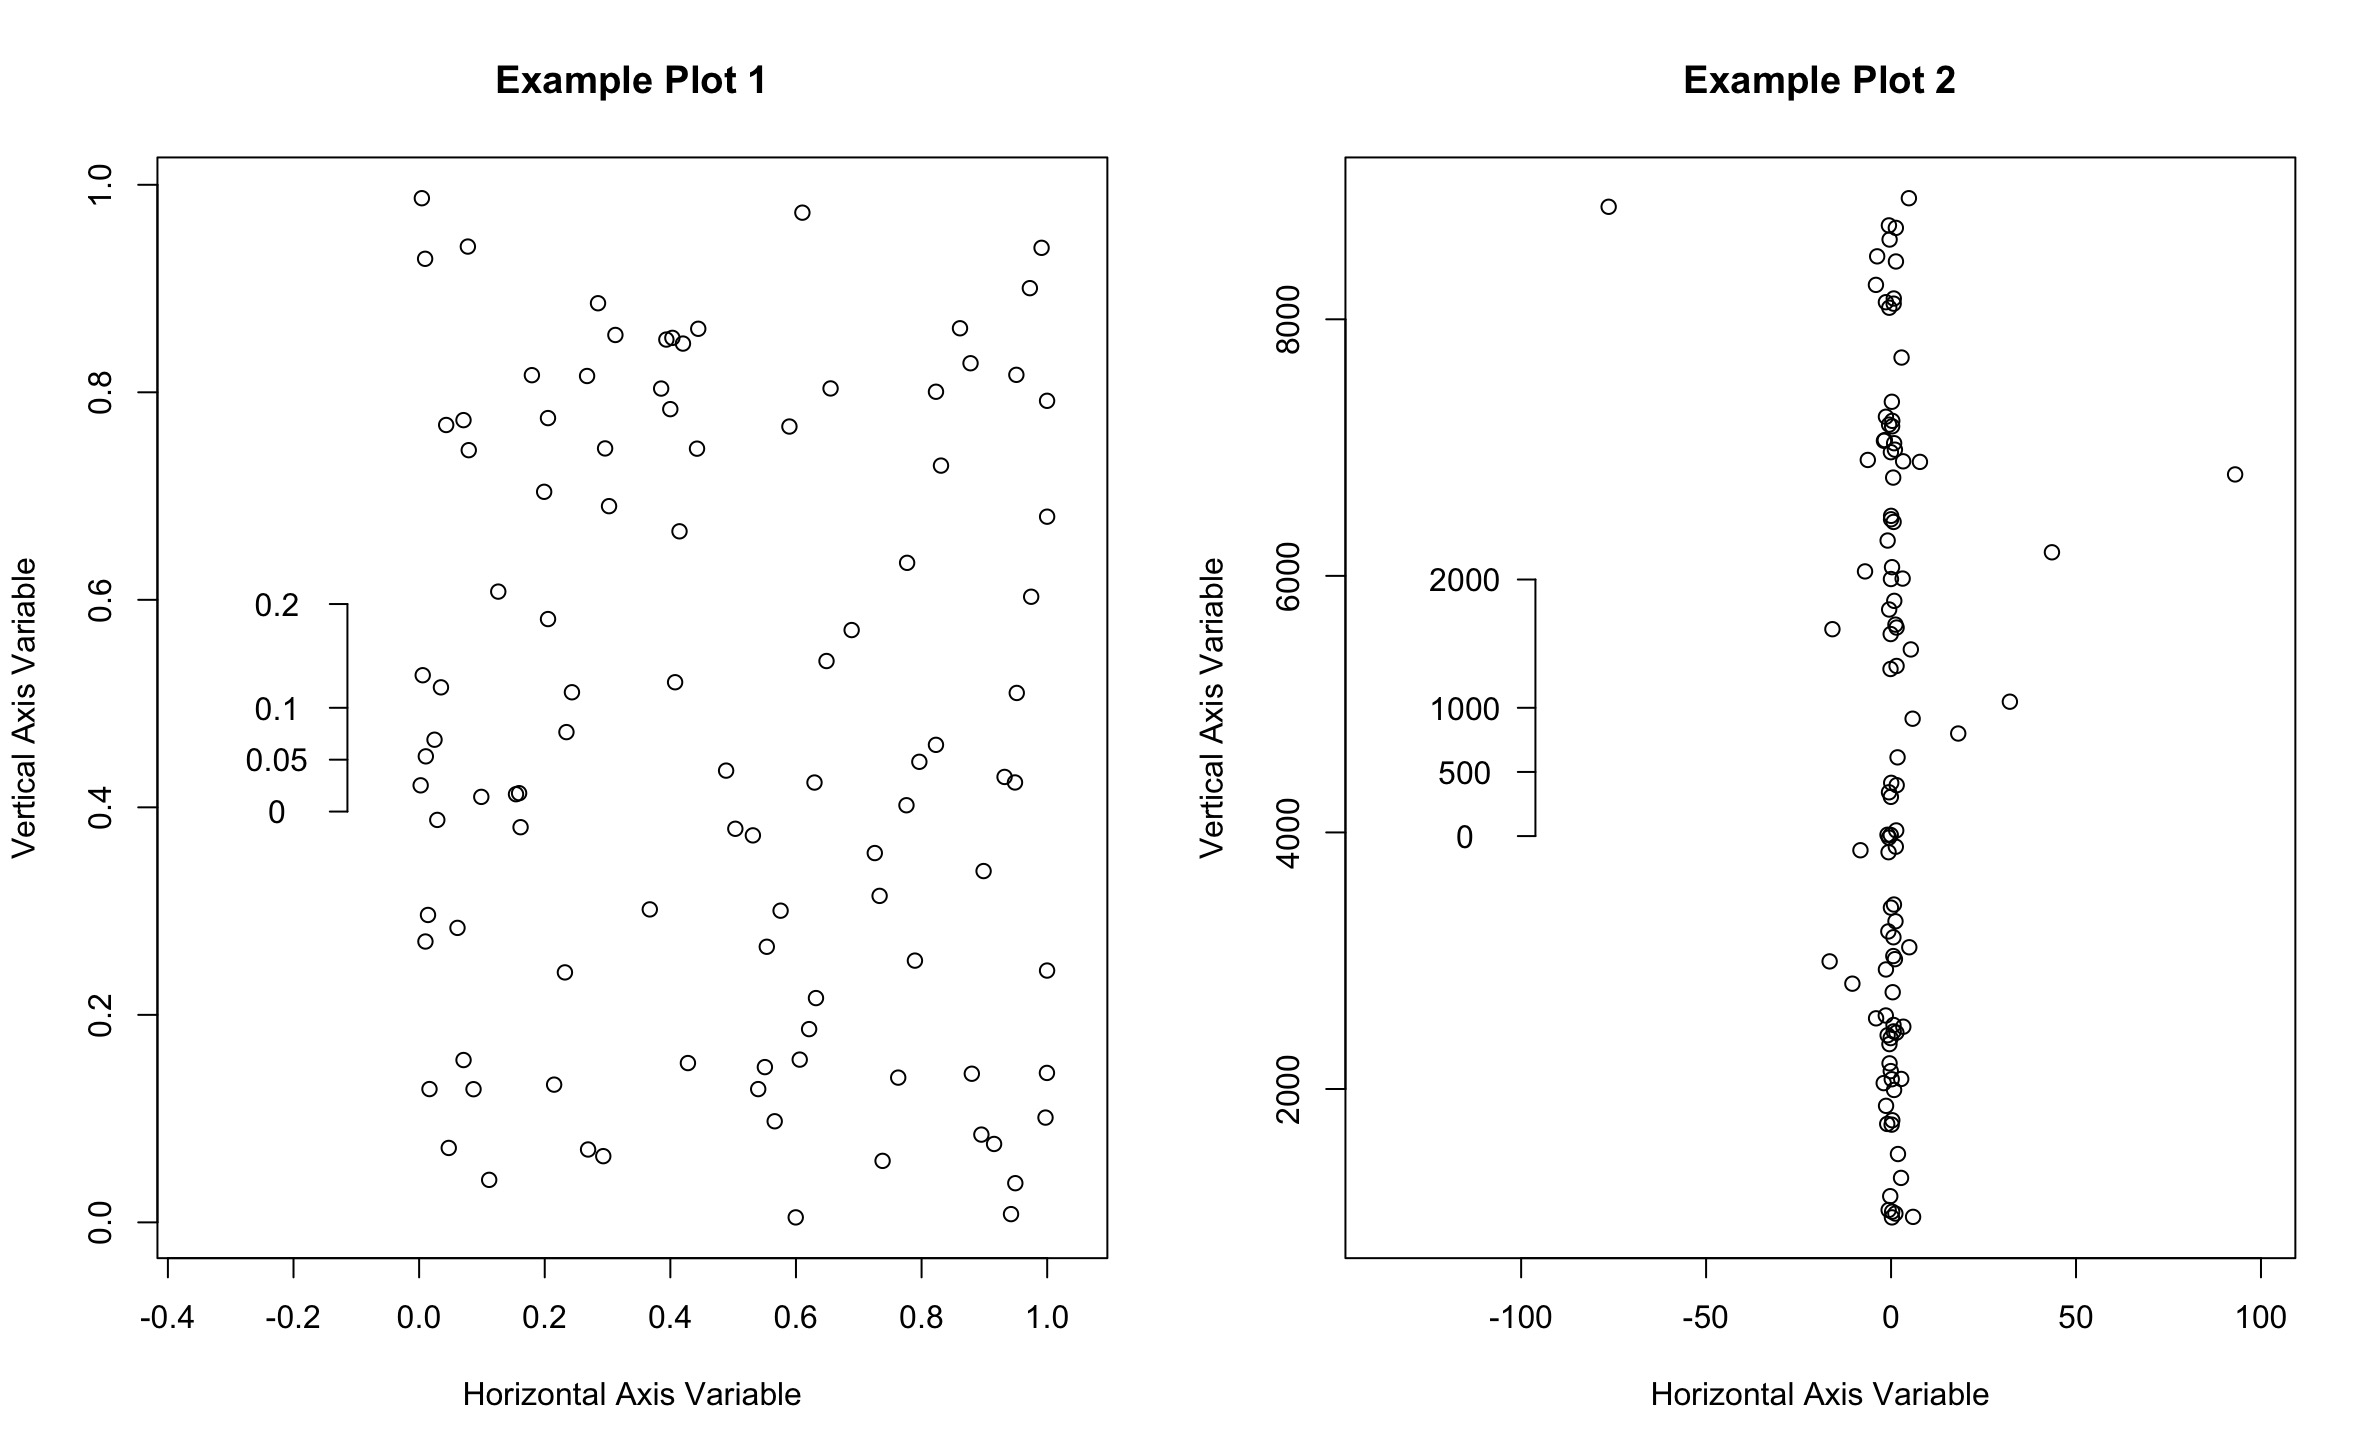
The function Making_Reasonable_Scale_Bars generates nice round numbers for scale bars using a slick trick: the logarithm of one or more specified bases (2, 5, and 10 are good choices) of a given proportion of the plotting area (such as 20 %, as defined by the Scale_Bar_Factor argument) is calculated, and then rounded (using the floor() and ceiling() functions) to the nearest integer, and then each specified base is raised to these corresponding round numbers. This process produces nice, round numbers for scale bars which are based on powers of the specified bases. The possibility that this algorithm finds that's closest to the originally given proportion of the plotting area (the Scale_Bar_Factor argument) will be chosen as the final scale bar. Here is an example of what this function does.
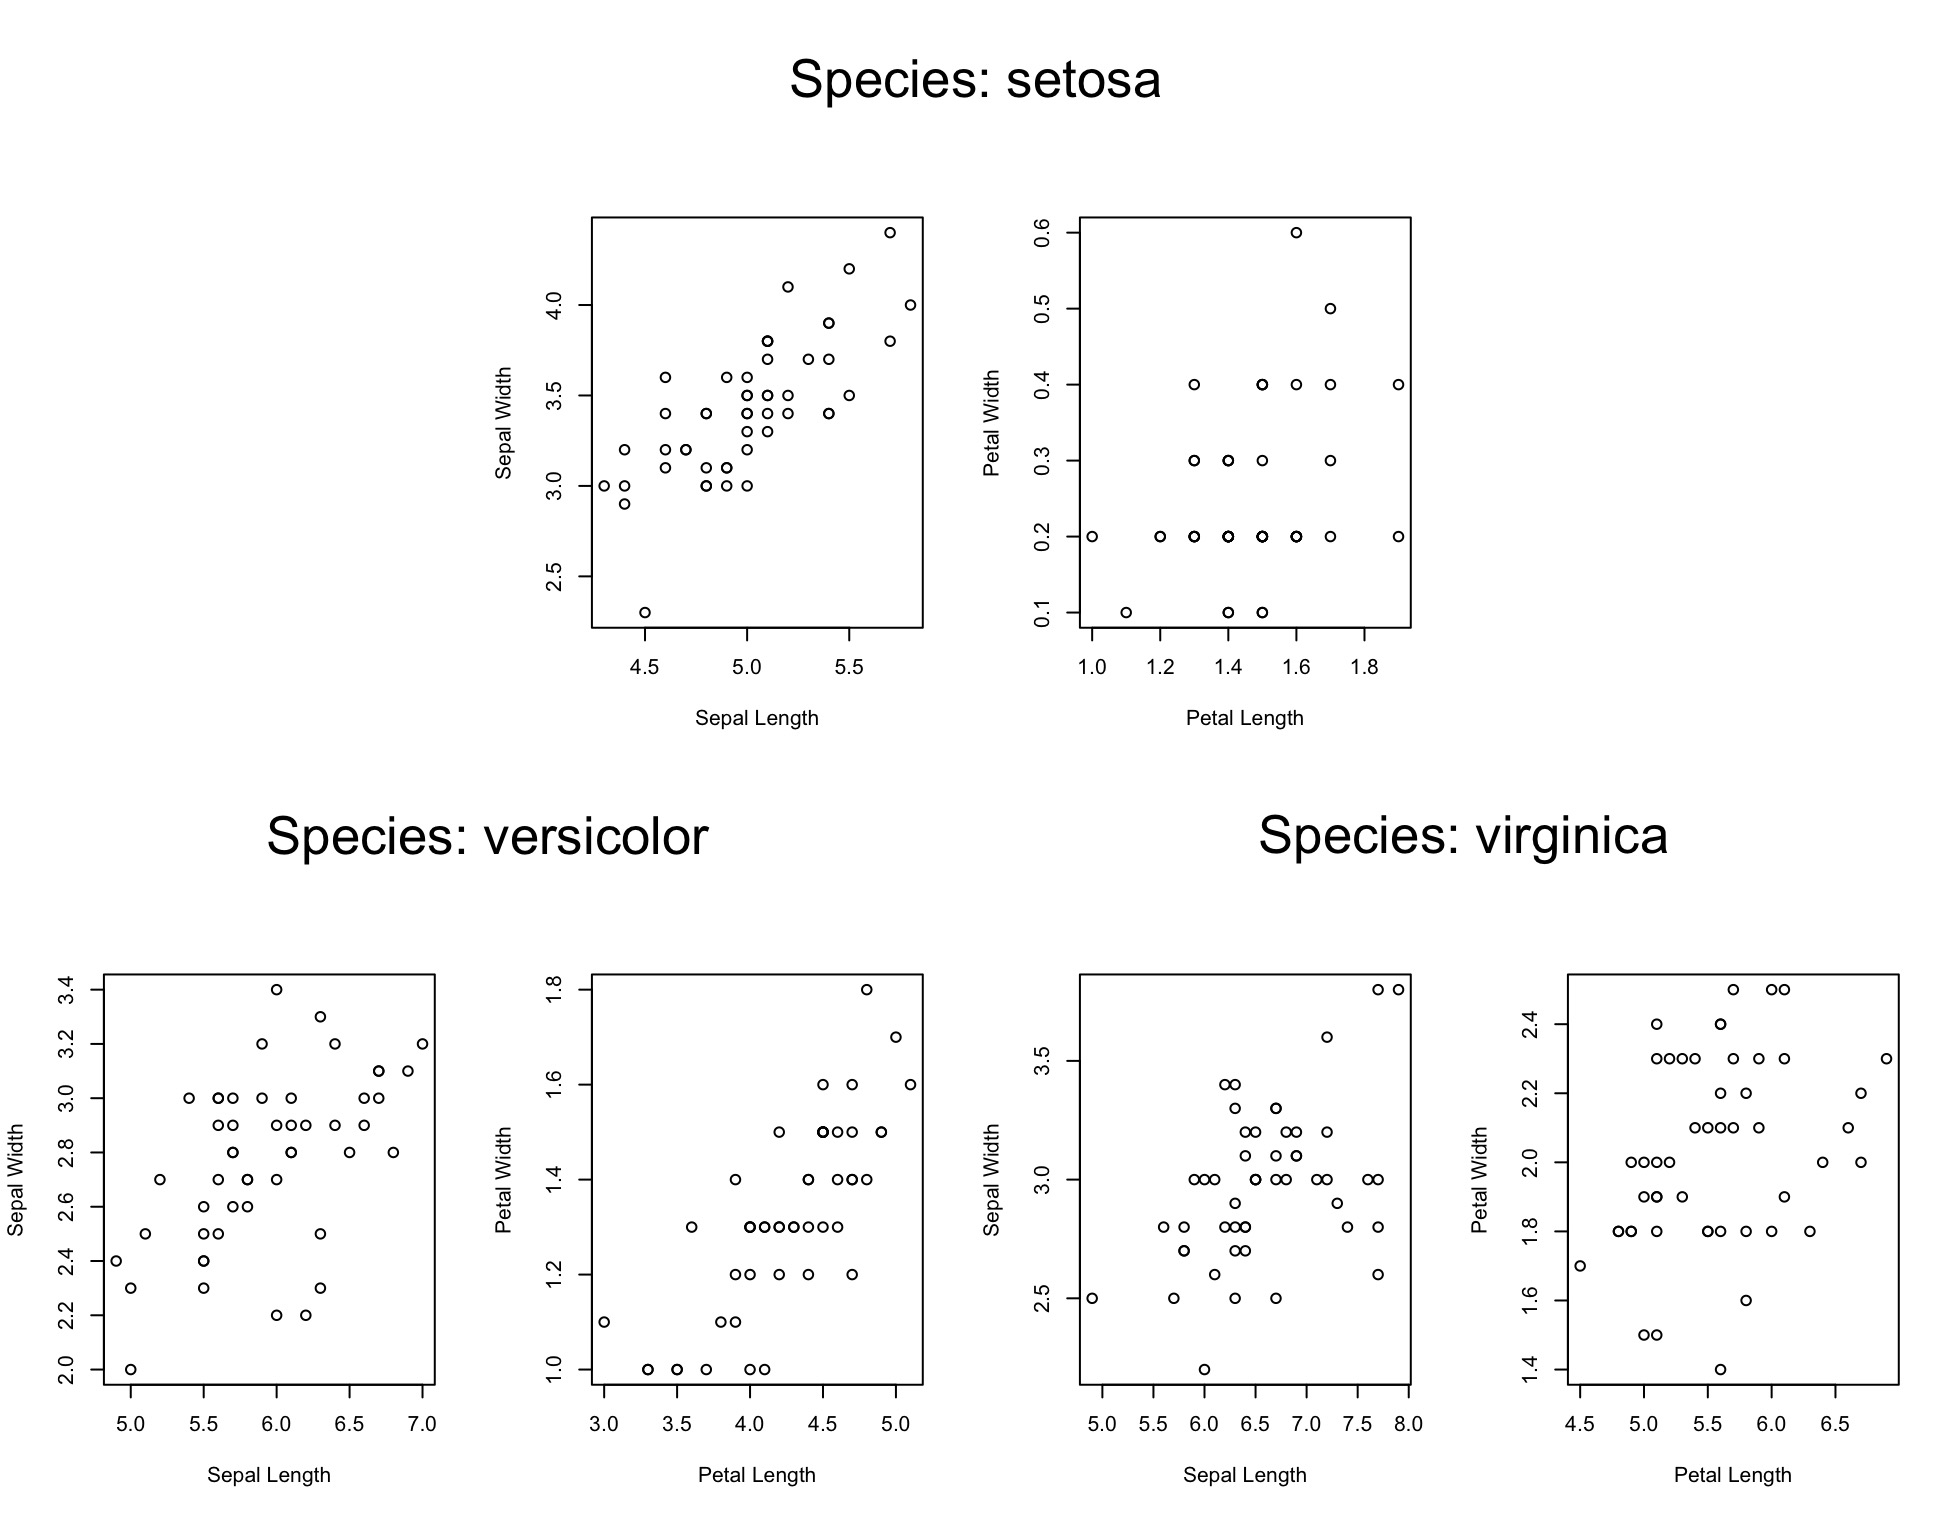
The function Making_Replicable_Layout_Matrices_for_Complicated_Figures is to be used when creating a plotting layout matrix where each plot in this layout matrix is itself comprised of multiple plots that were themselves created using a layout matrix. In other words, it's used when a figure comprised of multiple plots is itself to be replicated to create a more complex figure. Here is a figure that shows what this function does.
The function Optimally_Assigning_Experimental_Units_to_Treatment_Groups_With_a_Blocking_Variable assigns experimental units to treatment groups (for cases when there is a blocking variable) in a way that ensures that treatment groups are as balanced as possible for a particular set of experimental units' variables. This function works by calculating means and possibly other higher-order mathematical moments (such as variances, skewnesses, and kurtoses) for a particular set of experimental units' variables that have already been measured and, out of every single possible grouping arrangement, choosing the one that holds these moments as similar as possible across treatment groups.
The function Optimally_Assigning_Experimental_Units_to_Treatment_Groups_Without_a_Blocking_Variable assigns experimental units to treatment groups (for cases when there is no blocking variable) in a way that ensures that treatment groups are as balanced as possible for a particular set of experimental units' variables. This function works by calculating means and possibly other higher-order mathematical moments (such as variances, skewnesses, and kurtoses) for a particular set of experimental units' variables that have already been measured and, out of every single possible grouping arrangement, choosing the one that holds these moments as similar as possible across treatment groups. This function was heavily inspired by my good friend Sam Zuckerman's work.
The function Removing_Matrix_Rows_and_Columns_Optimally removes missing or non-finite values from matrices by means of row and column deletions. These deletions are performed in a way that ensures that the maximum number of good (non-missing or finite) values are retained in the resulting matrix.
The function Using_an_Improved_Bonferroni_Correction_for_Multiple_Comparisons is being worked on currently.
The function Using_an_Improved_Sidak_Correction_for_Multiple_Comparisons is being worked on currently.
The data frame Sugar_Maple_Data may be used with the Aligning_Values_Across_Multiple_Vertical_Axes() function - the Sap_Flow and Wood_Temperature columns in this data frame can be aligned across primary and secondary vertical axes at the values of 0 as shown here.
Beghin, G. 2023. Does the Lay Concept of Mental Disorder Necessitate a Dysfunction? Advances in Experimental Philosophy of Medicine, edited by Kristien Hens and Andreas De Block. Bloomsbury Publishing. Pp. 71-96.
Chue, K.L., and A. Yeo. 2022. Exploring associations of positive relationships and adolescent well-being across cultures. Youth Soc. 00:1-12.
Findor, A., M. Hruska, P. Jankovská, and M. Pobudová. 2021. Re-examining public opinion preferences for migrant categorizations: “Refugees” are evaluated more negatively than “migrants” and “foreigners” related to participants’ direct, extended, and mass-mediated intergroup contact experiences. Int. J. Intercult. Relat. 80:262-273.
Karakai, D., and R. Moskotina. 2024. Religious involvement over time: Assessing measurement invariance of the Religious Involvement scale in Ukraine. Sociology: Theory, Methods, Marketing. 4:96–110.
Levy, K.J. 1977. Pairwise comparisons involving unequal sample sizes associated with correlations, proportions or variances. Br. J. Math. Stat. Psychol. 30:137-139.
Matko, K., and P. Sedlmeier. 2023. Which meditation technique for whom? An experimental single-case study comparing concentrative, humming, observing-thoughts, and walking meditation.
Moore, D.B. 2024. DBM.functions: A Variety of Functions for a Variety of Applications. R package version 0.0.0.9000. https://github.com/davidblakneymoore/DBM.functions.
Russo, L., N. DeBarros, S. Yang, K. Shea, and D. Mortensen. 2013. Supporting crop pollinators with floral resources: network-based phenological matching. Ecol. Evol. 3:3125-3140.