I conceived and designed this app for my final project in the Udacity iOS Developer course.
It is an attempt at making information about Winnipeg's municipal elections very accessible to the public, removing the need to dig through a government website and to put the data in a spreadsheet yourself.
All dependencies are installed with cocoapods and contained in the podfile.
Charts: For presenting election data.
Winnipeg Open Data API — Election Results dataset:
https://data.winnipeg.ca/Council-Services/Winnipeg-Election-Results/7753-3fjc
If you are attempting to build this in Xcode, build it from the WinnipegElectionResults.xworkspace file.
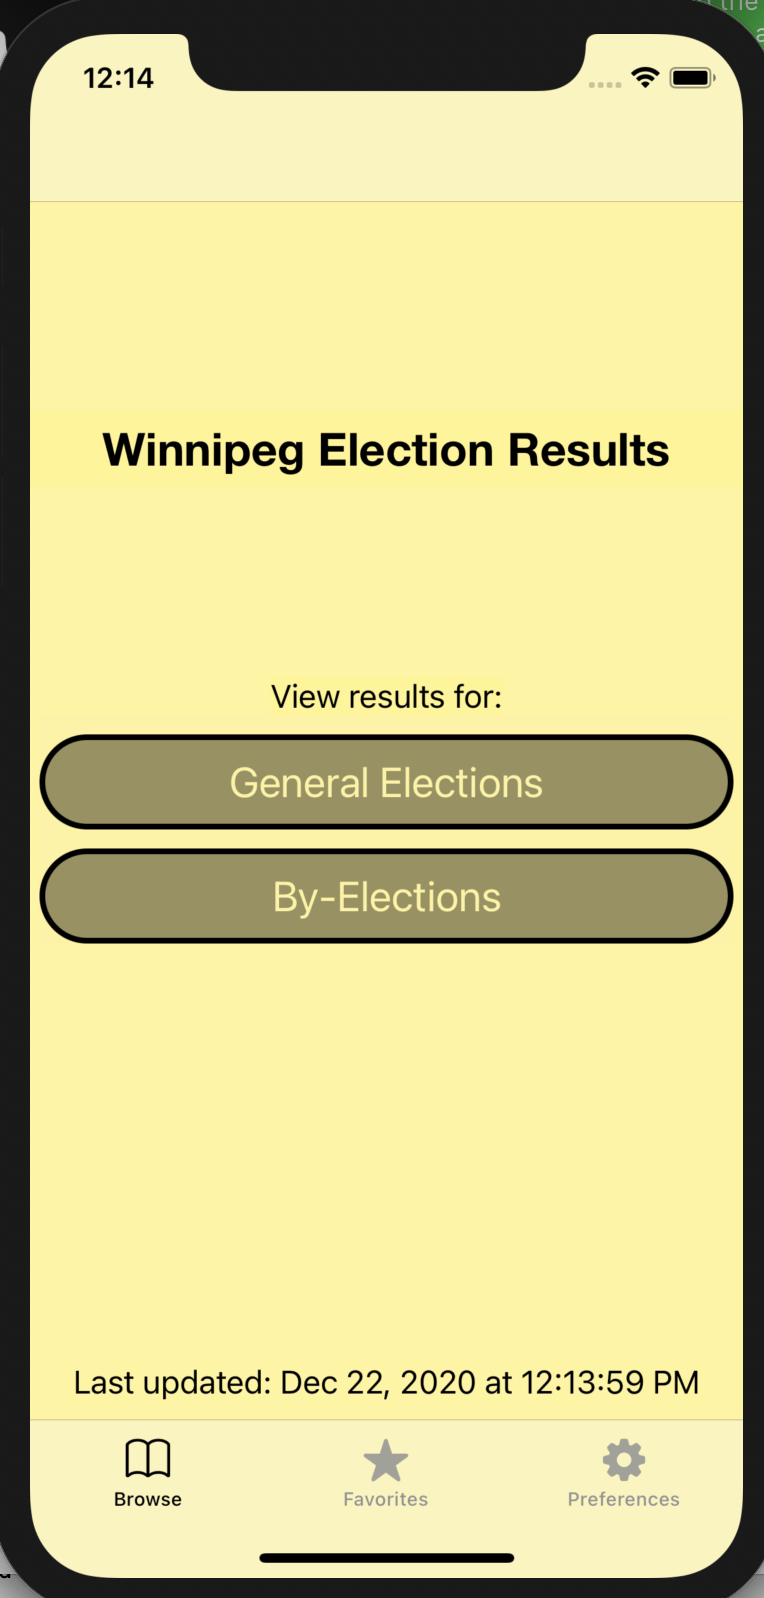
The user is presented with a home page, on which a table view will list the election types available to browse after it downloads and saves them through a network request.
As of December 2020, these are "General elections" and "By-elections".
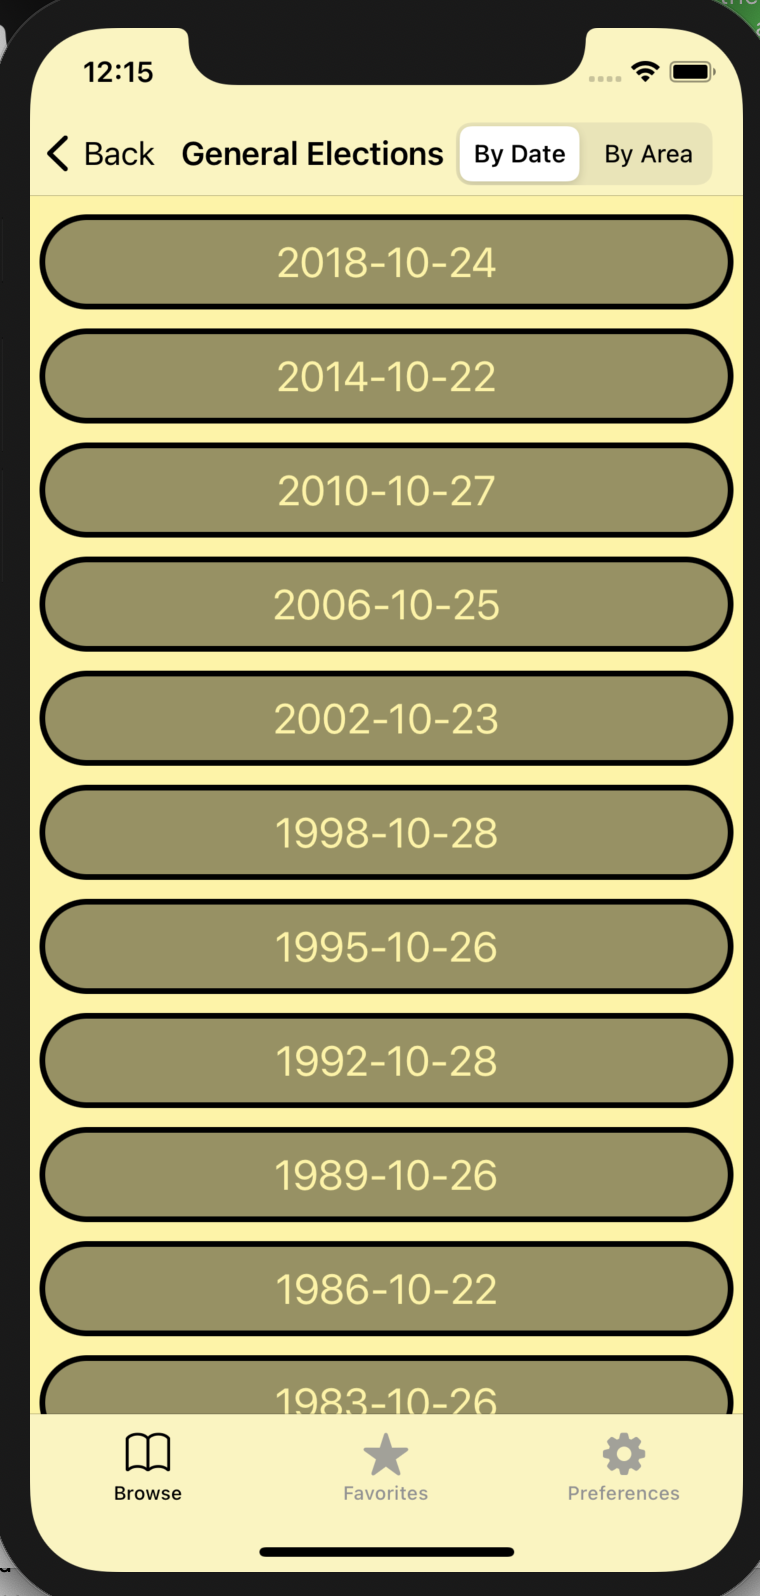
If the user selects an election type, they are brought to a filter view with a table where they can browse avaiable dates or areas (togglable).
If the user further selects a date/area, they are brought to a collection view that displays a small version of election result charts which can be selected.
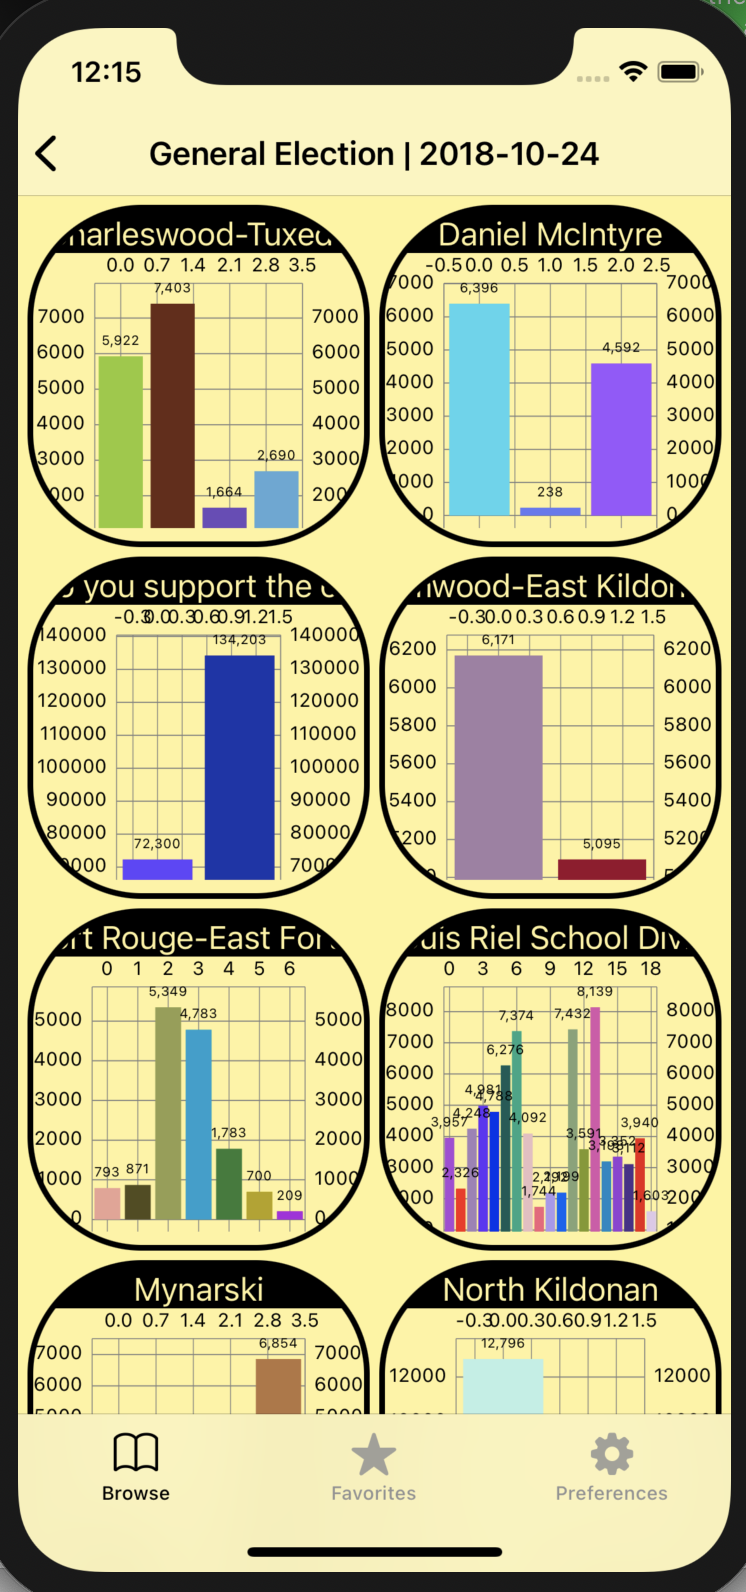
Upon selection, the user is brought to a detail view where they can visualize the result.

The user can favorite the result by clicking the favorites button, and this will be shown with a filled star.
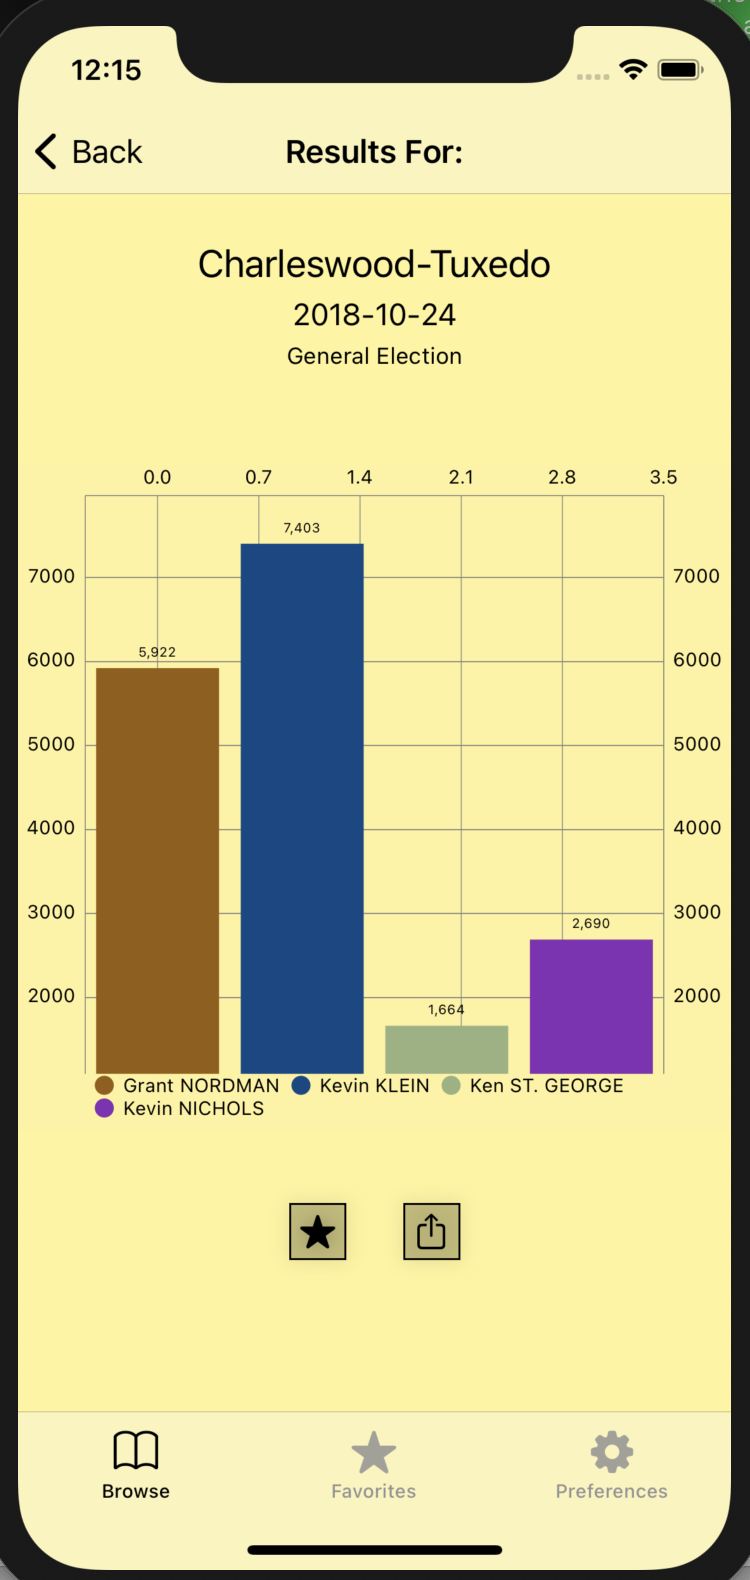
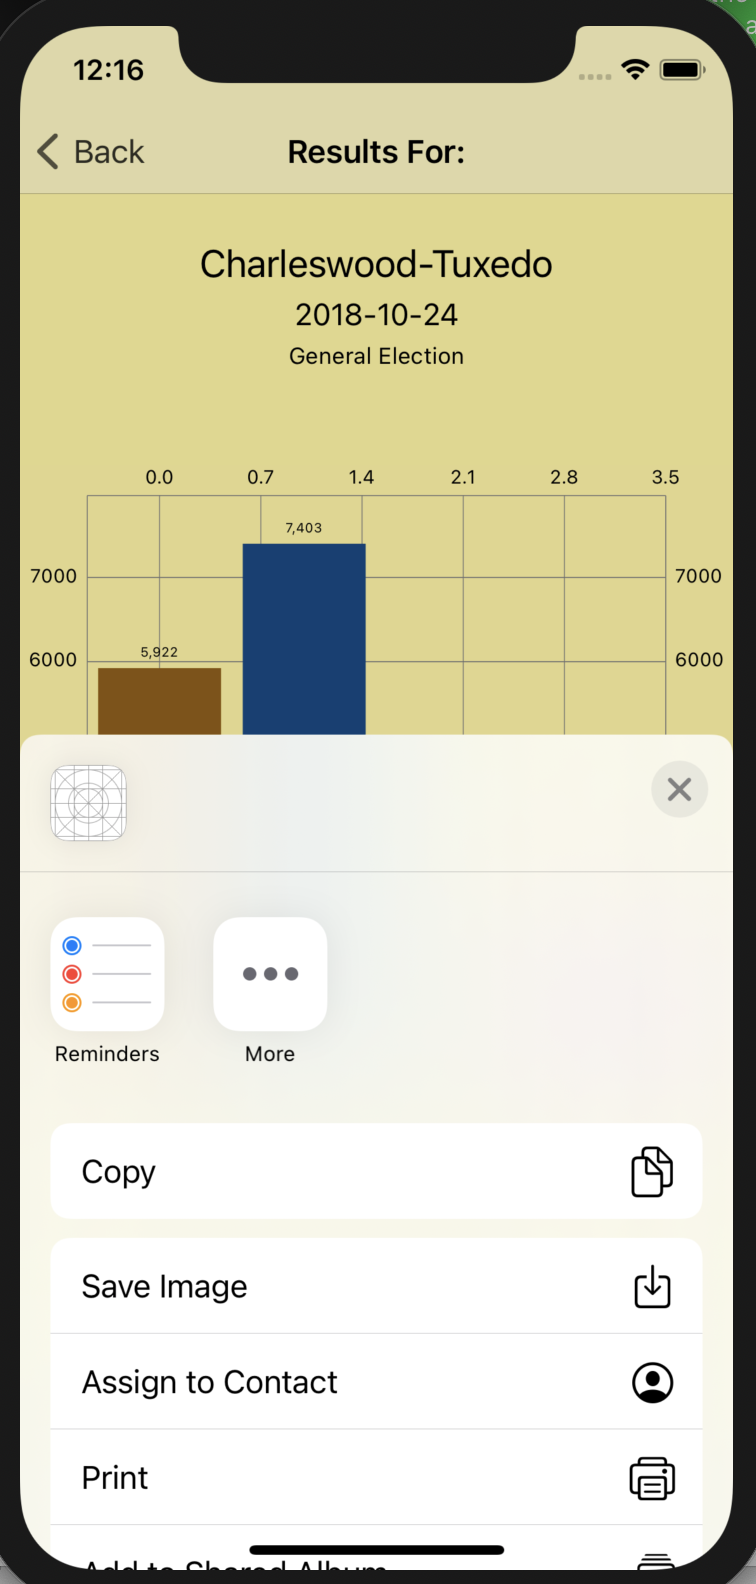
The user can also share the result by clicking on the share button.
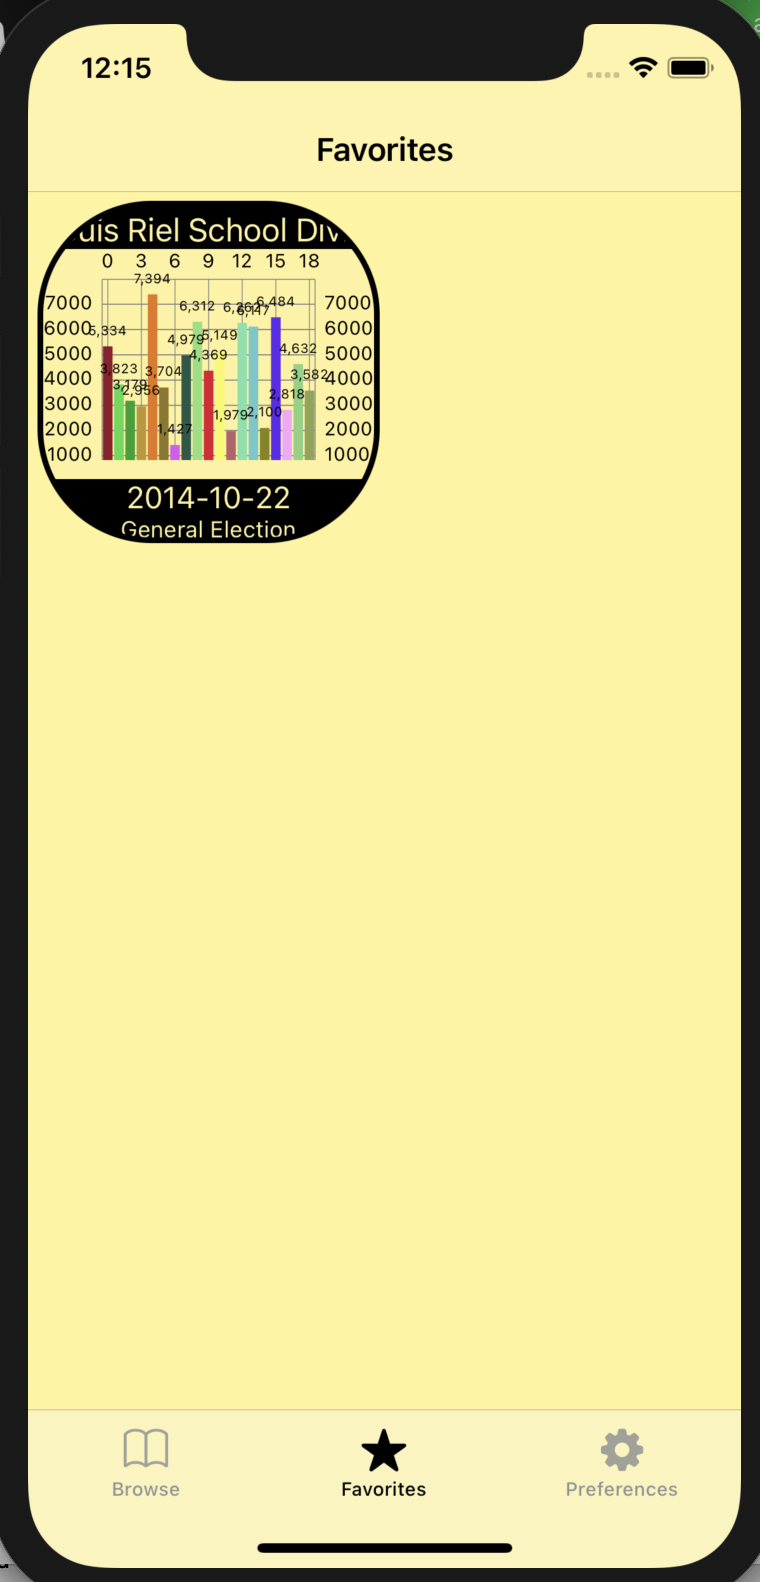
At the bottom of each view, the user has the option to select the Favorites tab, where they can visualize what results they've favorited:
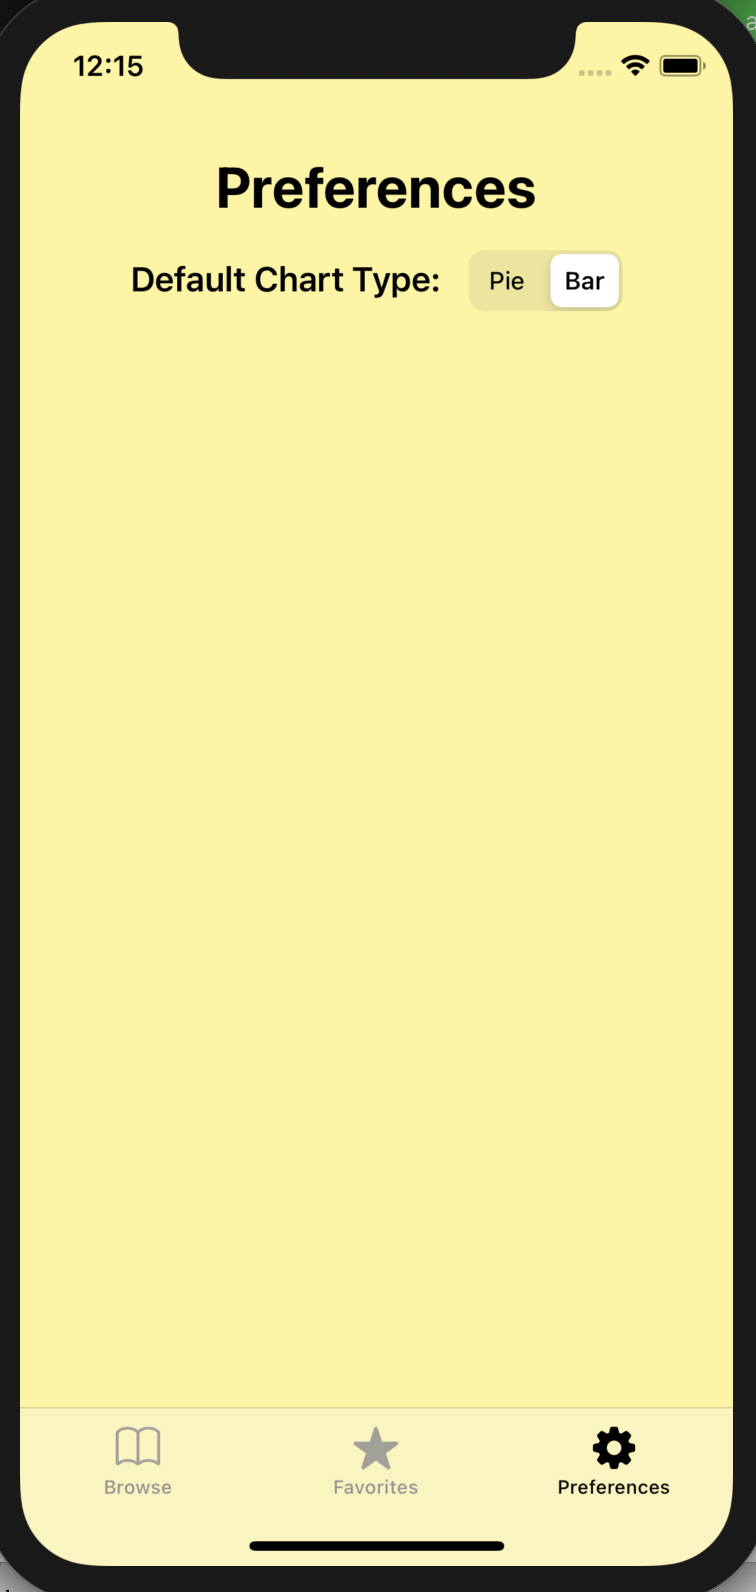
Alternatively, they can select the Preferences tab, where the only option is currently to toggle viewing graphs as a bar chart or as a pie chart.