
![]()

![]()
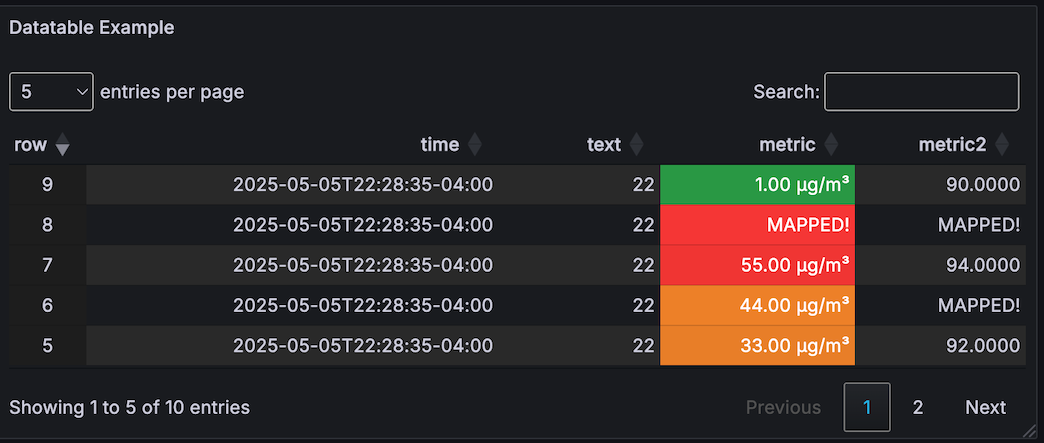
This panel plugin provides a Datatables.net table panel for Grafana 10.x/11.x/12.x.
This table includes features for metric thresholds, value mapping, aggregations, and per-cell filtering.
- Multiple options for row and cell thresholds
- Scrolling and Paging options with horizontal scroll as needed
- Search and highlight cell content
- Filters per column
- Click through urls based on cell data
- URLs inside row text can be "clicked"
- Rows can have a click-through URL
- Multi-Column Sorting
- Horizontal scrolling enabled when columns are wider than panel
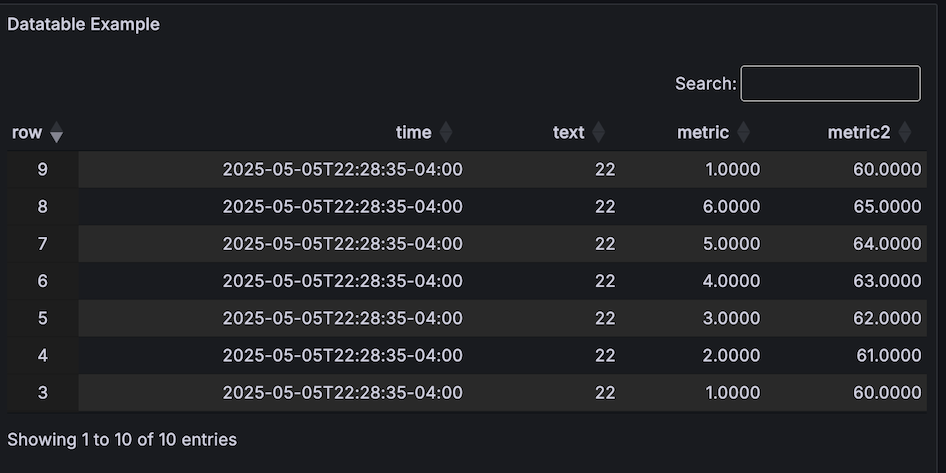
By default the panel enables scrolling for the data, use the Enable Paging option to use the paging method.
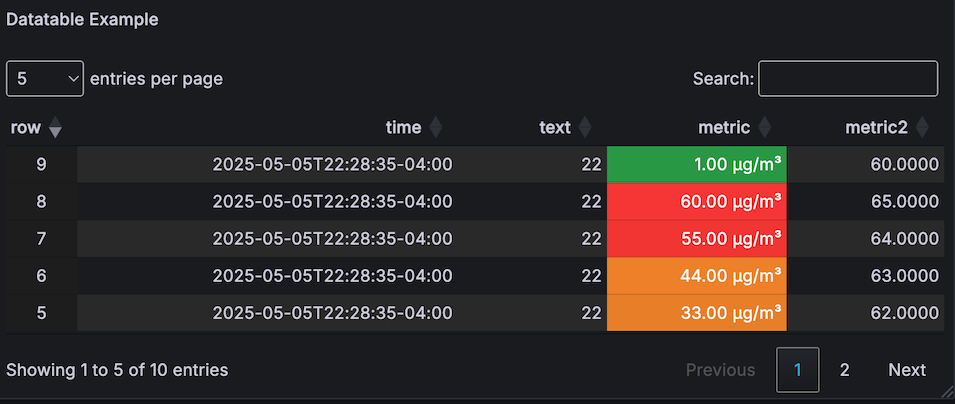
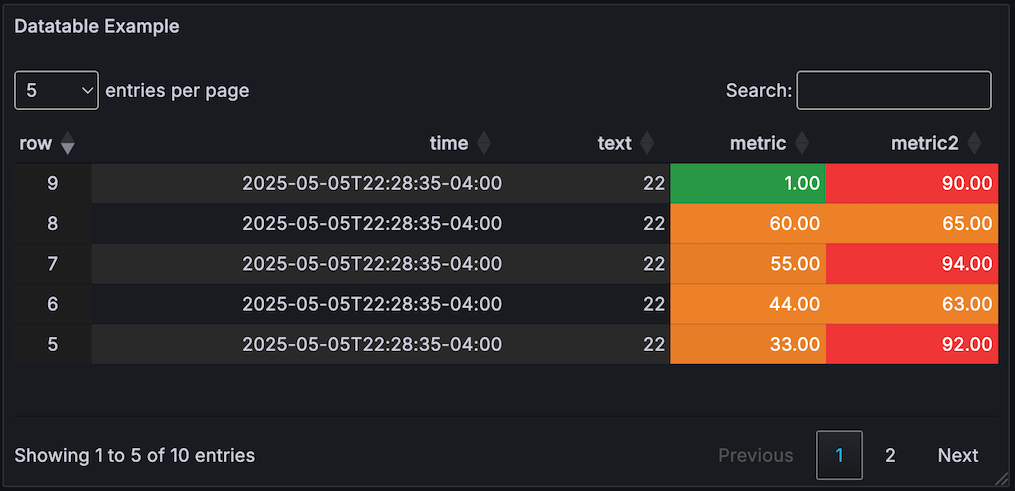
Value and Range Maps can be applied to modify the cell visual text, and threshold applied to the metric value that was mapped.
There are multiple sections for configuring the data in the editor.
When scrolling is enabled, the table supports vertical and horizontal scrolling of the data.
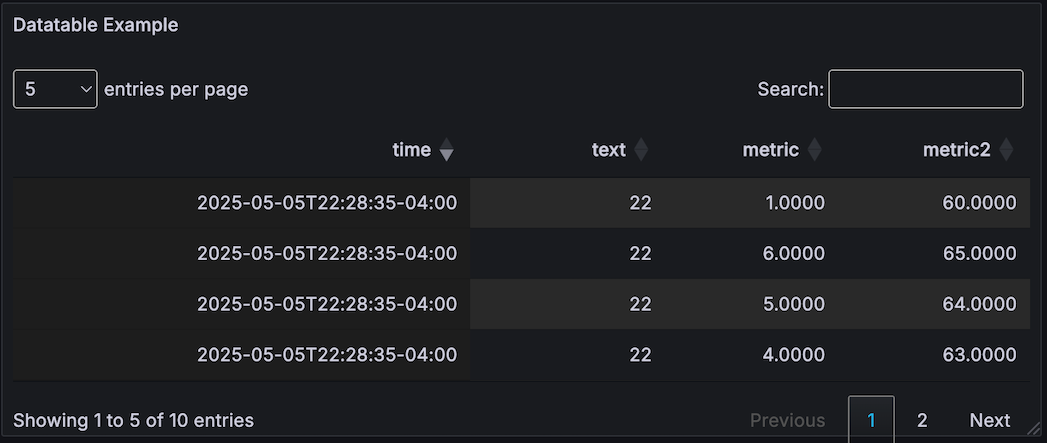
When scrolling is disabled, the panel switches to paging mode with controls that will skip through data at specific intervals.
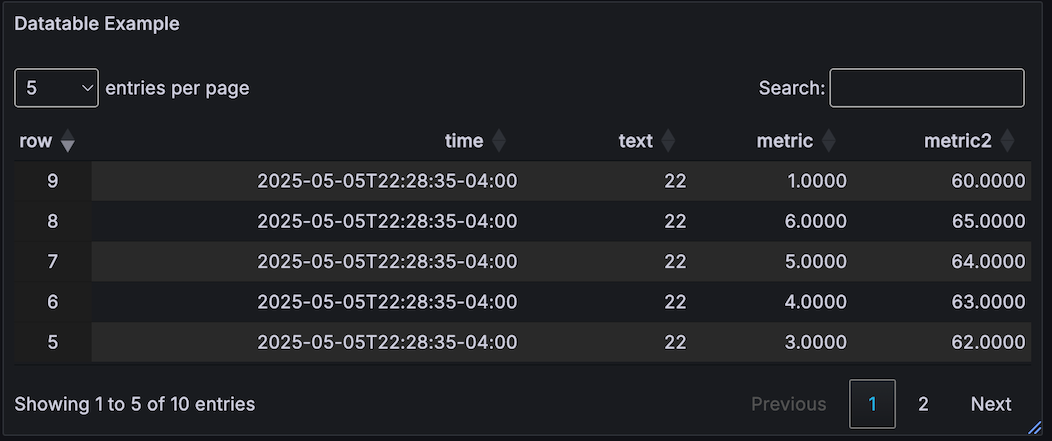
The number of rows displayed can be set with the entries per page selector at the top left of the panel.
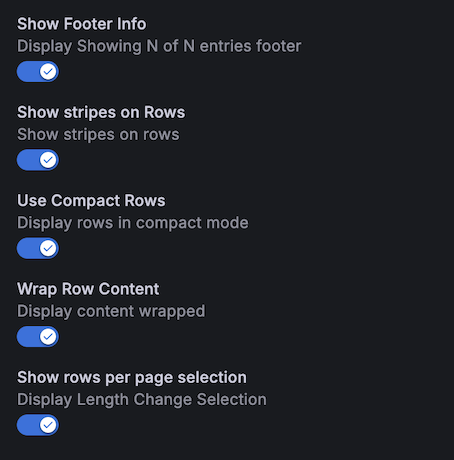
Show rows per page selection
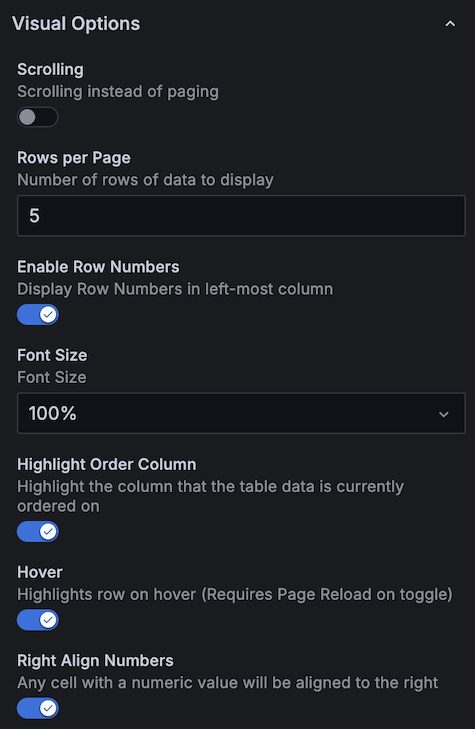
| Option | Meaning |
|---|---|
| Enable Row Numbers | Adds left column showing row numbers |
| Font Size | Adjust font size of text in table |
| Highlight Order Column | When the column order is modified, this highlights it |
| Hover | Highlight row under mouse |
| Right Align Numbers | All cells with numbers will be aligned to the right |
| Show Footer Info | Displays number of rows |
| Show Stripes on Rows | Alternating stripes for even/odd rows |
| Use Compact Rows | Reduce space used to display data |
| Wrap Row Content | Auto-wraps text to fit in column width |
When there is no data available for a cell, a custom value can be substituted with this setting enabled.
Selects how to convert the source data to a compatible panel format.
| Transform Type | |
|---|---|
| Timeseries to Columns | This is the typical method |
| Timeseries to Rows | Converts to rows (wide data) |
| Timeseries Aggregations | Provides selectable aggregations for metrics |
| Last/Mean/Min/Max etc | |
| JSON Data | Converts JSON to table format |
| Table | Generic table format to datatable |
Override the name displayed for a column. Each column can be selected and an alias provided.
Provide a width "hint" in percentage or pixels ( 100px or 10% ). Note: The table will autosize as needed, but will use the hints provided.
Sort table by specified column number in ascending/descending order. Multiple sorting options can be applied.
NOTE: When these sorting rules are in place, the table cannot be manually sorted.
There are four styles that can be applied to the datatable.
NOTE: The first style that matches "wins" and all other style matches are ignored.
Support for multiple styles is a future enhancement, where a string and a metric style can be applied to the same cell.
This lets you convert "unix epoch" numerical timestamps to a readable format.
Matching column names can have a clickthrough applied to them.
Once the url is specified, additional options are displayed that provide additonal "macros."
Additional you can specify if the URL should be open in a new tab or new window, and specify a custom target.
Split By RegEx - the cell content of the matching column is split by this regex which can then be used within the URL.
For example, a column named text with a RegEx '/text/', and a split by as space /\s/. The content of the cell split can be referenced by:
$__pattern_N - where N is the position of the split
$__cell_N - the content of cell N within the same row
$__cell - the content of the current cell
Time Macros
$__keepTime - provides the from=now-24h&to=now time option of the dashboard
$__from - provides the raw from time of the dashboard
$__to - provides the raw to time of the dashboard
https://myinstance.grafana.net/d/dashboard-example?$__keepTime
expands to:
https://myinstance.grafana.net/d/dashboard-example?from=now-24h&to=now
https://myinstance.grafana.net/d/dashboard-example?$__keepTime&var-SERVER=$__cell_2
expands to:
https://myinstance.grafana.net/d/dashboard-example?from=now-24h&to=now&var-SERVER=ServerA
https://myinstance.grafana.net/d/dashboard-example?$__keepTime&var-SERVER=$__cell
expands to (the current cell contains Server B), params are encoded:
https://myinstance.grafana.net/d/dashboard-example?$__keepTime&var-SERVER=Server%20B
https://myinstance.grafana.net/d/dashboard-example?$__keepTime&var-SERVER=$__pattern_2
Where cell content contains Error on ServerC, and split by is /\s/
expands to:
https://myinstance.grafana.net/d/dashboard-example?$__keepTime&var-SERVER=ServerC
Hidden Style
Matching columns will be "hidden" from the table
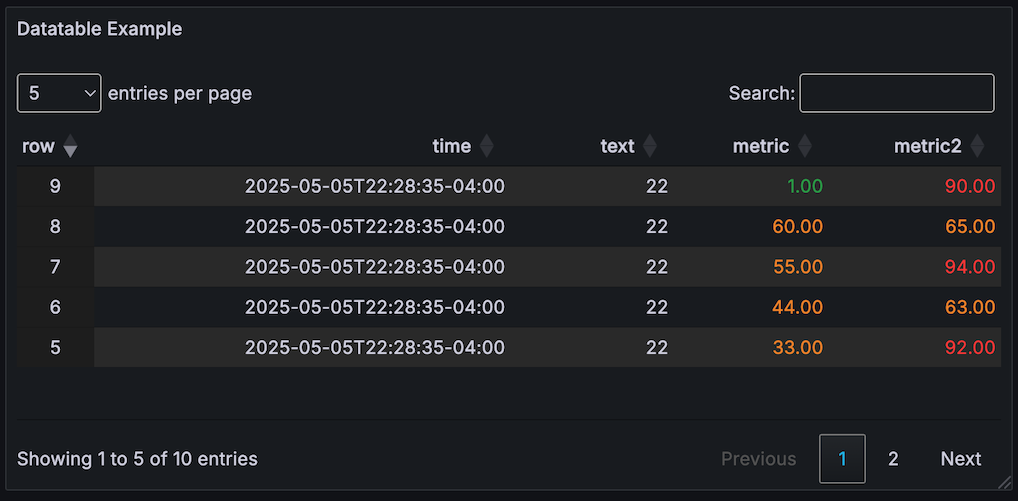
The metric style enables the ability to show thresholds on a per-row/per-cell basis.
Metric/Regex: Specify the metric or RegEx pattern to match multiple metrics. This is populated with the available columns. Decimals: Set the number of decimals to be displayed Unit Format: Set the unit to be applied to the metric
These thresholds are the same as polystat, where multiple ranges can be specified and custom colors assigned.
Thresholds are expected to be sorted by ascending value, where
T0 = lowest decimal value, any state
TN = highest decimal value, any state
Initial state is set to "ok"
A comparison is made using "greater than or equal to" against the value
If value >= thresholdValue state = X
Comparisons are made in reverse order, using the range between the Nth (inclusive) threshold and N+1 (exclusive)
  InclusiveValue = T(n).value
  ExclusiveValue = T(n+1).value
When there is no n+1 threshold, the highest value threshold T(n), a simple inclusive >= comparison is made
Example 1: (typical linear)
    T0 - 5, ok
    T1 - 10, warning
    T2 - 20, critical
  Value >= 20 (Value >= T2)
  10 <= Value < 20  (T1 <= Value < T2)
  5 <= Value < 10   (T0 <= Value < T1)
Example 2: (reverse linear)
    T0 - 50, critical
    T1 - 90, warning
    T2 - 100, ok
  Value >= 100
  90 <= value < 100
  50 <= value < 90
Example 3: (bounded)
    T0 - 50, critical
    T1 - 60, warning
    T2 - 70, ok
    T3 - 80, warning
    T4 - 90, critical
    Value >= 90
    80 <= Value < 90
    70 <= Value < 80
    60 <= Value < 70
    50 <= Value < 60
The "worst" state is returned after checking every threshold range
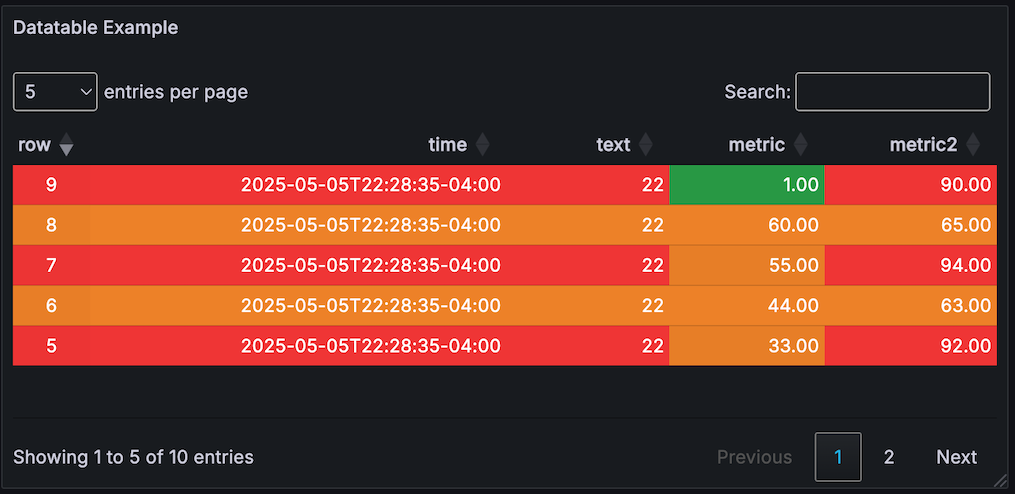
"Row" coloring uses the "highest" threshold color of all columns
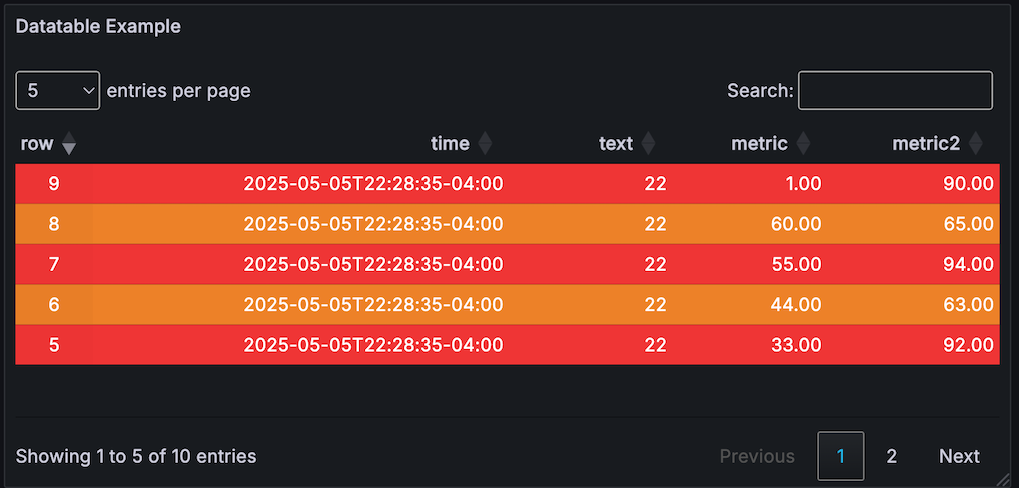
This option sets the row color to the "highest" threshold found for all cells in row.
It also sets the color for each cell according to the threshold (you can tell which columns actually exceeded the threshold).
This means - a row can have an overall color, with each cell indicating it's real threshold color.
This panel is based on the "Table" panel by GrafanaLabs
Special thanks to Esteban Beltran for his help porting from Angular!