.png)
.png)
| home page | data viz examples | critique by design | final project I | final project II | final project III |
- Web page URL: https://aritra1804.github.io/aritra-dataviz-portfolio/
- This repository: https://github.com/aritra1804/aritra-dataviz-portfolio
Welcome to my public portfolio of data visualization work. Here, you’ll find examples, critiques, and final projects that showcase how I tell stories with data. This is where all my cool work will go. You should probably hire me.
Hi, I’m Aritra Dutta – an aspiring Data Scientist and Machine Learning Enthusiast passionate about leveraging data to solve complex problems and drive innovation. With a strong foundation in Computer Science Engineering and Economics, and currently pursuing a Master’s in Information Systems Management at Carnegie Mellon University, I aim to merge technical expertise with business acumen to create impactful solutions.
Throughout my journey, I’ve had the opportunity to work on diverse projects, ranging from developing IoT-based smart farming solutions to building web apps for resource discovery during the COVID-19 pandemic. My internship experiences have honed my skills in data visualization, business intelligence, and machine learning, empowering me to turn raw data into actionable insights.
I thrive in collaborative environments and enjoy connecting with people from all walks of life. My experiences studying and working across India, South Korea, Taiwan, and the United States have broadened my perspective, fueling my curiosity and adaptability.
When I’m not analyzing data or brainstorming solutions, you’ll find me exploring mythological stories from around the world, meeting people from different cultures, or planning my next travel adventure. I believe that every interaction and experience adds depth to the way we approach challenges, and I carry that mindset into all my projects.
Feel free to explore my portfolio to learn more about my work or connect with me to collaborate on exciting opportunities. Let’s innovate together!
All the things - obviously. Maybe I want to make a list of all the things. If so, I can do so in Markdown like this:
- Effective Data Visualization Techniques
- I want to master the art of creating clear, compelling, and impactful visualizations that effectively communicate insights to diverse audiences, including non-technical stakeholders.
- Crafting Narratives with Data
- I aim to learn how to build cohesive and persuasive narratives around data, ensuring that my analyses not only inform but also engage and drive actionable decisions.
- Tools and Best Practices
- I hope to deepen my understanding of industry-standard tools and frameworks for data storytelling, including design principles, audience targeting, and ethical considerations in data representation.
Examples Data viz examples
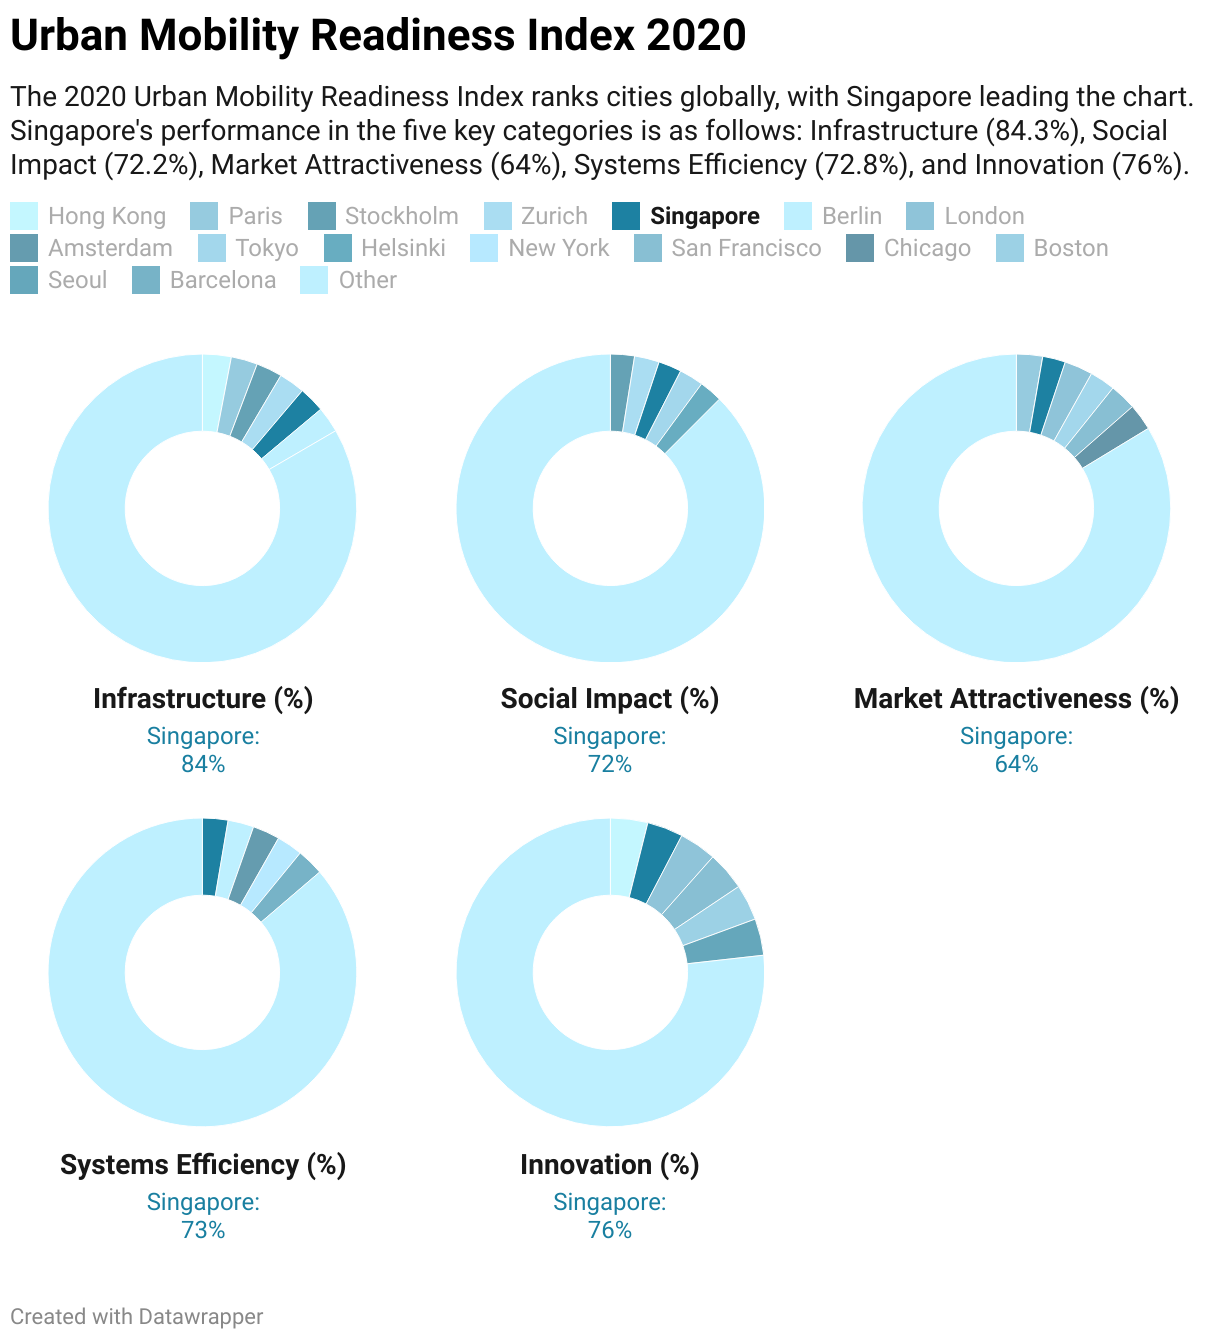
Below is an example of one of the visualizations I created in the course. It talks about the Urban Mobilility Readiness Index in the year 2020 for various countries. 👉 Click here to view the other visualizations
The Hidden Cost of AI: Is AI Really an Energy Monster?
This data-driven story explores the often-overlooked energy footprint of artificial intelligence (AI). With AI systems like ChatGPT and Google AI becoming integral to daily life, the project investigates whether AI's energy consumption is truly as alarming as headlines suggest or if the concerns are overblown.
The narrative takes readers on a journey to uncover:
- How much energy AI actually consumes compared to other household and industrial uses.
- The local impacts on energy grids in AI hubs like Virginia and Texas.
- Future projections of AI's energy demand and how efficiency improvements are helping.
- Practical comparisons (e.g., ChatGPT queries vs. household appliance energy use) to contextualize AI's energy footprint.
- Myth-busting: Challenging exaggerated claims about AI being an "energy monster."
- Efficiency Evolution: Highlighting how AI systems are becoming more energy-efficient over time.
- Local vs. Global Impact: Demonstrating how local grids feel the strain more than global energy systems.
- Call to Action: Encouraging readers to consider personal energy choices and advocate for sustainable AI development.
- General Public: To raise awareness about AI’s energy footprint.
- Industry Leaders & Policymakers: To inform decisions on sustainable energy use and AI development.
To educate, debunk myths, and empower readers to make informed decisions about energy consumption in the age of AI, all while fostering discussions around the sustainability of emerging technologies.
Below are the links to each of the parts of the final project.
I did not use AI for this assignment.