This project was written to take large sets of people and sort them into local groups. It takes as input a spreadsheet with details including longitude and latitude coordinates (these can be obtained from addresses, for example, by using one of many free google sheets extensions). The spreadsheet also indicates group leaders, or 'deliverers', of which exactly one must be present in each group.
analysis.py: sorts the data into groups and shows a summary, with the option to save the sorted data into a new spreadsheet
k-means.py: demonstrates the working of the k-means clustering algorithm by randomly generating points and sorting into k groups. The number of points and the value of k can be changed in the program
plot.py: sorts data into groups as in analysis.py, but plots the points at each iteration of the grouping to show how the groups develop
showresults.py: plots a scatter of all points then final results, colour coordinated to show each group
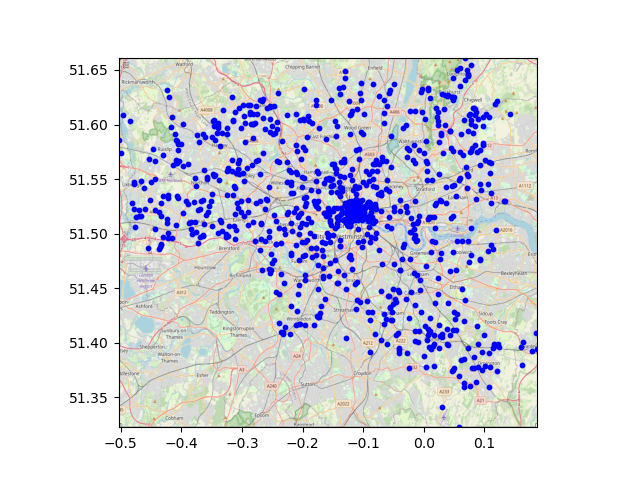
When run on a database containing 962 random* London addresses, the inital scatter of points is output as follows:
*(a similar number of random adresses were selected from each London postcode, giving a spread of locations across the city)
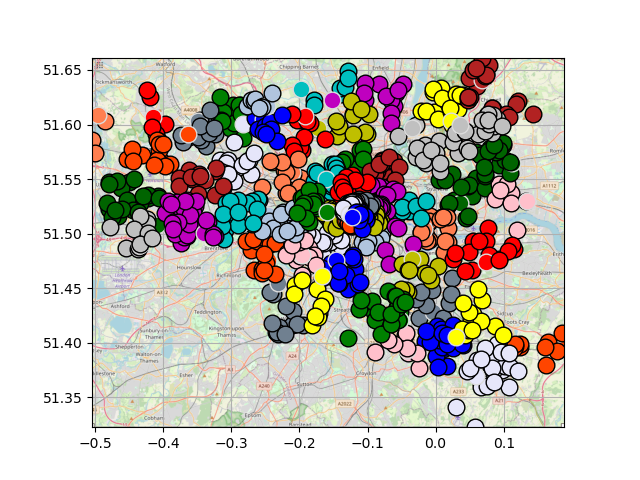
Points were then sorted, and grouped as below:
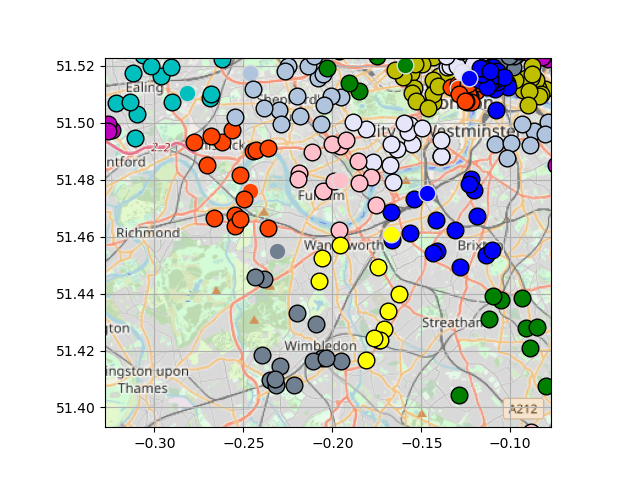
Zooming in shows more clearly how groups are divided, with the 'deliverer' for each group outlined in grey