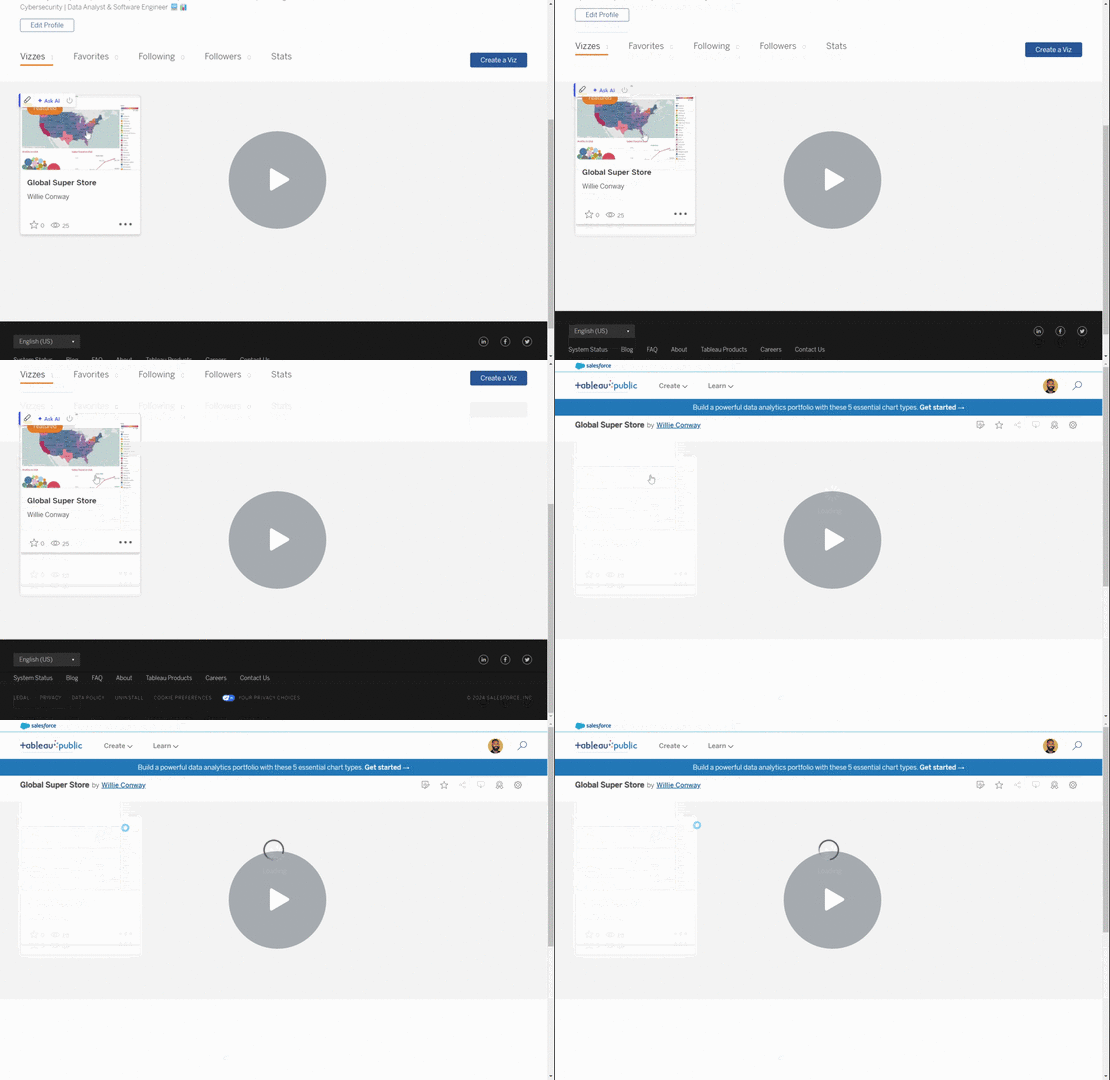
This project involves the data modeling and analysis of sales data for the Global Super Store, a fictional company operating in the USA. The goal was to design and implement a relational database, and then use Tableau to create interactive visualizations for analyzing sales performance across various regions, products, and time periods.
In September 2024, I completed the following steps:
- Data Restructuring: Transforming raw business data into a structured database. 🗃️
- Database Implementation: Building the database schema in MySQL. 🖥️
- Sales Analysis: Using Tableau to create visualizations that provide insights into sales performance. 📈
The first step was to design the Entity-Relationship (ER) Diagram for the database. This diagram identifies the key entities and their relationships within the store's operations.
- Orders 🛍️
- Customers 👥
- Time ⏱️
- Location 🗺️
- Sales 💰
- Products 🏷️
- Orders are linked to Customers and Products.
- Each Order has an associated Shipment.
- Sales are linked to Products and Locations.
I used MySQL Workbench to create the ER diagram and normalized the database schema to the third normal form (3NF) for efficiency.
Once the ER diagram was designed, the next step was to implement the data model in MySQL Workbench.
- Forward Engineer: Export the schema to MySQL and create the necessary tables. 💾
- SQL Execution: Execute the SQL script to generate the database on the live server. 📜
The database schema was successfully created, and data could be imported and analyzed.
To facilitate efficient querying and analysis, I implemented a Star Schema for the sales data. This schema is designed to support dimensional analysis across key business metrics.
- Fact Table:
Sales(stores total sales, profit, etc.) 💵 - Dimension Tables:
Product: Details about the products. 🏷️Location: Information about geographical regions (City, State, Country). 📍Time: Time-related information (Year, Quarter, Month). 📅
This schema allowed for efficient aggregation and analysis, particularly focused on sales performance by Product, Location, and Time.
The first interactive visualization was a Map Chart showing the sales performance across different states in the USA.
- Drag the Country field to the filter card (select USA). 🇺🇸
- Place State and Sales into the Detail and Color sections, respectively. 🎨
This map chart gave a visual representation of sales distribution across states, highlighting regions with higher or lower performance.
Next, I created a Bubble Chart to visualize profits by state, with additional details like quantity sold and shipping costs displayed dynamically.
- Apply the Country filter (USA). 🇺🇸
- Add State to the Color section, Profit to the Size section, and other data to the Tooltip for interactivity. 🔍
This chart helped identify regions with the highest and lowest profit margins and allowed users to explore the data interactively.
To analyze sales trends over time, I created a Line Chart that focused on states with sales greater than $40,000.
- Drag Order Date into the Columns section and Sales into the Rows section. 📅
- Apply filters to focus on the USA and select states with sales over $40,000. 💵
The line chart helped to visualize how sales performed over time, with a clear focus on the highest-performing states.
The final step was to combine all the visualizations into an interactive dashboard. This dashboard allows users to view:
- Sales in USA (Map Chart) 🌎
- Profits in USA (Bubble Chart) 💸
- Sales Trend in USA (Line Chart) 📈
Interactivity was enabled by using filters. For example, clicking on a specific state in the map chart dynamically updated both the bubble chart and line chart, allowing for a comprehensive view of sales performance.
By completing this project, I achieved the following:
- Database Restructuring: Designed and implemented a normalized database schema to support scalable queries and analysis. 🔧
- Data Modeling: Created both an ER diagram and a star schema, forming a strong foundation for business intelligence analysis. 📊
- Tableau Visualizations: Developed interactive visualizations that provided actionable insights into sales performance, profits, and trends. 📈
- Interactive Dashboard: The interactive dashboard facilitated data exploration, allowing business users to focus on specific regions or time periods for decision-making. 🎯
This project demonstrated my ability to design efficient data models, implement them in MySQL, and use Tableau to build impactful, interactive data visualizations for business analysis.
- MySQL Workbench: For designing and implementing the database schema. 💻
- Tableau: For creating interactive visualizations and dashboards. 📊
- SQL: For querying and manipulating the data. 👨🏿💻
This project is licensed under the MIT License - see the LICENSE file for details.


