This is a Python application allowing users to build a financial database and web application by using SQL, Python, and the Voilà library to analyze the performance of a hypothetical fintech ETF
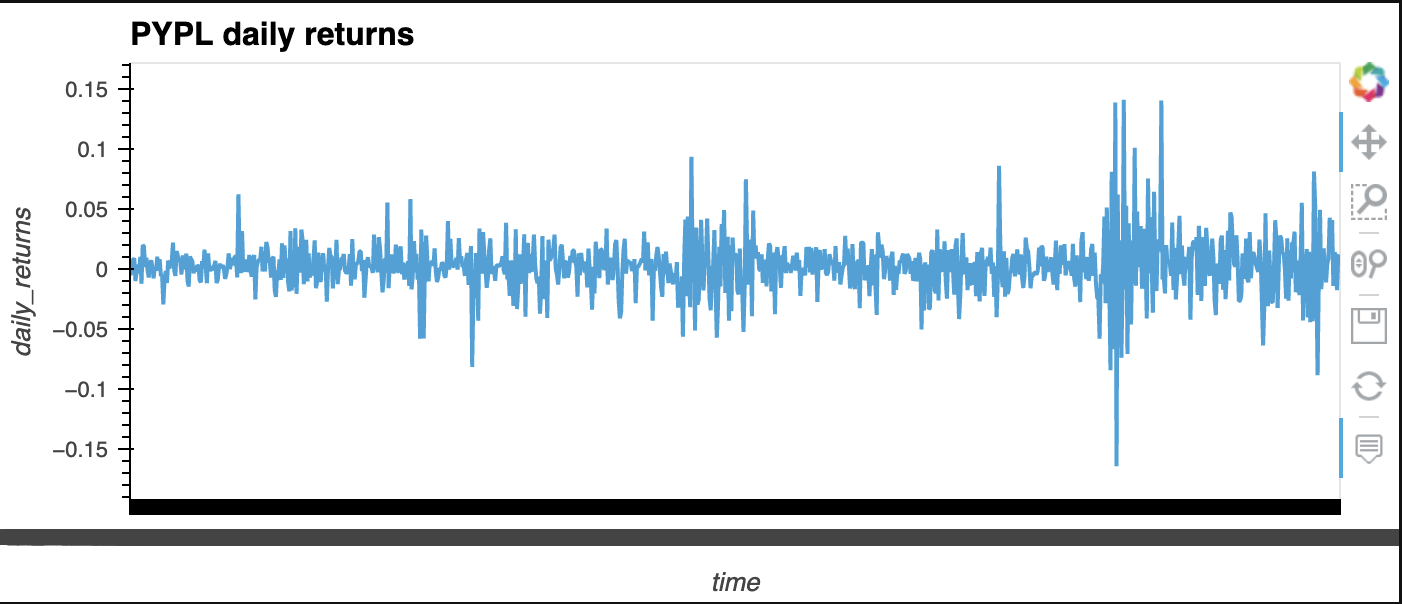
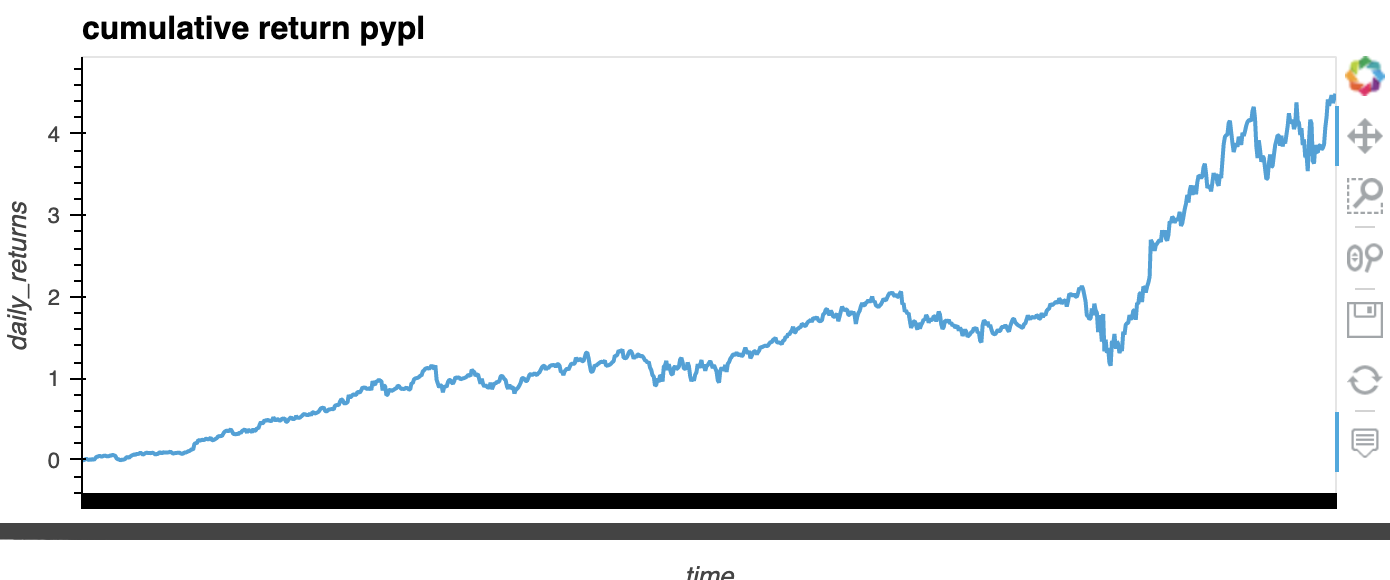
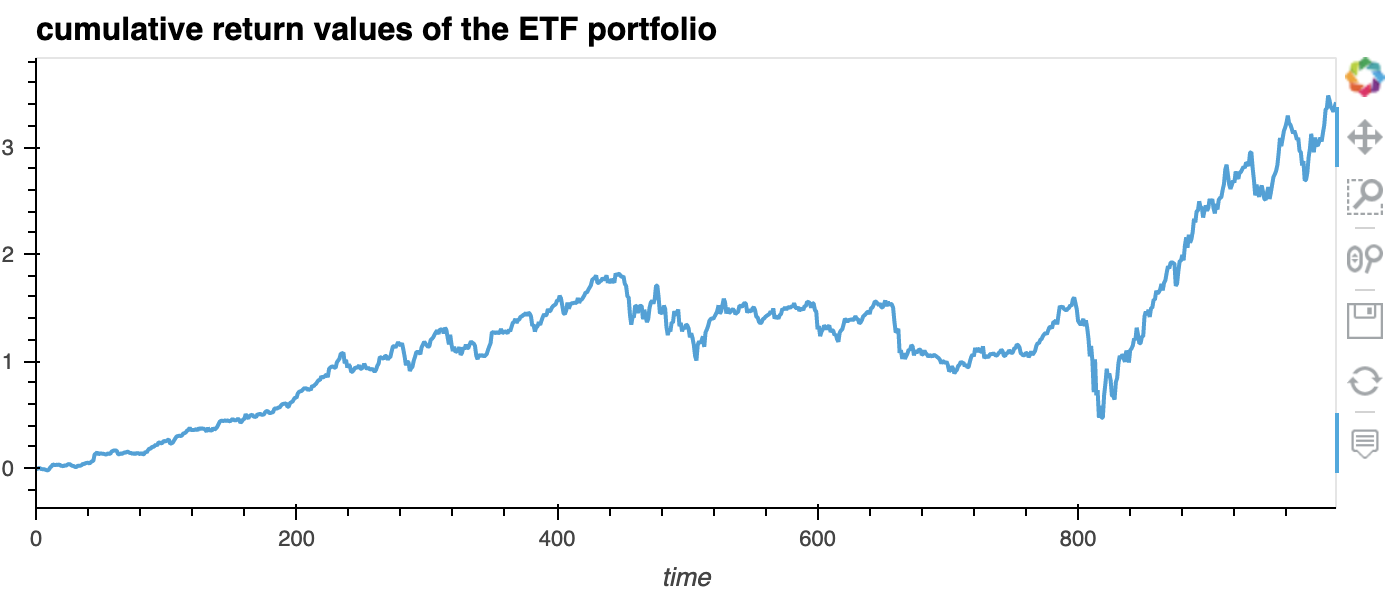
The application works by extracting data from etf.db using sqlite, use hvplot to show daily return, cumulative return and conditionally select certain data points and also analyze the portfolio as a whole.
This project leverages python 3.7 +, pandas, nsqlalchemyumpy, pathlib, hvplot
Before running the application, first make sure below libaries are installed
  pip install pandas
  pip install sqlalchemy
Alerternatively you can simply just install requirement file included in this folder
pip install -r requirement.txtStep 1: run etf_analyzer.ipynb
python etf_analyzer.ipynbStep 2: Create an interactive visualization with hvplot to plot the daily returns for PYPL.
Step 3: Create an interactive visaulization with hvplot to plot the cumulative returns for PYPL.
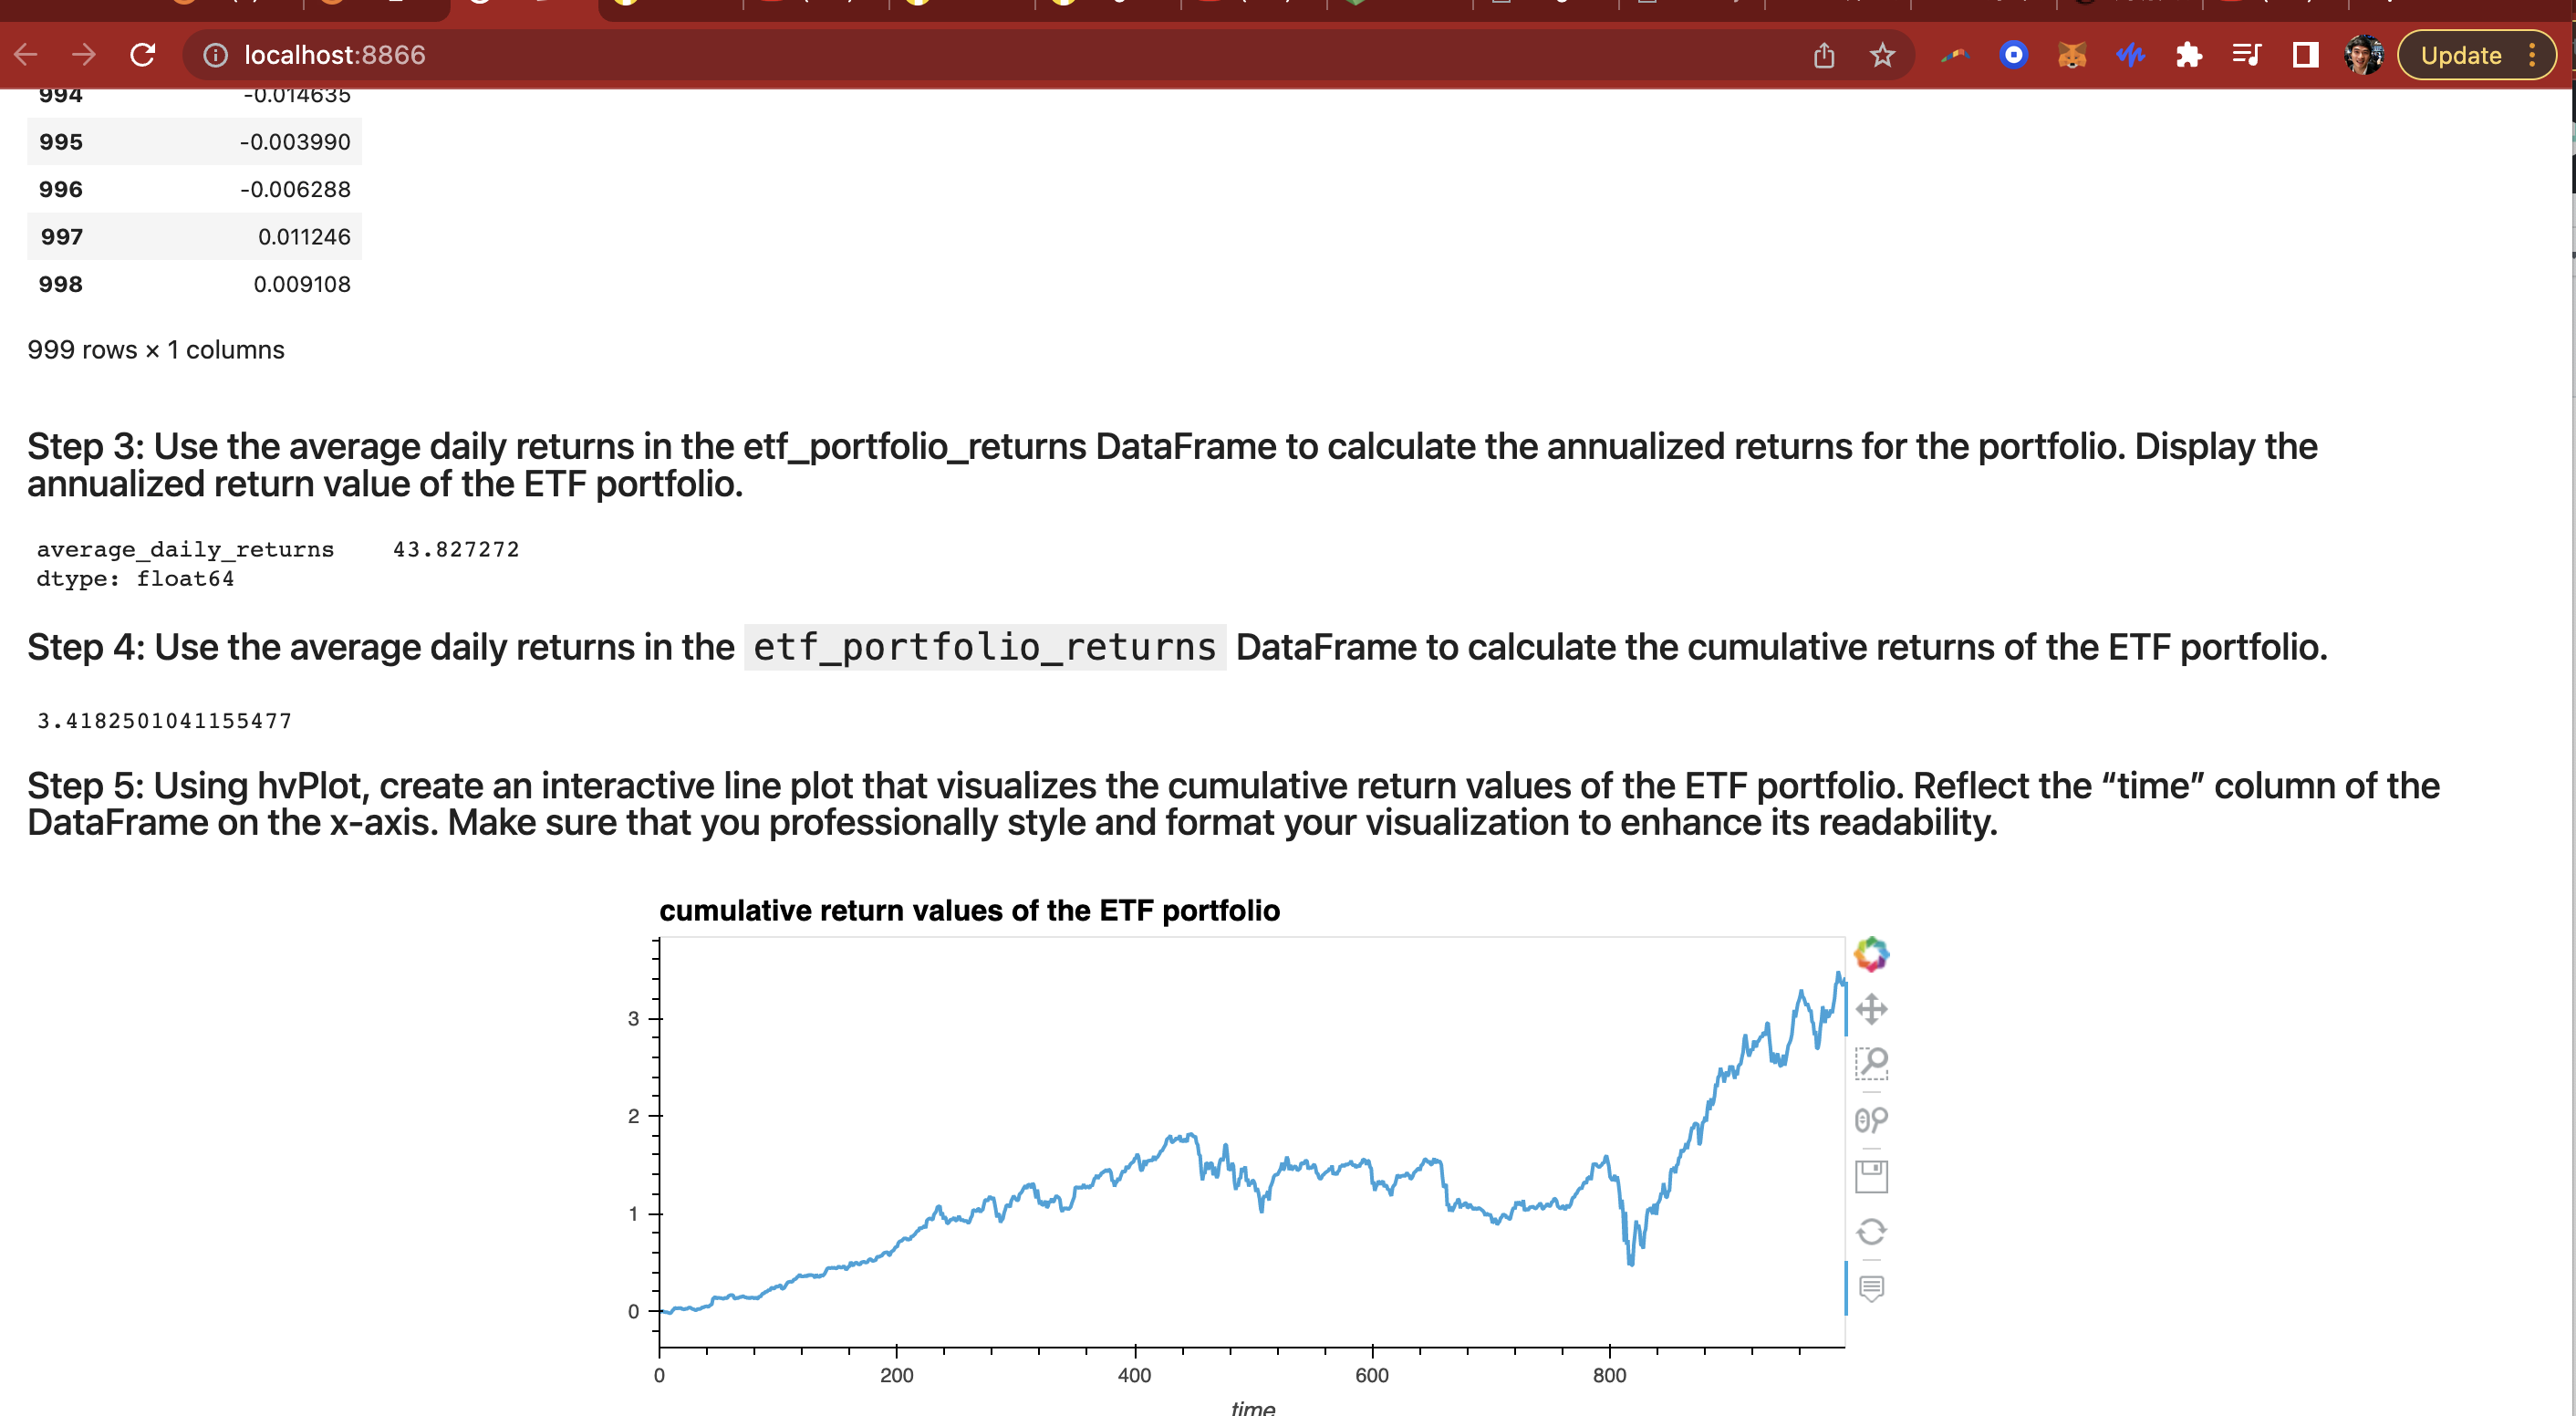
Step 4: Using hvplot, create an interactive line plot that visualizes the ETF portfolios cumulative return values.
Step 5: Take a screen recording or screenshots to show how the web application appears when using Voilà. Include the recording or screenshots in the README.md file for your GitHub repository.
Conclution:
SQL data base turns out to be a very useful tool to store, read, manipulate and visulize large quantity of data.
Brought to you by TaoNYC. connorchen7@gmail.com
Columbia Fintech Coding Bootcamp


