[github-actions.ci] Update pinned envs #27
Merged
Conversation
This file contains hidden or bidirectional Unicode text that may be interpreted or compiled differently than what appears below. To review, open the file in an editor that reveals hidden Unicode characters.
Learn more about bidirectional Unicode characters
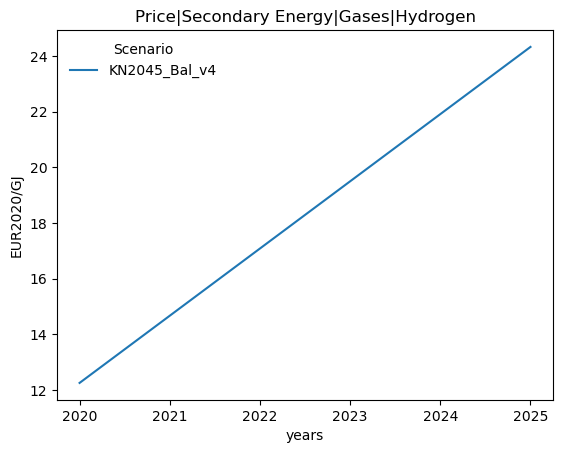
Validator ReportI am the Validator. Download all artifacts here. Ariadne Variables Comparison
NRMSE: Normalized (combined-min-max) Root Mean Square Error Plots
General Plots comparison
Files comparison
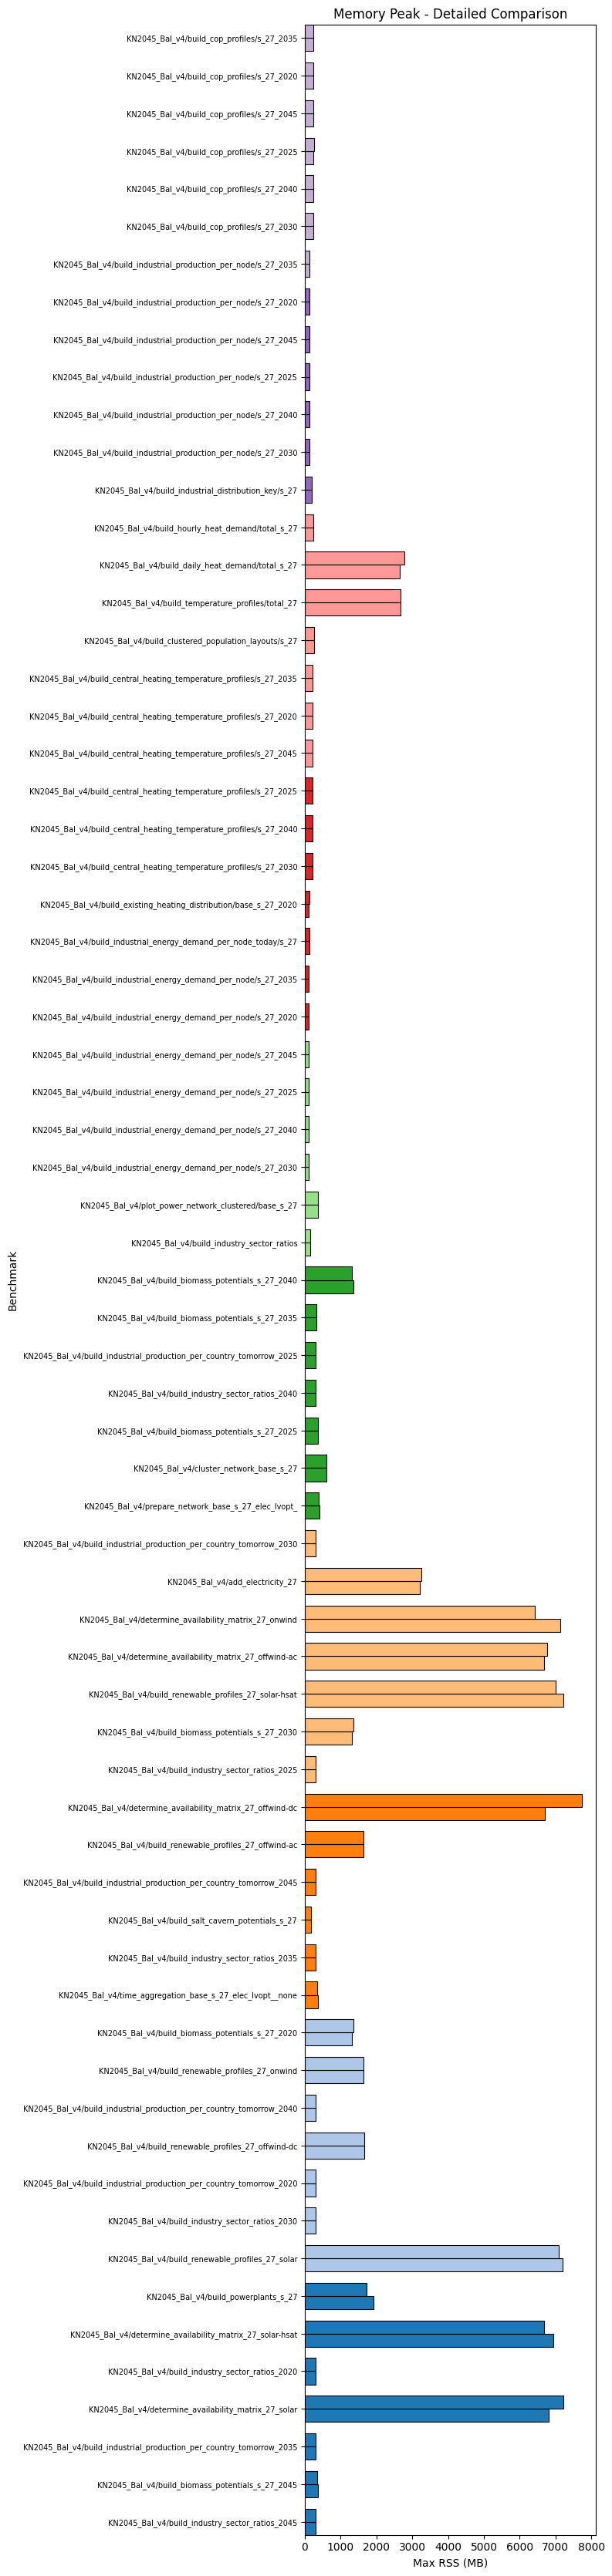
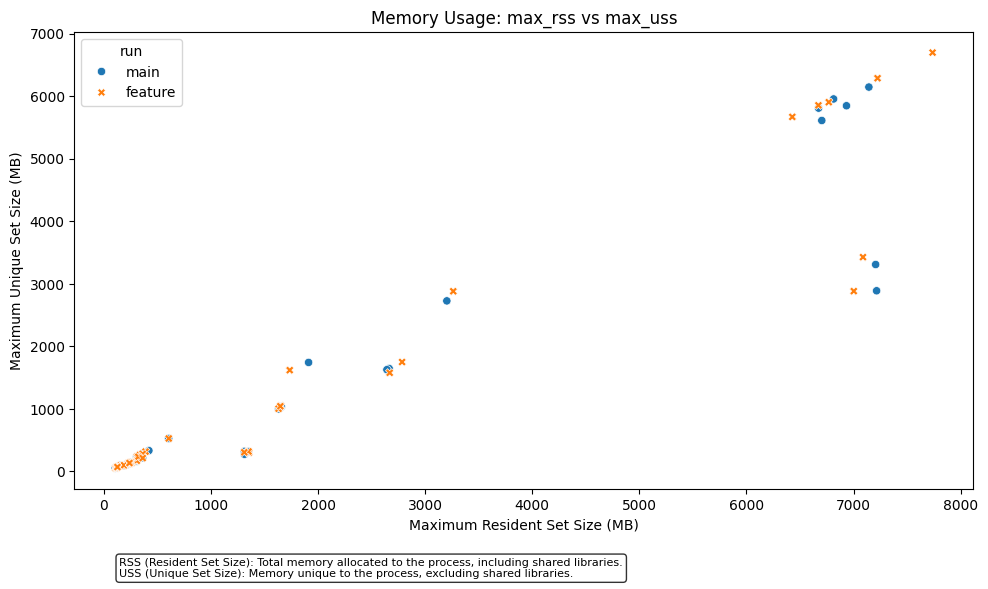
NRMSE: Normalized (combined-min-max) Root Mean Square Error Model Metrics Benchmarks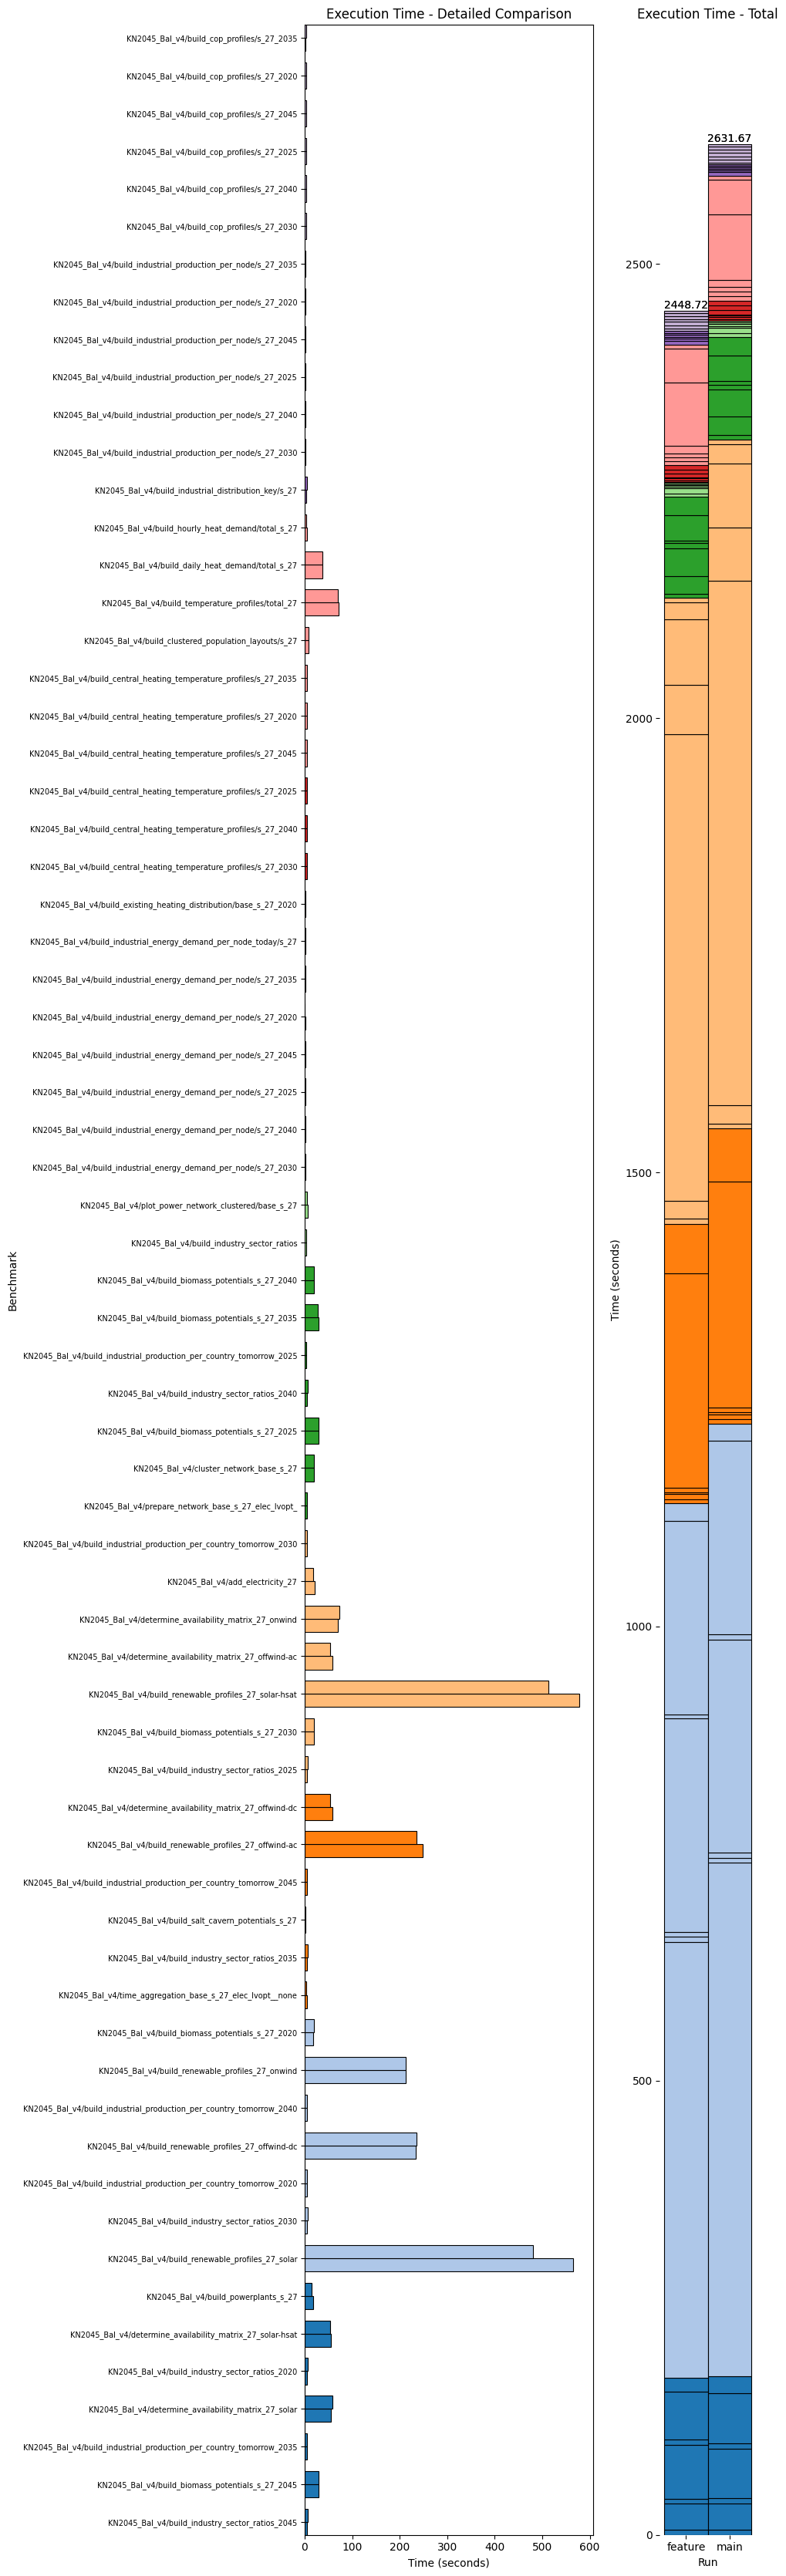
Comparing |


Sign up for free
to join this conversation on GitHub.
Already have an account?
Sign in to comment
1 participant
Add this suggestion to a batch that can be applied as a single commit.
This suggestion is invalid because no changes were made to the code.
Suggestions cannot be applied while the pull request is closed.
Suggestions cannot be applied while viewing a subset of changes.
Only one suggestion per line can be applied in a batch.
Add this suggestion to a batch that can be applied as a single commit.
Applying suggestions on deleted lines is not supported.
You must change the existing code in this line in order to create a valid suggestion.
Outdated suggestions cannot be applied.
This suggestion has been applied or marked resolved.
Suggestions cannot be applied from pending reviews.
Suggestions cannot be applied on multi-line comments.
Suggestions cannot be applied while the pull request is queued to merge.
Suggestion cannot be applied right now. Please check back later.
Automatically generated PR to update pinned environment files for Windows, macOS, and Linux.