This repository was archived by the owner on Mar 27, 2025. It is now read-only.
Force Onshore Wind to South Germany #298
Merged
Conversation
This file contains hidden or bidirectional Unicode text that may be interpreted or compiled differently than what appears below. To review, open the file in an editor that reveals hidden Unicode characters.
Learn more about bidirectional Unicode characters
lindnemi
reviewed
Dec 4, 2024
Validator ReportI am the Validator. Download all artifacts here.
|
| NRMSE | Pearson | |
|---|---|---|
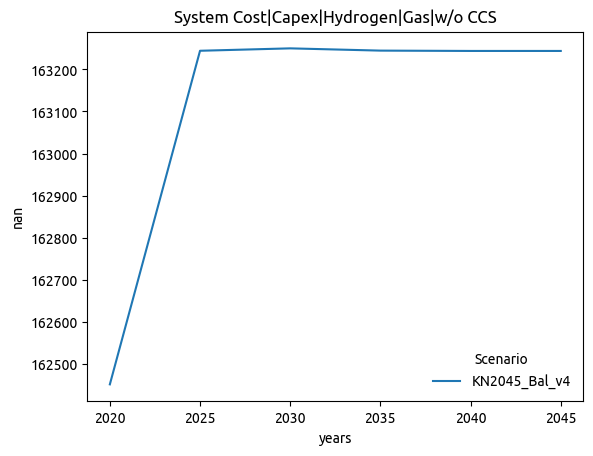
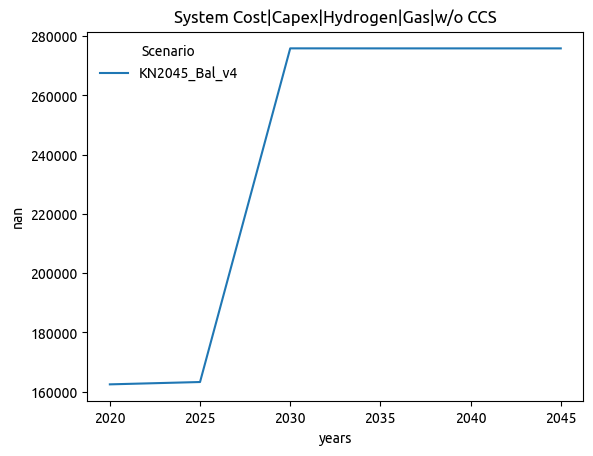
| System Cost|Capex|Hydrogen|Gas|w/o CCS | 0.811 | 0.637 |
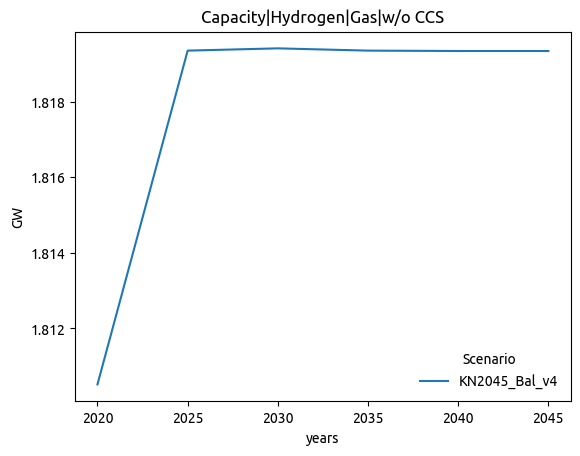
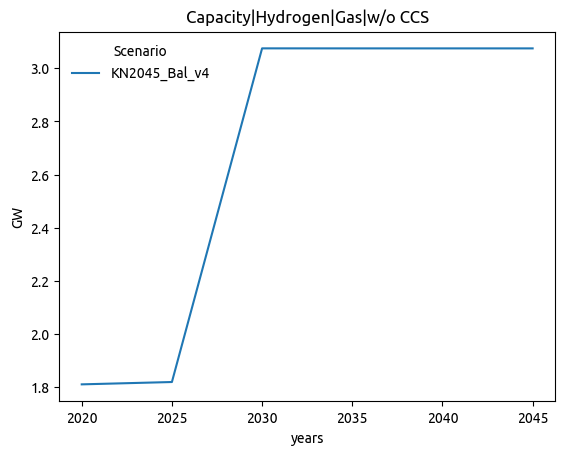
| Capacity|Hydrogen|Gas|w/o CCS | 0.811 | 0.637 |
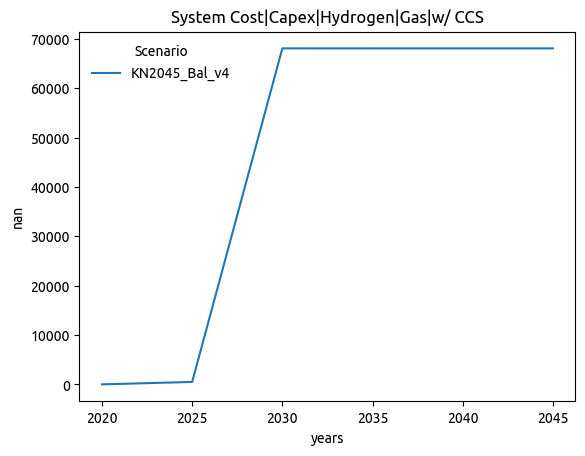
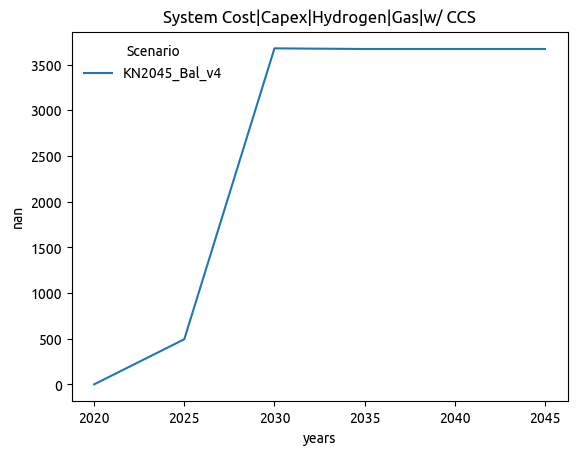
| System Cost|Capex|Hydrogen|Gas|w/ CCS | 0.772 | 0.997 |
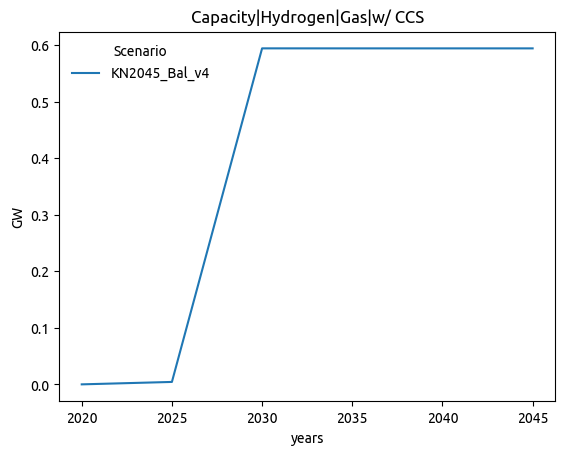
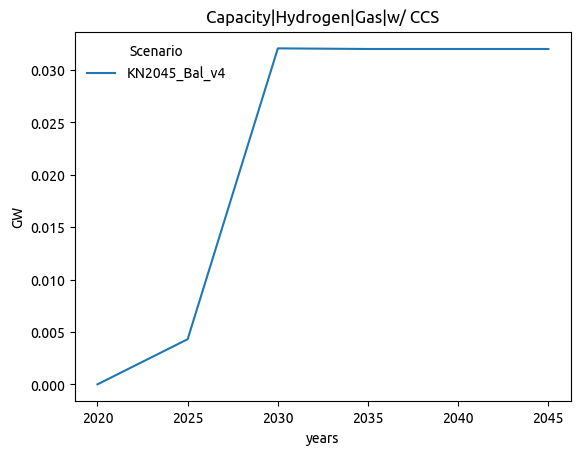
| Capacity|Hydrogen|Gas|w/ CCS | 0.772 | 0.996 |
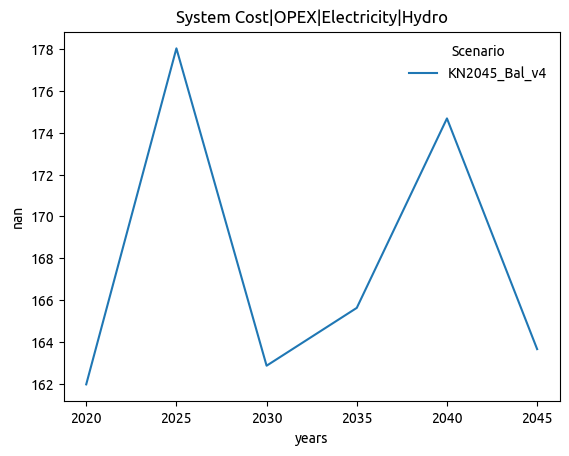
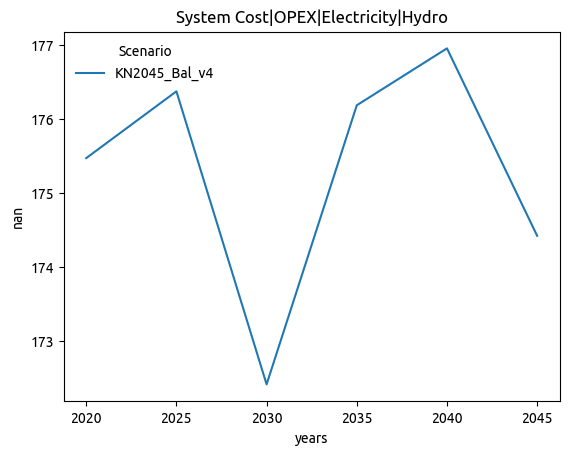
| System Cost|OPEX|Electricity|Hydro | 0.573 | 0.659 |
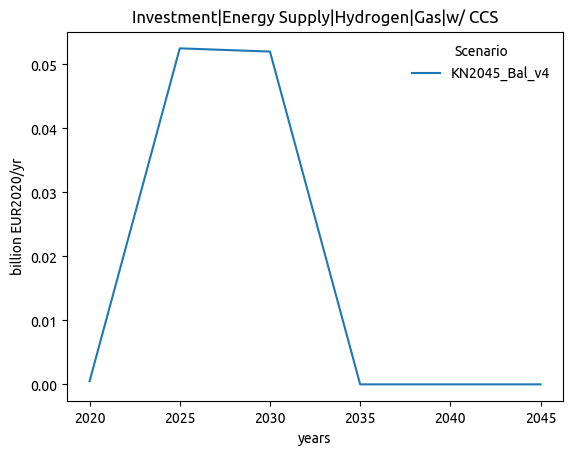
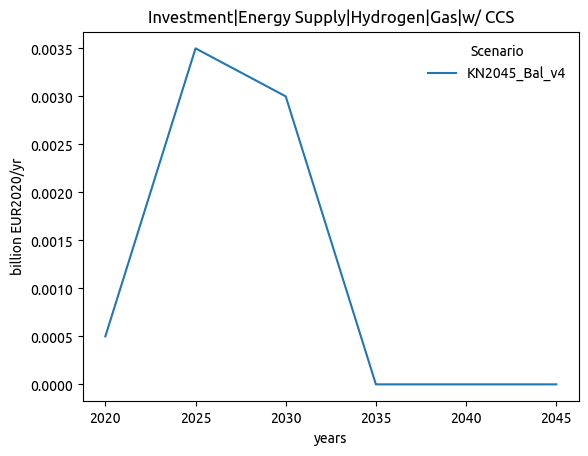
| Investment|Energy Supply|Hydrogen|Gas|w/ CCS | 0.539 | 0.990 |
| System Cost|OPEX|Electricity|Storage Converter|Hydro Dam Reservoir | 0.473 | -0.379 |
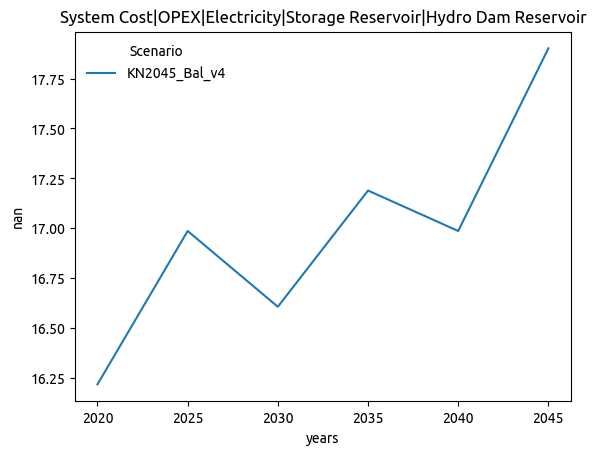
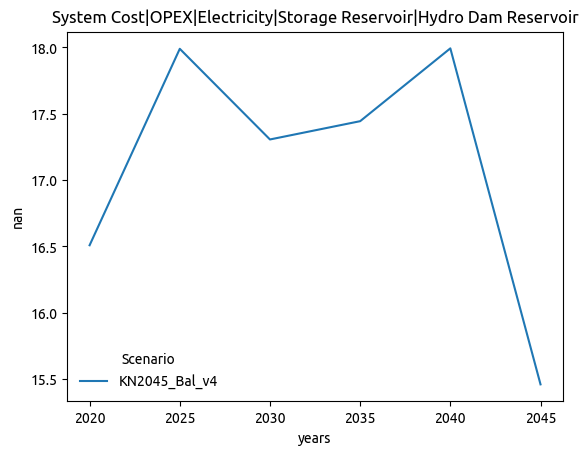
| System Cost|OPEX|Electricity|Storage Reservoir|Hydro Dam Reservoir | 0.473 | -0.379 |
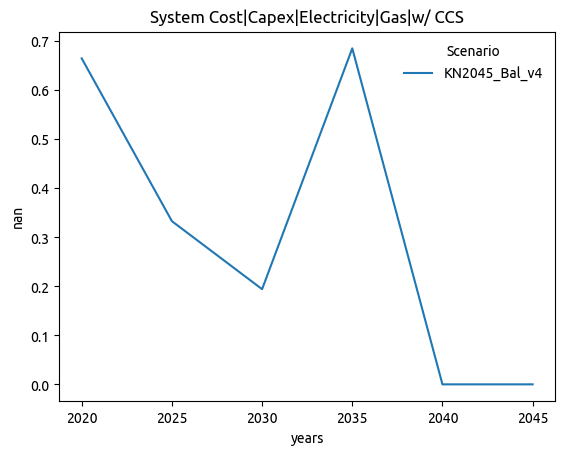
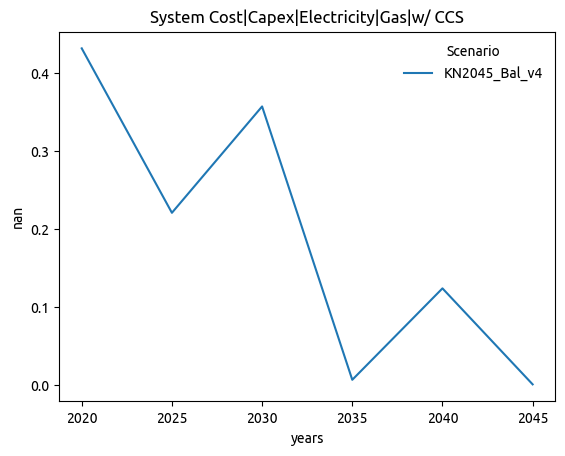
| System Cost|Capex|Electricity|Gas|w/ CCS | 0.450 | 0.280 |
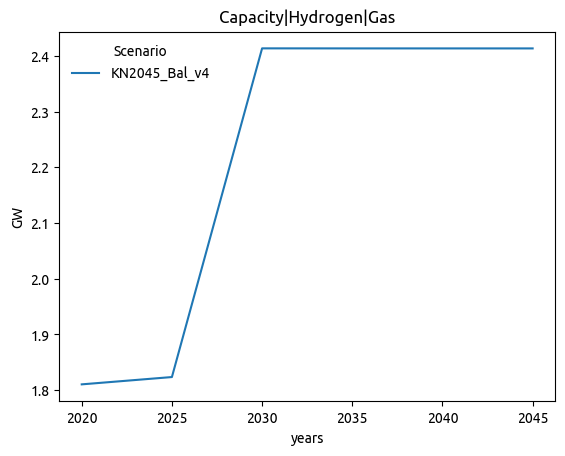
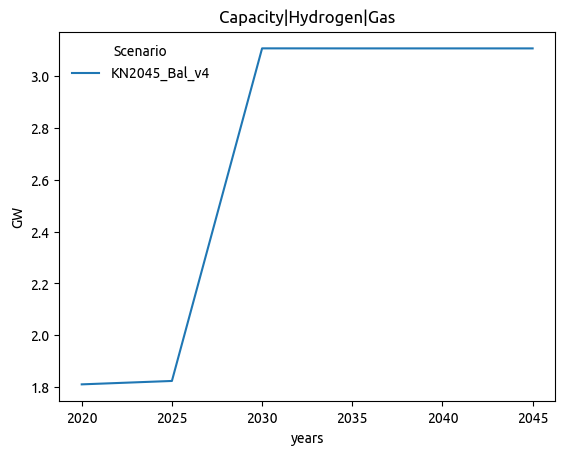
| Capacity|Hydrogen|Gas | 0.437 | 1.000 |
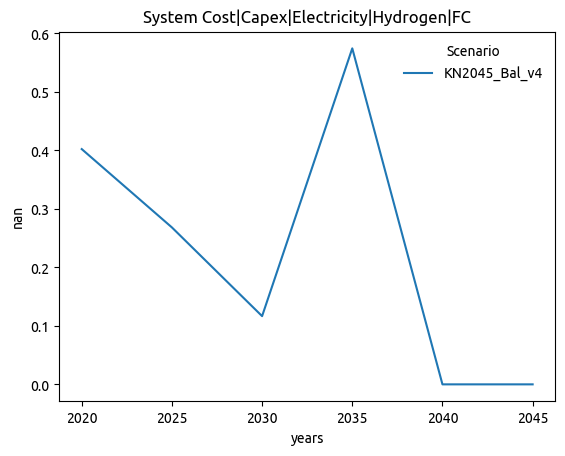
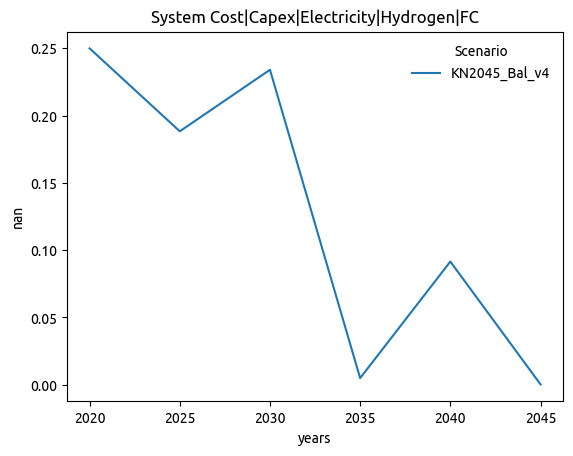
| System Cost|Capex|Electricity|Hydrogen|FC | 0.436 | 0.052 |
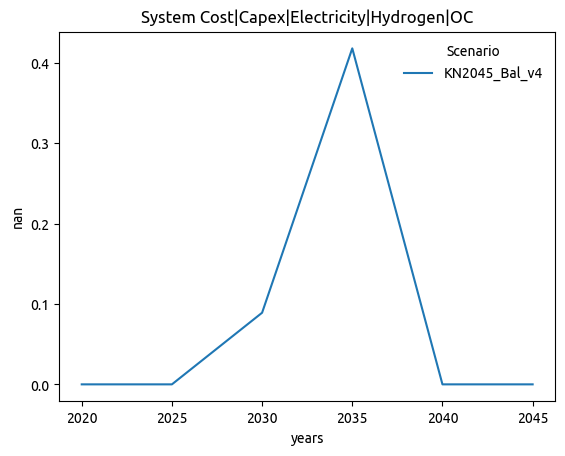
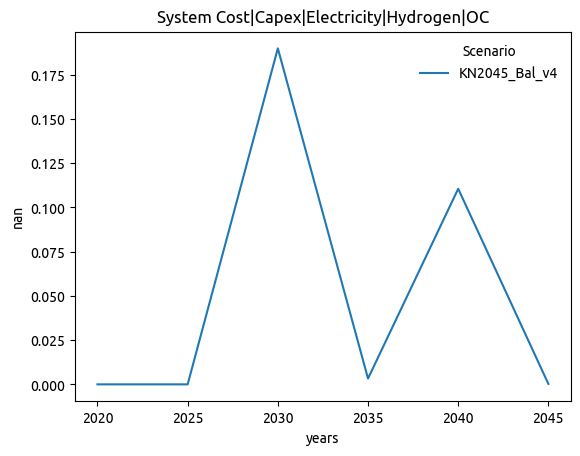
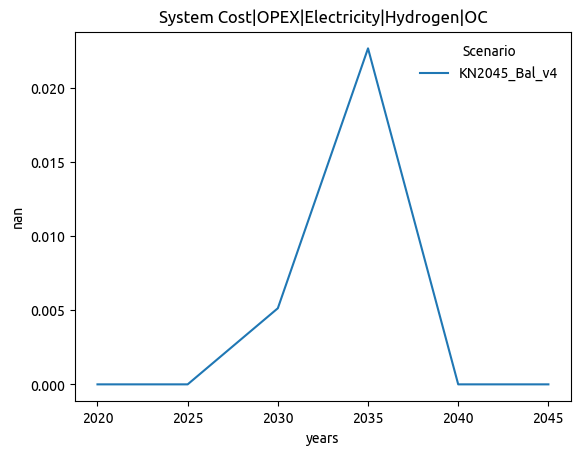
| System Cost|Capex|Electricity|Hydrogen|OC | 0.431 | -0.109 |
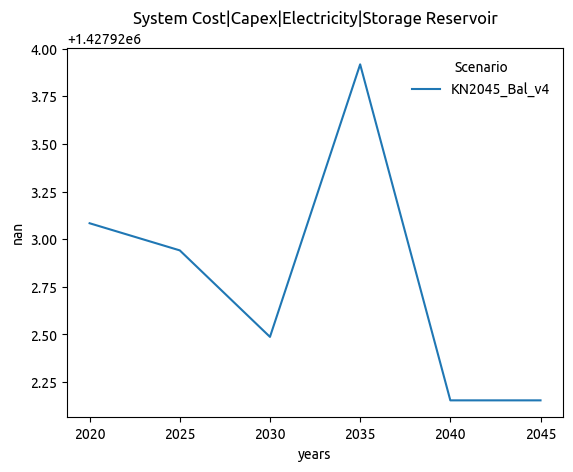
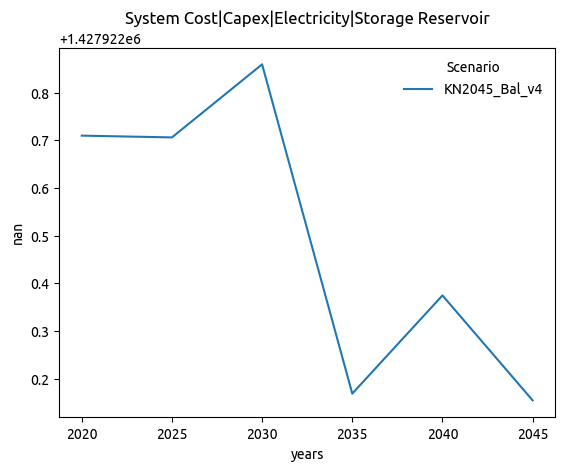
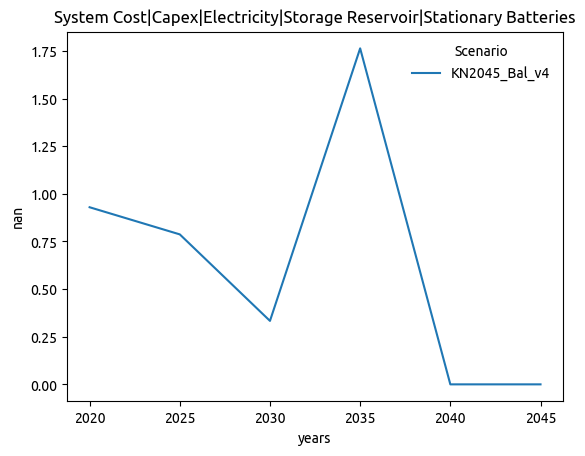
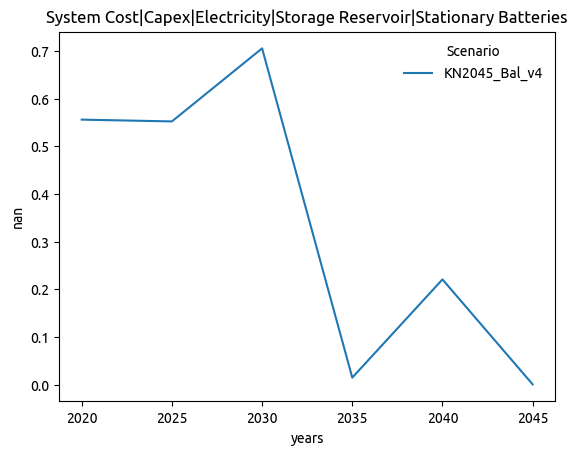
| System Cost|Capex|Electricity|Storage Reservoir | 0.429 | -0.088 |
| System Cost|Capex|Electricity|Storage Reservoir|Stationary Batteries | 0.429 | -0.088 |
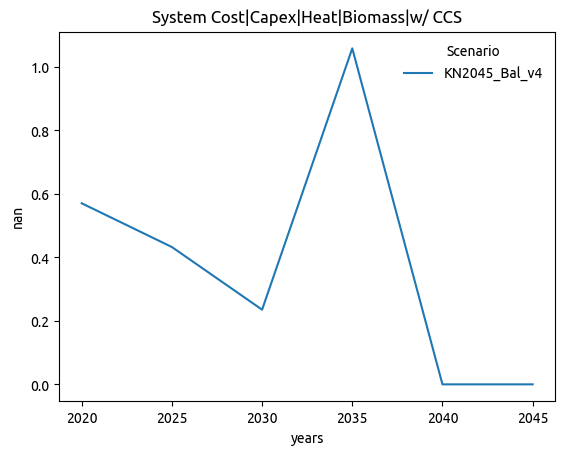
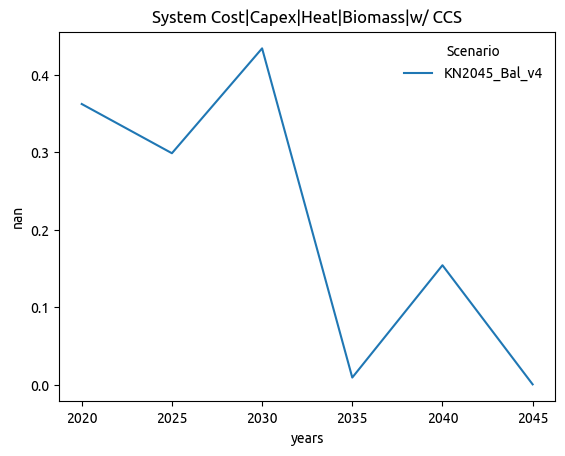
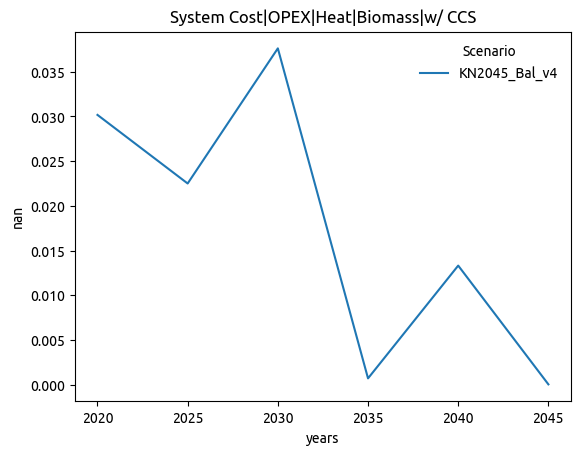
| System Cost|Capex|Heat|Biomass|w/ CCS | 0.427 | -0.092 |
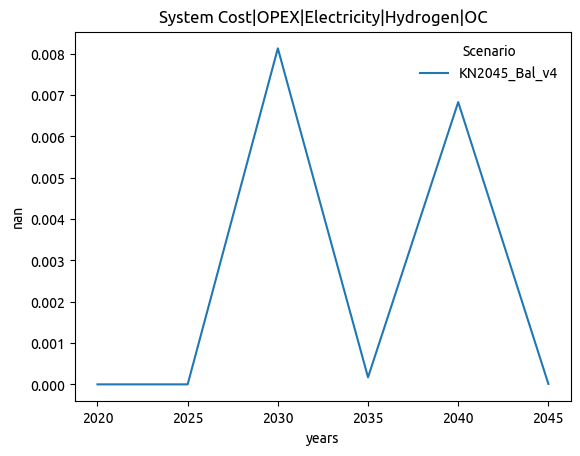
| System Cost|OPEX|Electricity|Hydrogen|OC | 0.427 | -0.140 |
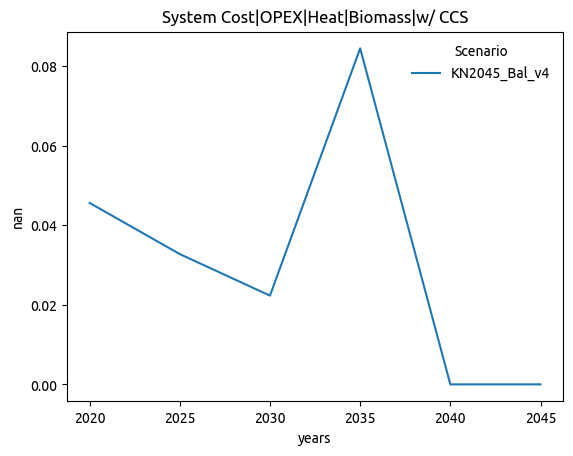
| System Cost|OPEX|Heat|Biomass|w/ CCS | 0.426 | -0.084 |
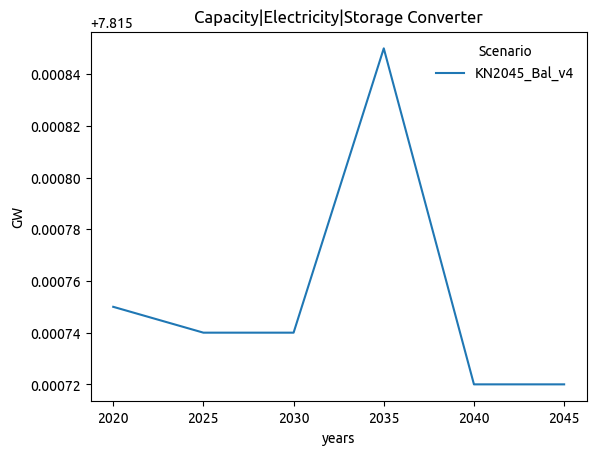
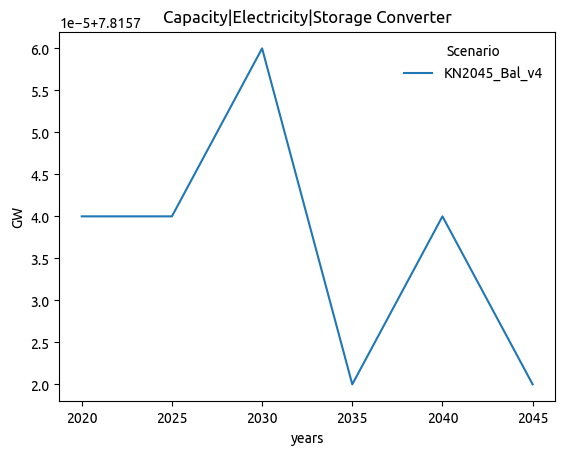
| Capacity|Electricity|Storage Converter | 0.419 | -0.417 |
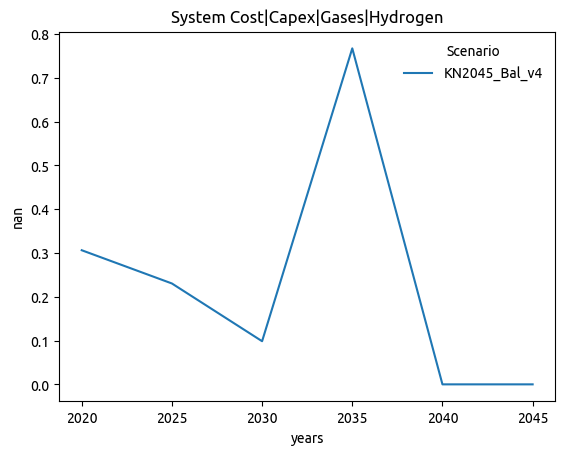
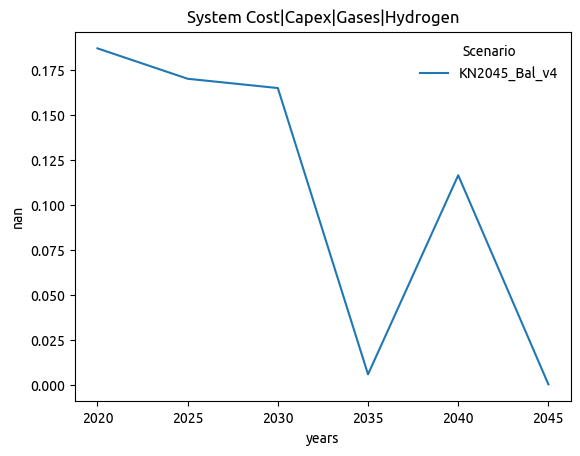
| System Cost|Capex|Gases|Hydrogen | 0.418 | -0.275 |
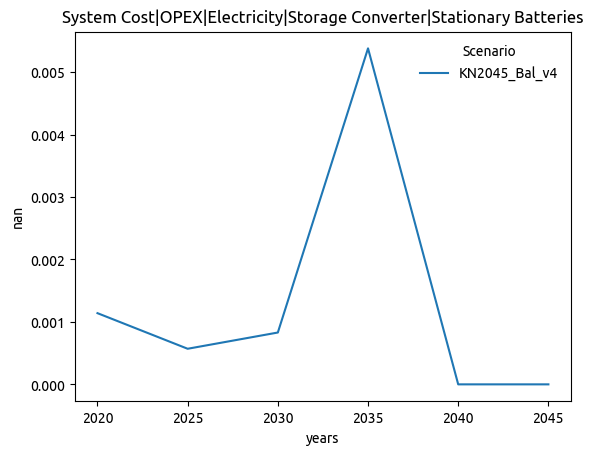
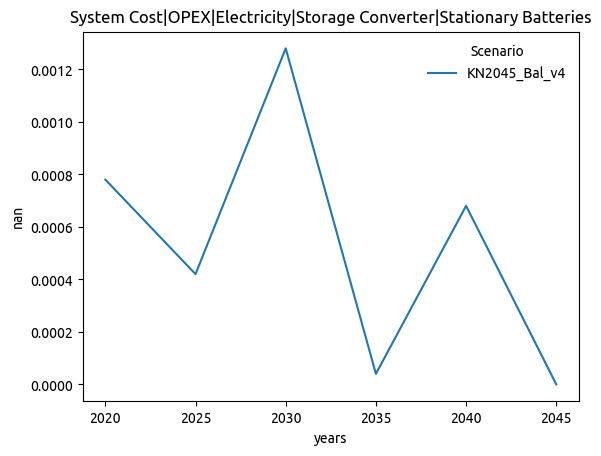
| System Cost|OPEX|Electricity|Storage Converter|Stationary Batteries | 0.411 | -0.367 |
| Secondary Energy|Electricity|Hydro | 0.411 | -0.196 |
| Capacity|Electricity|Gas|OC | 0.408 | 0.000 |
| Price|Secondary Energy|Gases|Hydrogen | 0.405 | 0.000 |
| System Cost|OPEX|Hydrogen|Gas|w/ CCS | 0.397 | 0.976 |
| Capacity Additions|Hydrogen|Gas|w/ CCS | 0.386 | 0.992 |
| System Cost|OPEX|Electricity|Storage Converter | 0.361 | 0.434 |
| System Cost|OPEX|Electricity|Storage Reservoir | 0.361 | 0.434 |
| System Cost|Capex|Hydrogen|Gas | 0.336 | 1.000 |
| Capacity Additions|Electricity|Wind|Offshore | 0.302 | 0.581 |
| Investment|Energy Supply|Electricity|Transmission|AC|Offshore | 0.290 | 0.820 |
| Capacity Additions|Hydrogen|Gas|w/o CCS | 0.283 | 0.785 |
| Investment|Energy Supply|Electricity|Wind Offshore | 0.269 | 0.880 |
| Investment|Energy Supply|Electricity|Wind|Offshore | 0.269 | 0.880 |
| Investment|Energy Supply|Liquids|Biomass | 0.260 | 1.000 |
| Investment|Energy Supply|Electricity|Transmission|Offshore | 0.252 | 0.893 |
| Investment|Energy Supply|Electricity|Transmission|DC|Offshore | 0.249 | 0.904 |
| Capacity Additions|Electricity|Wind|Onshore | 0.244 | 0.791 |
| Secondary Energy|Electricity|Wind|Offshore | 0.243 | 0.976 |
| System Cost|OPEX|Electricity|Gas|w/ CCS | 0.238 | 0.789 |
| System Cost|Capex|Electricity|Wind|Offshore | 0.236 | 0.978 |
| Capacity|Electricity|Wind|Offshore | 0.234 | 0.978 |
| System Cost|Capex|Electricity|Gas|OC | 0.215 | 0.837 |
| Secondary Energy|Electricity|Wind|Onshore | 0.212 | 0.986 |
| Investment|Energy Supply|Hydrogen|Gas|w/o CCS | 0.200 | 0.900 |
| Capacity|Hydrogen | 0.199 | 0.993 |
| System Cost|Capex|Electricity|Wind|Onshore | 0.195 | 0.985 |
| Capacity|Electricity|Wind|Onshore | 0.191 | 0.985 |
| Secondary Energy|Hydrogen | 0.191 | 0.928 |
| Investment|Energy Supply|Electricity|Wind Onshore | 0.185 | 0.951 |
| Investment|Energy Supply|Electricity|Wind|Onshore | 0.185 | 0.951 |
| System Cost|OPEX|Liquids|Biomass | 0.184 | 1.000 |
| System Cost|Capex|Liquids|Biomass | 0.183 | 1.000 |
| Capacity Additions|Liquids|Biomass | 0.183 | 1.000 |
| Capacity|Liquids|Biomass | 0.183 | 1.000 |
| Investment|Energy Supply|Electricity|Transmission|DC | 0.178 | 0.922 |
| System Cost|OPEX|Electricity|Wind|Offshore | 0.175 | 0.995 |
| Primary Energy|Oil|Electricity | 0.173 | 0.917 |
| Capacity Additions|Electricity|Solar|PV|Open Field | 0.164 | 0.901 |
| Investment|Energy Supply|Hydrogen|Electrolysis | 0.163 | 0.947 |
| Investment|Energy Supply|Hydrogen|Electricity | 0.163 | 0.947 |
| Secondary Energy|Hydrogen|Electricity | 0.161 | 0.970 |
| Secondary Energy Input|Electricity|Hydrogen | 0.158 | 0.970 |
| Capacity Additions|Hydrogen|Gas | 0.156 | 0.939 |
| Capacity|Hydrogen|Electricity | 0.155 | 0.987 |
| System Cost|Capex|Hydrogen | 0.153 | 0.990 |
| Capacity|Electricity|Transmission|AC | 0.146 | 0.997 |
| Investment|Energy Supply|Heat|Gas | 0.145 | 0.940 |
| System Cost|Capex|Hydrogen|Electricity | 0.143 | 0.988 |
| Capacity Additions|Hydrogen|Electricity | 0.142 | 0.951 |
| System Cost|OPEX|Electricity|Wind|Onshore | 0.139 | 0.997 |
| Investment|Energy Supply|Electricity|Transmission | 0.134 | 0.965 |
| Price|Secondary Energy|Gases|Biomass | 0.134 | 0.000 |
| Emissions|CO2|Energy|Supply|Hydrogen | 0.131 | 0.964 |
| Emissions|Gross Fossil CO2|Energy|Supply|Hydrogen | 0.131 | 0.964 |
| Investment|Energy Supply|Electricity|Solar|PV|Open Field | 0.128 | 0.947 |
| Capacity Additions|Hydrogen | 0.123 | 0.971 |
| Investment|Energy Supply|Hydrogen|Transmission and Distribution|Endogen|New-build | 0.121 | 0.996 |
| System Cost|OPEX|Hydrogen | 0.120 | 0.976 |
| Capacity Additions|Heat|Processes | 0.118 | 0.978 |
| Capacity Additions|Heat|Gas | 0.116 | 0.962 |
| Trade|Secondary Energy|Electricity|Volume | 0.116 | 0.994 |
| Capacity Additions|Electricity|Wind | 0.115 | 0.964 |
| Investment|Energy Supply|Electricity|Biomass|Solids | 0.111 | 0.977 |
| Investment|Energy Supply|Electricity|Biomass | 0.111 | 0.977 |
| Investment|Energy Supply|Electricity|Biomass|w/o CCS | 0.111 | 0.977 |
| System Cost|OPEX|Hydrogen|Electricity | 0.109 | 0.996 |
| System Cost|Capex|Heat|Processes | 0.107 | 0.996 |
| Secondary Energy|Electricity|Curtailment | 0.104 | 0.993 |
| Capacity|Heat|Processes | 0.102 | 0.997 |
NRMSE: Normalized (combined-min-max) Root Mean Square Error
Pearson: Pearson correlation coefficient
Threshold: NRMSE > 0.1
Only variables reaching the threshold are shown. Find the equivalent plot for all of them below.
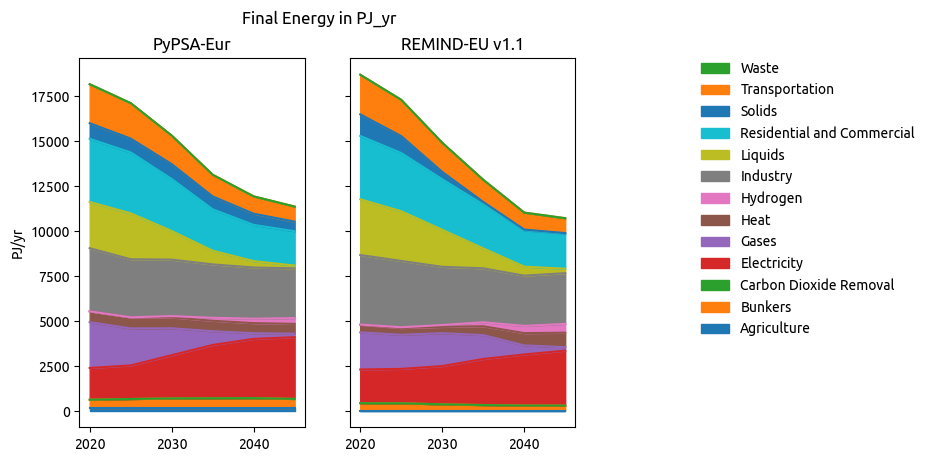
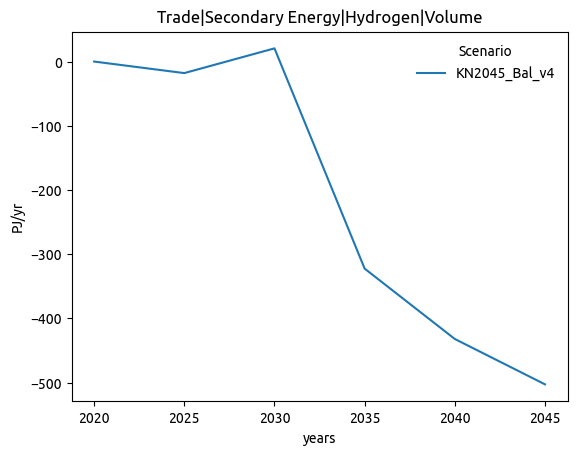
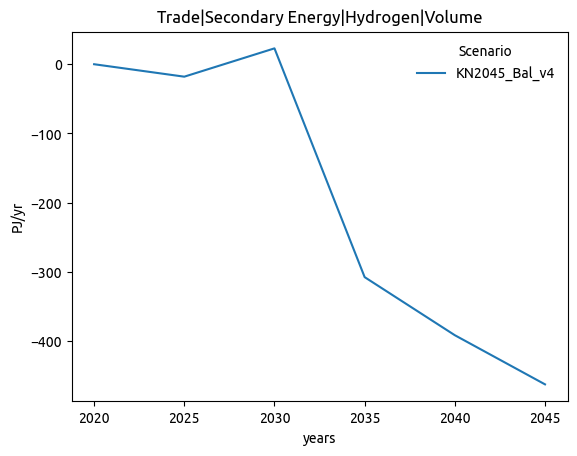
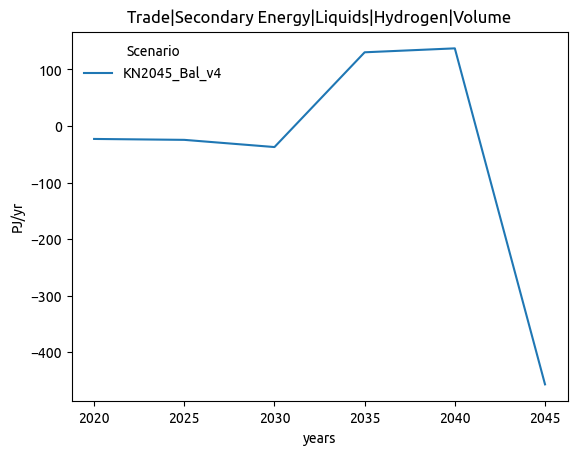
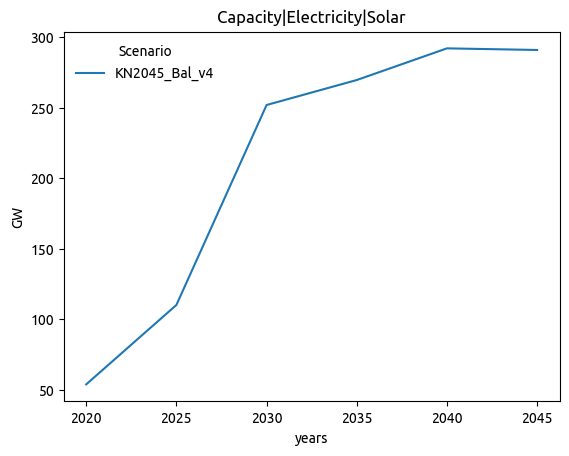
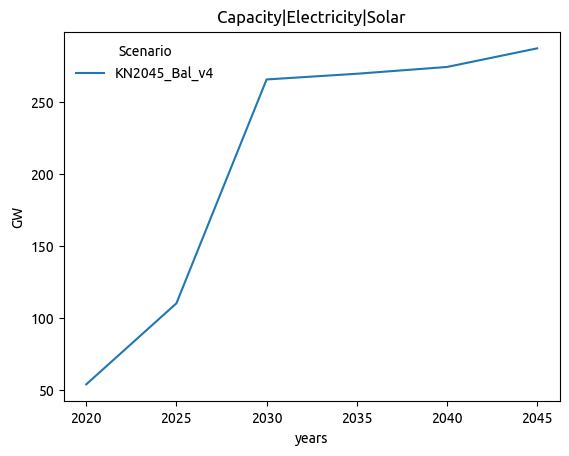
Plots
| Main branch | Feature branch |
|---|---|
 |
 |
 |
 |
 |
 |
 |
 |
 |
 |
 |
 |
 |
 |
 |
 |
 |
 |
 |
 |
 |
 |
 |
 |
 |
 |
 |
 |
 |
 |
 |
 |
 |
 |
 |
 |
 |
 |
 |
 |
General
Plots comparison
| Main branch | Feature branch |
|---|---|
 |
 |
 |
 |
 |
 |
 |
 |
 |
 |
 |
 |
Files comparison
| Status | NRMSE | MAE (norm) | |
|---|---|---|---|
| csvs/prices.csv | 0.003 | 0.09 | |
| csvs/curtailment.csv | 0.000 | 0.20 | |
| csvs/price_statistics.csv | 0.016 | 0.24 | |
| csvs/cumulative_cost.csv | 0.000 | 0.09 | |
| csvs/metrics.csv | 0.001 | 0.08 | |
| csvs/nodal_cfs.csv | ✅ Almost equal | 0.027 | 0.00 |
| csvs/supply.csv | ✅ Almost equal | 0.002 | 0.01 |
| csvs/nodal_supply_energy.csv | ✅ Almost equal | 0.000 | 0.00 |
| csvs/capacities.csv | ✅ Almost equal | 0.000 | 0.00 |
| csvs/nodal_costs.csv | ✅ Almost equal | 0.001 | 0.00 |
| csvs/market_values.csv | ✅ Almost equal | 0.056 | 0.02 |
| csvs/nodal_capacities.csv | ✅ Almost equal | 0.000 | 0.00 |
| csvs/cfs.csv | ✅ Almost equal | 0.040 | 0.00 |
| csvs/costs.csv | ✅ Almost equal | 0.004 | 0.01 |
| csvs/supply_energy.csv | ✅ Almost equal | 0.001 | 0.01 |
| csvs/energy.csv | ✅ Almost equal | 0.002 | 0.01 |
| csvs/weighted_prices.csv | ✅ Equal |
NRMSE: Normalized (combined-min-max) Root Mean Square Error
MAE (norm): Mean Absolute Error on normalized data (min-max)
Status Threshold: MAE (norm) > 0.05 and NRMSE > 0.3
Model Metrics
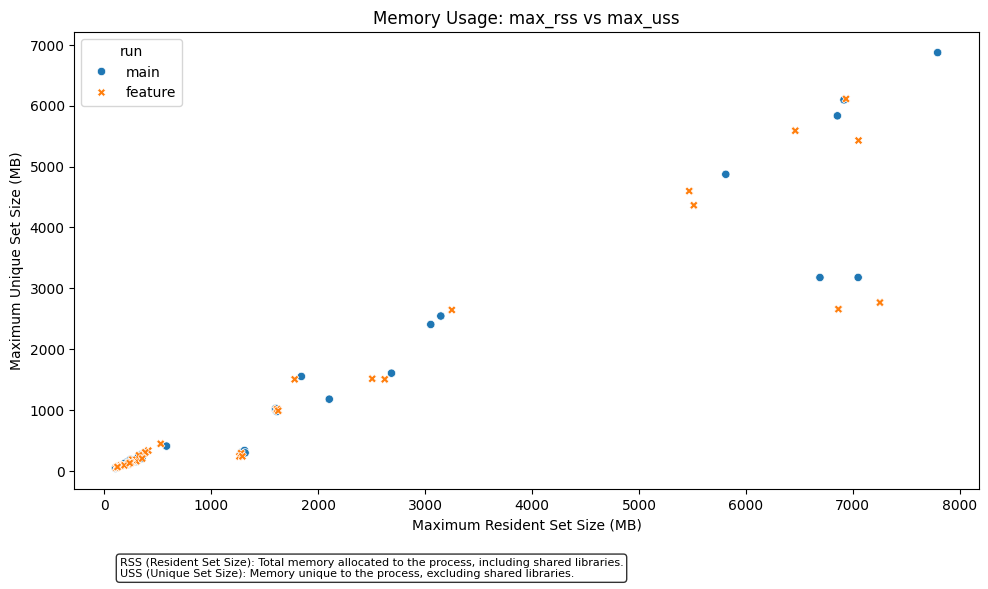
Benchmarks
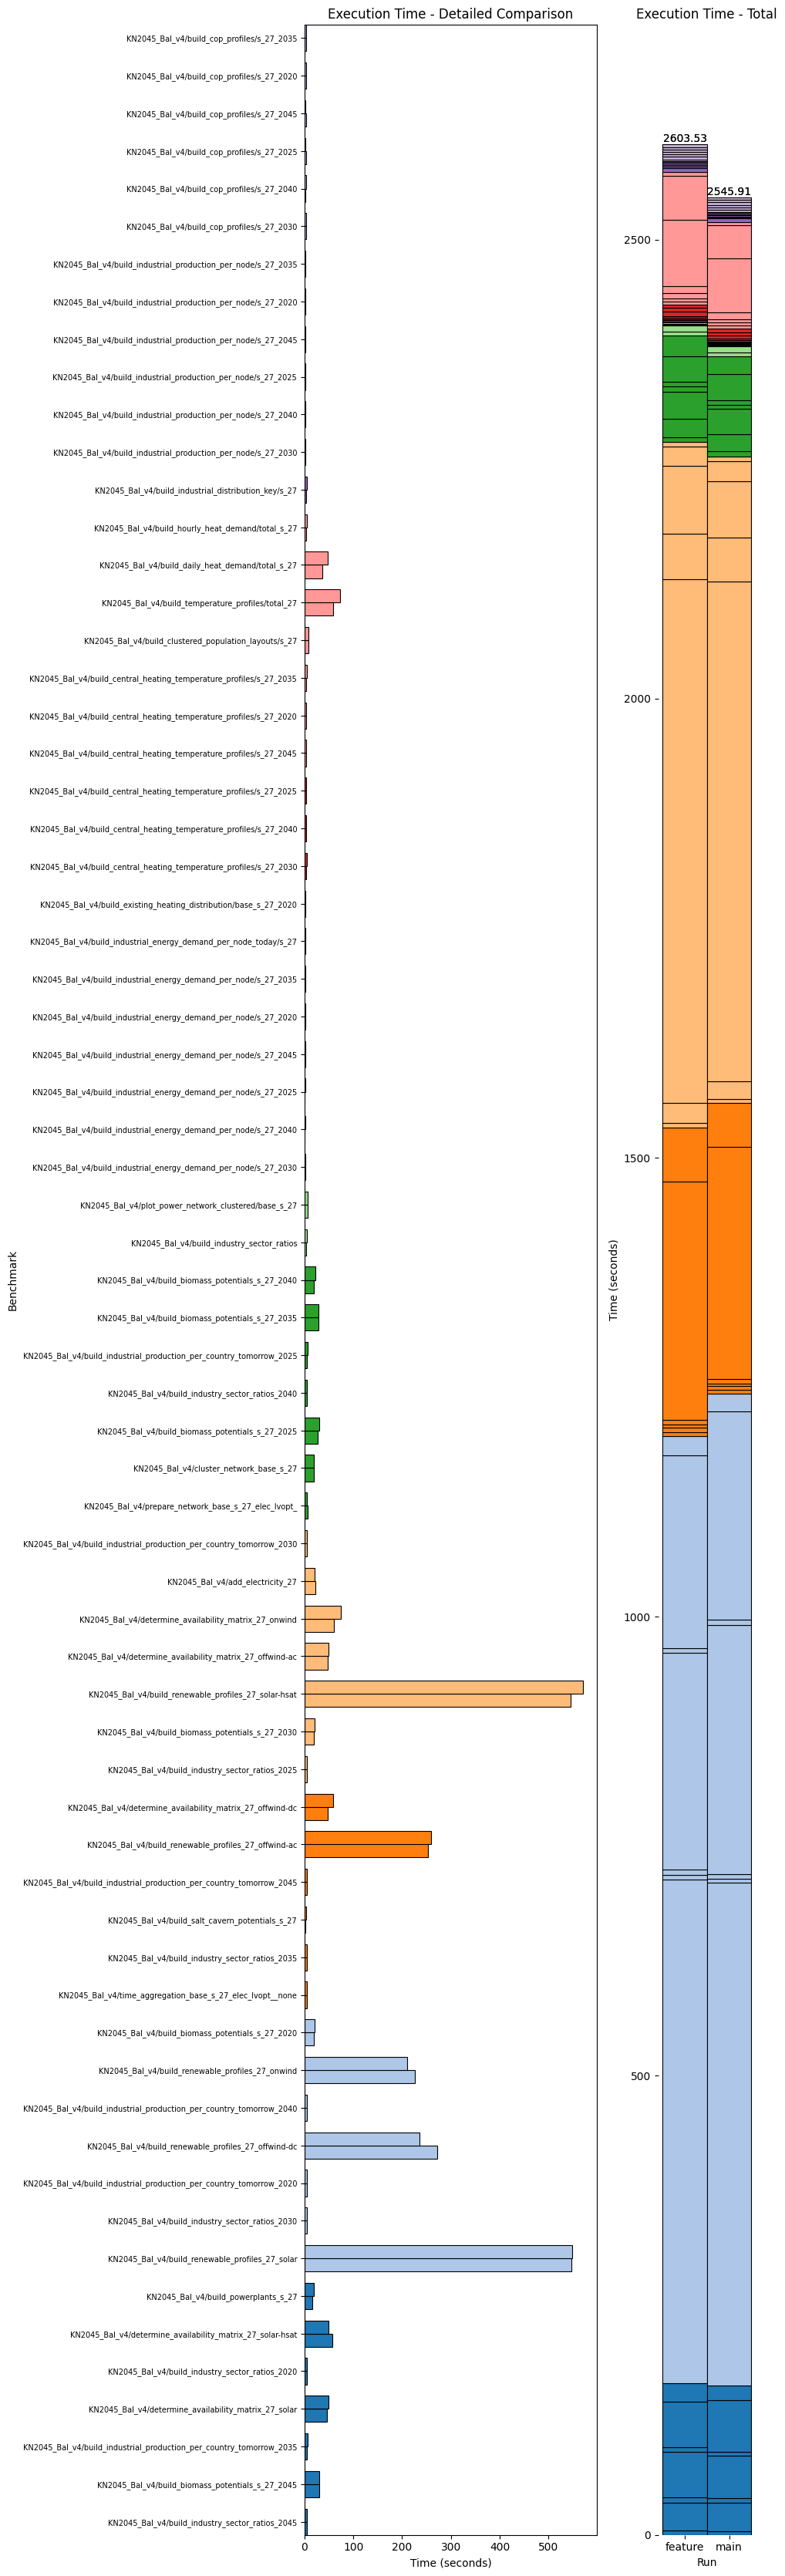
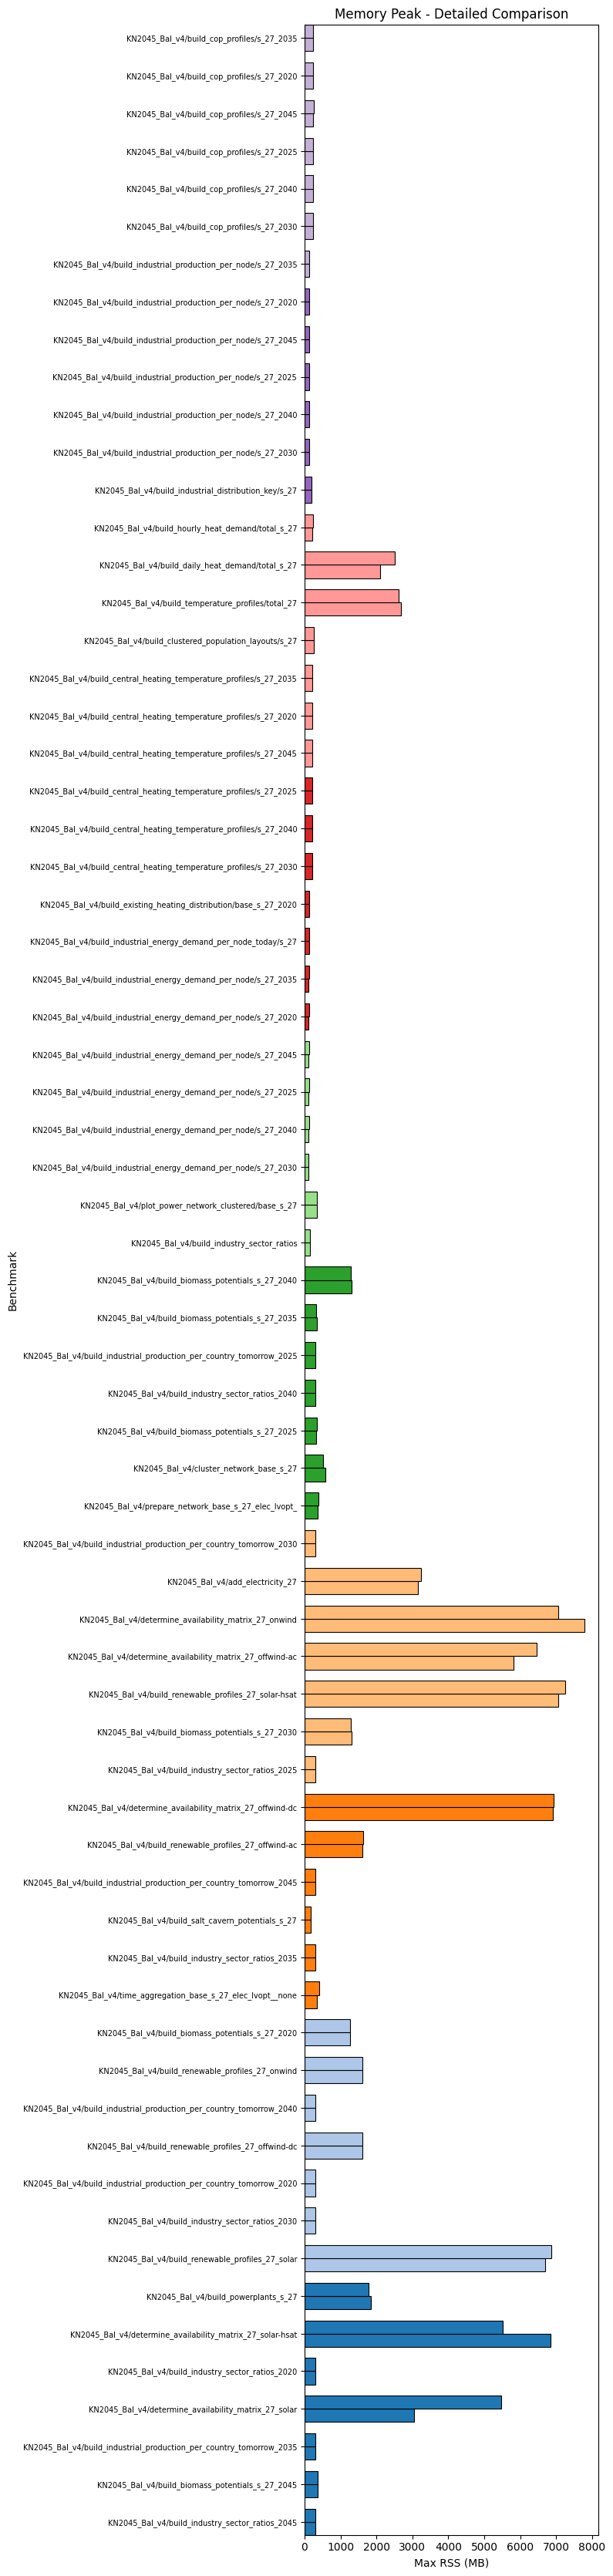
Comparing force_onwind_south (62efdb5) with main (8b696f9).
Branch is 7 commits ahead and 0 commits behind.
Last updated on 2024-12-05 11:56:25 CET.
for more information, see https://pre-commit.ci
Sign up for free
to subscribe to this conversation on GitHub.
Already have an account?
Sign in.
2 participants
Add this suggestion to a batch that can be applied as a single commit.
This suggestion is invalid because no changes were made to the code.
Suggestions cannot be applied while the pull request is closed.
Suggestions cannot be applied while viewing a subset of changes.
Only one suggestion per line can be applied in a batch.
Add this suggestion to a batch that can be applied as a single commit.
Applying suggestions on deleted lines is not supported.
You must change the existing code in this line in order to create a valid suggestion.
Outdated suggestions cannot be applied.
This suggestion has been applied or marked resolved.
Suggestions cannot be applied from pending reviews.
Suggestions cannot be applied on multi-line comments.
Suggestions cannot be applied while the pull request is queued to merge.
Suggestion cannot be applied right now. Please check back later.
Problem
So far little to no onshore wind is built in the South of Germany. However, this does not represent the political targets.

Solution
By forcing more onshore wind in Germany while reducing the capacity per sqkm, onshore wind is pushed into the South of Germany. Different configs were tested:
total potential in Germany: 242.4 GW
total installed onshore capacity 161.249 GW
total potential in Germany: 242.4 GW
total installed onshore capacity 180 GW
total potential in Germany: 202.0 GW
total installed onshore capacity 130 GW
A Flächenziel for each bus region or different regions was investigated in a closed PR but did not lead to the desired behavior.
The config of a minimum target of 160 GW in the main and plus scenarios together with 1.4 cap_per_sqkm is chosen, since the 160 GW are a political target for 2040 and there is a installed capacity of > 20 GW in Southern Germany. A high resolution run for 2045 also shows a total installed capacity of 161 GW which means the minimum constraint is non binding.
Before asking for a review for this PR make sure to complete the following checklist:
ariadne_allcompletes without errorsexport_ariadne_variableshas been adapted to the changesnot applicable
Changelog.mdmainhas been merged into the PRYYYYMMDDdescriptive_title