This repository was archived by the owner on Mar 27, 2025. It is now read-only.
Update environment.yaml #289
Merged
Conversation
This file contains hidden or bidirectional Unicode text that may be interpreted or compiled differently than what appears below. To review, open the file in an editor that reveals hidden Unicode characters.
Learn more about bidirectional Unicode characters
Fixing linopy to < 0.4.0 since we have trouble with the latest version.
for more information, see https://pre-commit.ci
Validator ReportI am the Validator. Download all artifacts here.
|
| NRMSE | Pearson | |
|---|---|---|
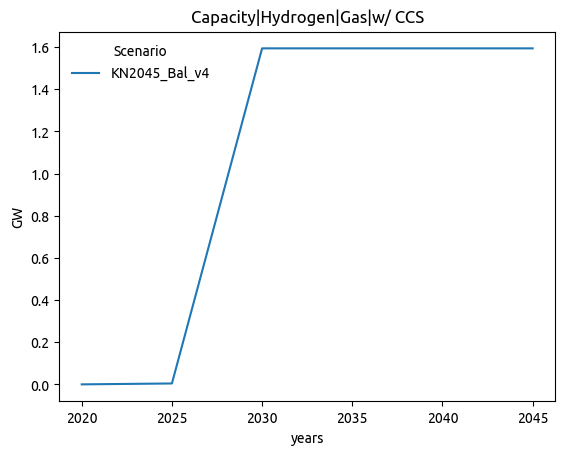
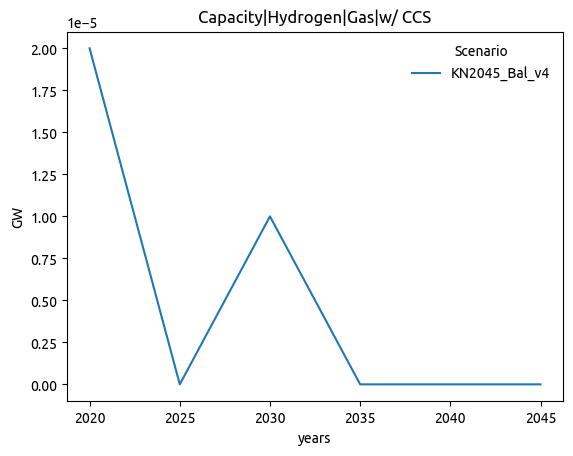
| Capacity|Hydrogen|Gas|w/ CCS | 0.816 | -0.464 |
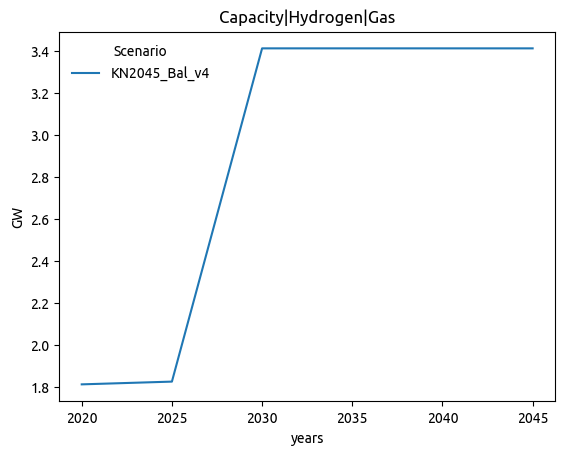
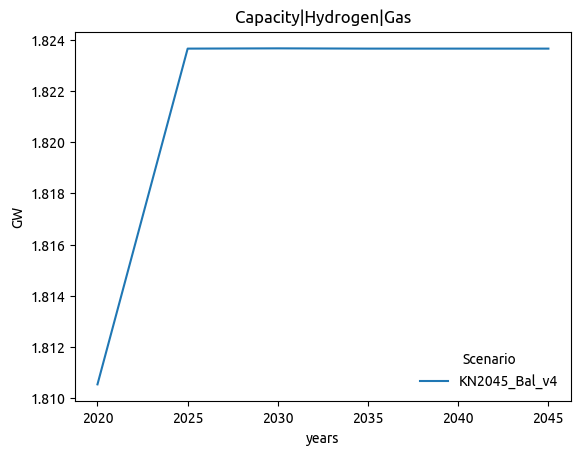
| Capacity|Hydrogen|Gas | 0.810 | 0.636 |
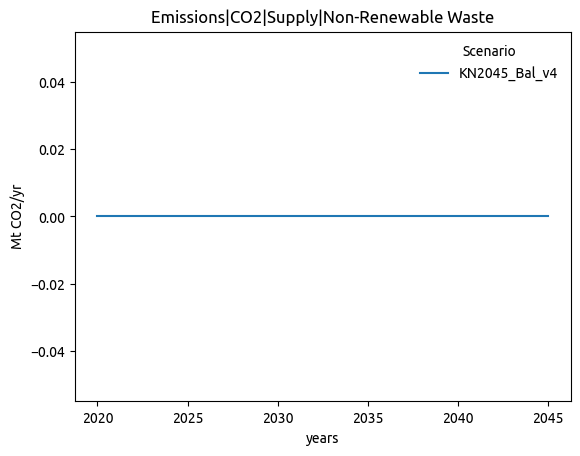
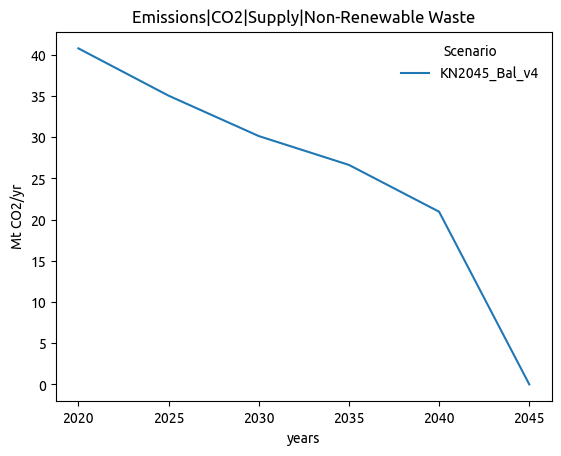
| Emissions|CO2|Supply|Non-Renewable Waste | 0.704 | 0.000 |
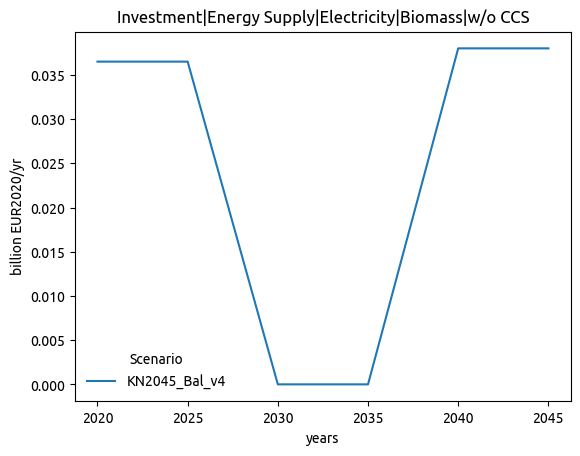
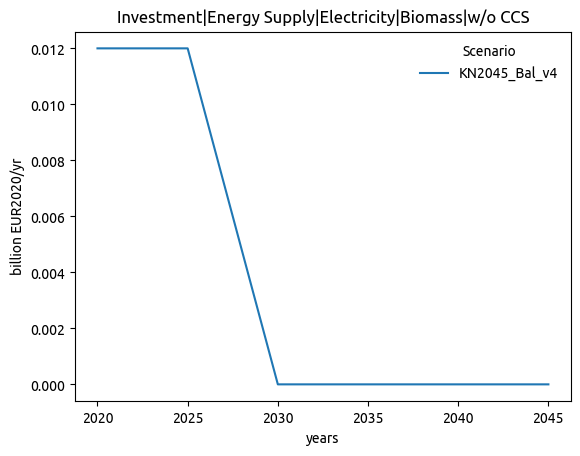
| Investment|Energy Supply|Electricity|Biomass|w/o CCS | 0.687 | 0.470 |
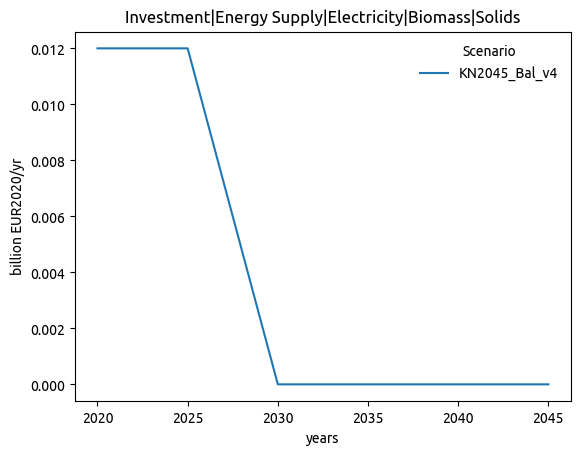
| Investment|Energy Supply|Electricity|Biomass|Solids | 0.687 | 0.470 |
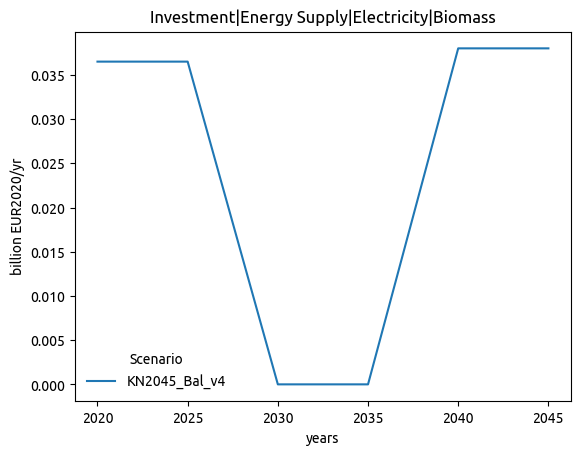
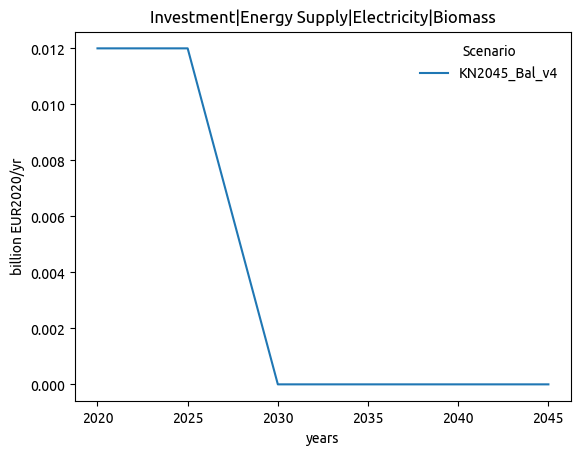
| Investment|Energy Supply|Electricity|Biomass | 0.687 | 0.470 |
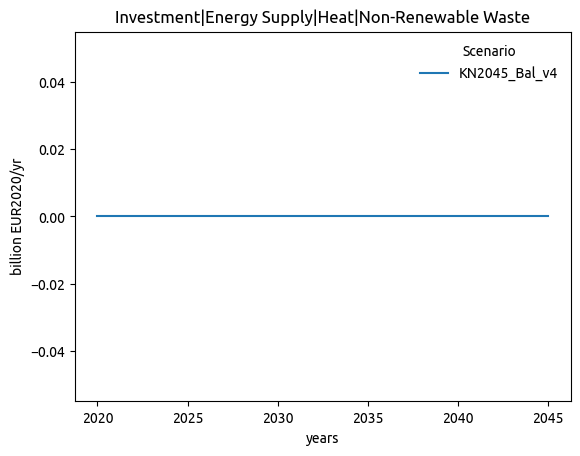
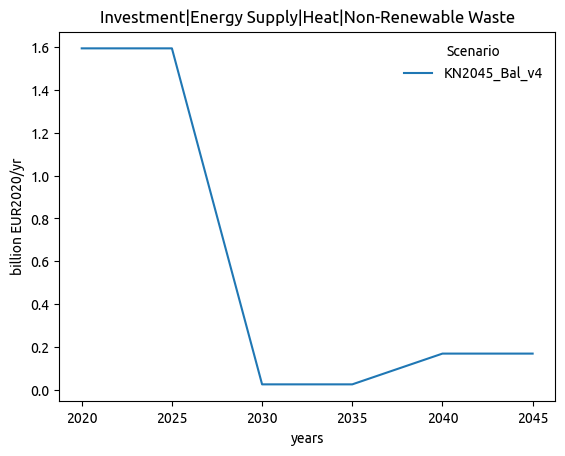
| Investment|Energy Supply|Heat|Non-Renewable Waste | 0.581 | 0.000 |
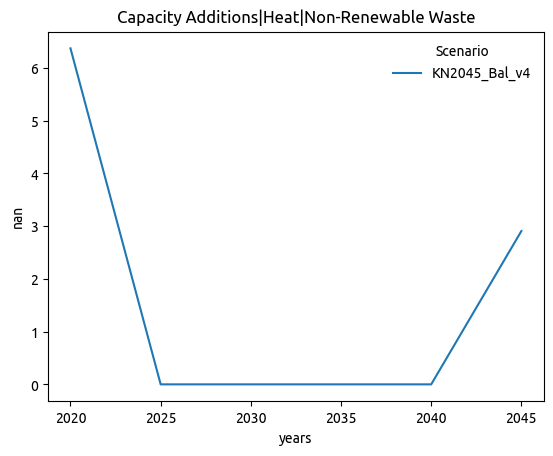
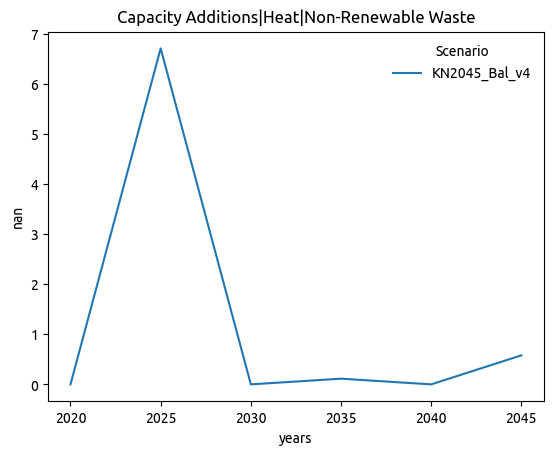
| Capacity Additions|Heat|Non-Renewable Waste | 0.581 | -0.275 |
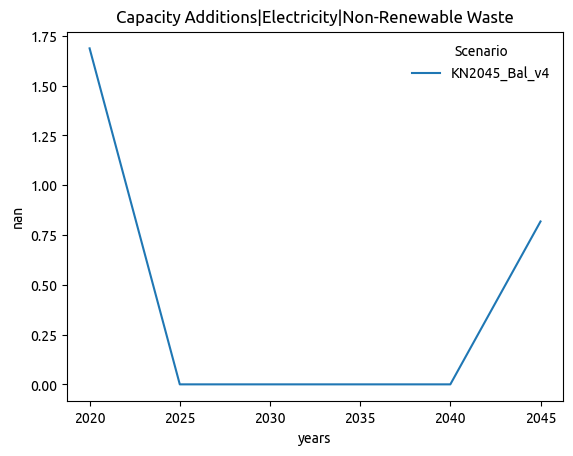
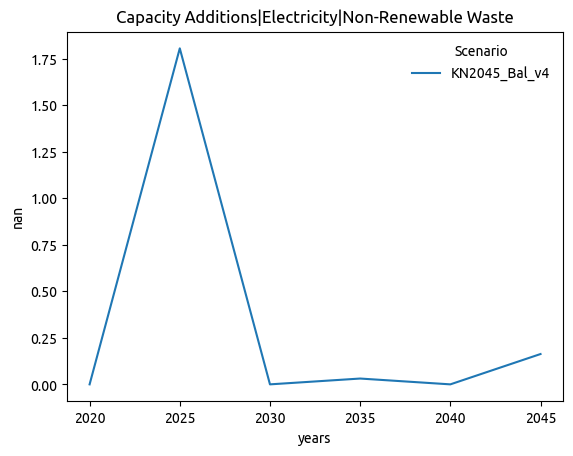
| Capacity Additions|Electricity|Non-Renewable Waste | 0.578 | -0.276 |
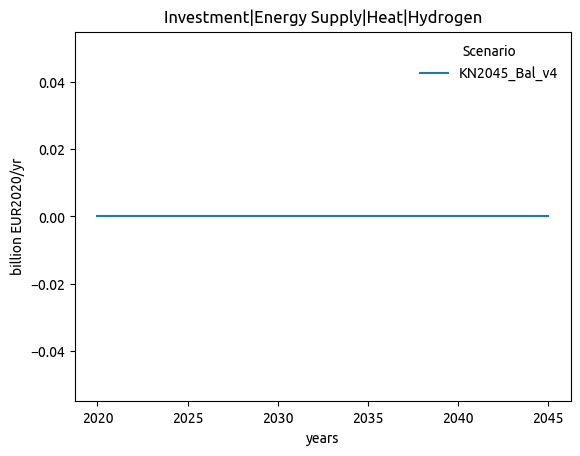
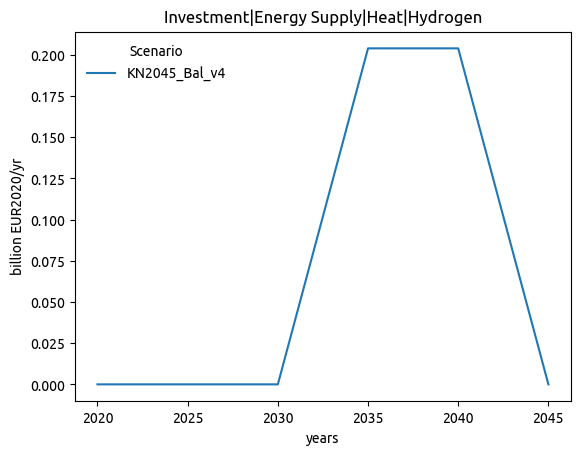
| Investment|Energy Supply|Heat|Hydrogen | 0.577 | 0.000 |
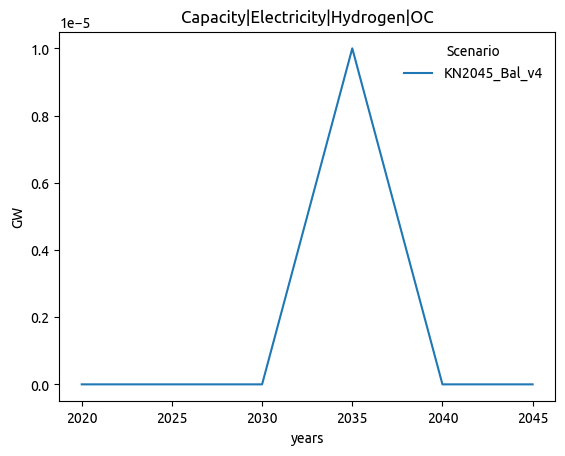
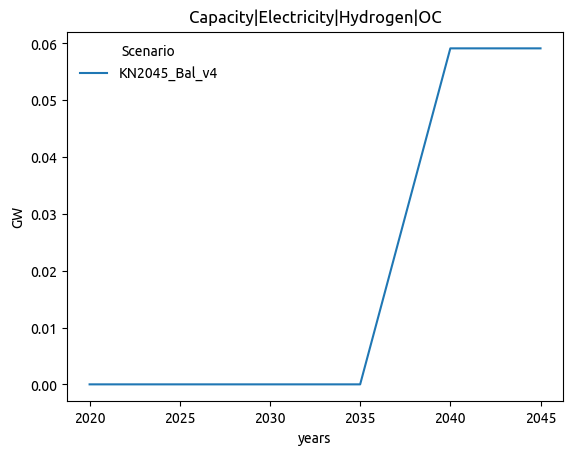
| Capacity|Electricity|Hydrogen|OC | 0.577 | -0.316 |
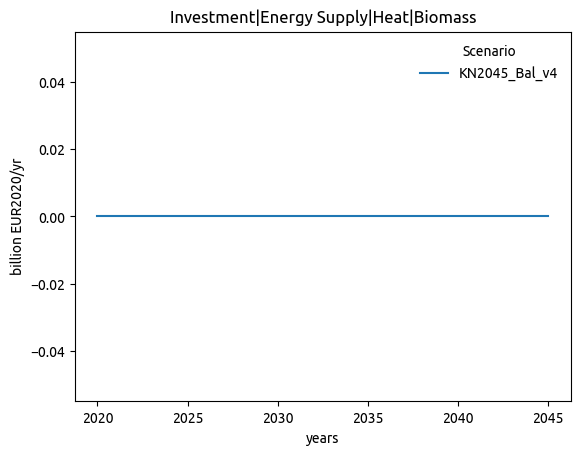
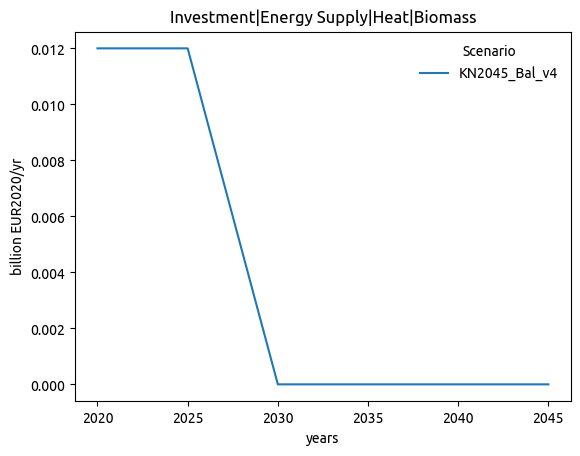
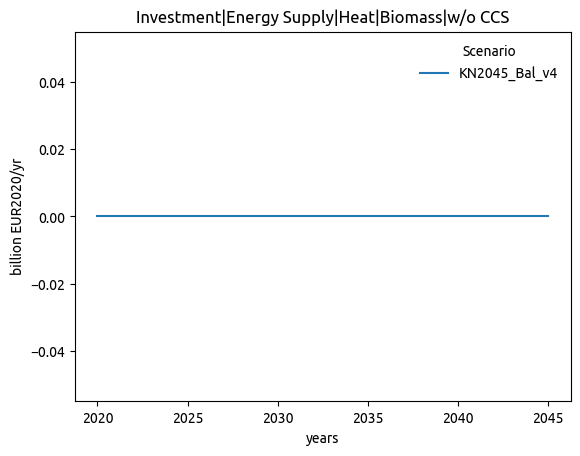
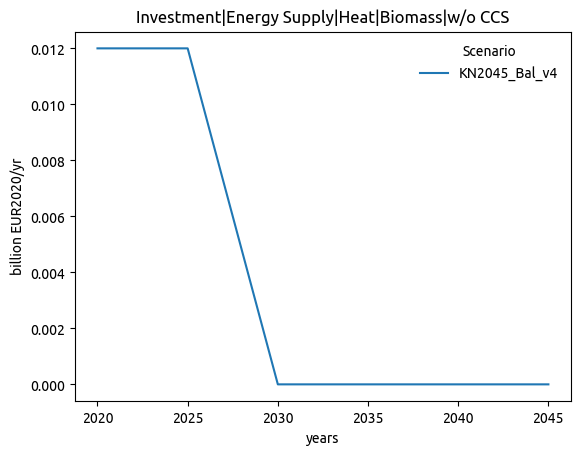
| Investment|Energy Supply|Heat|Biomass | 0.577 | 0.000 |
| Investment|Energy Supply|Heat|Biomass|w/o CCS | 0.577 | 0.000 |
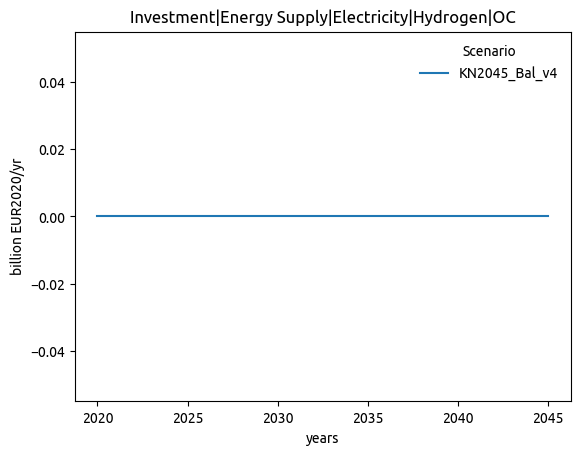
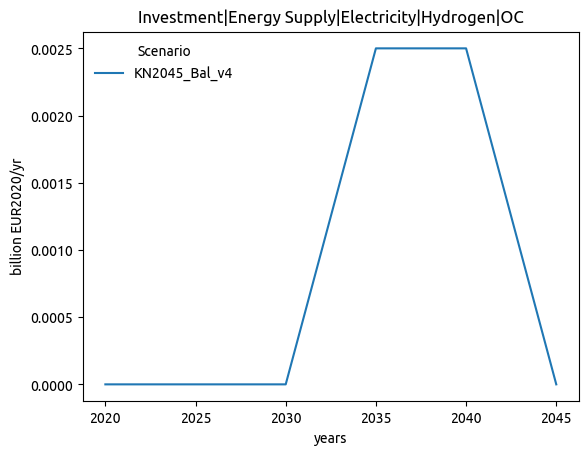
| Investment|Energy Supply|Electricity|Hydrogen|OC | 0.577 | 0.000 |
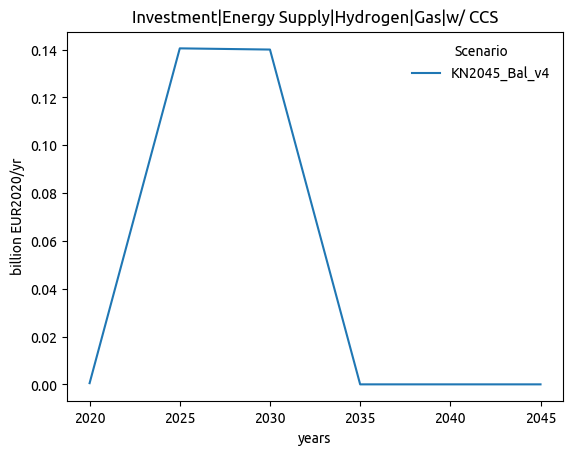
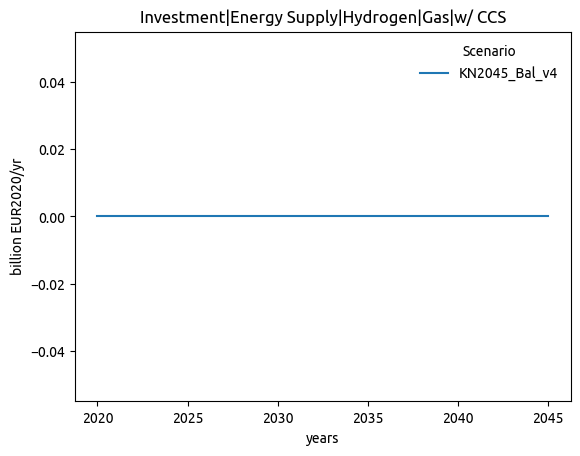
| Investment|Energy Supply|Hydrogen|Gas|w/ CCS | 0.576 | 0.000 |
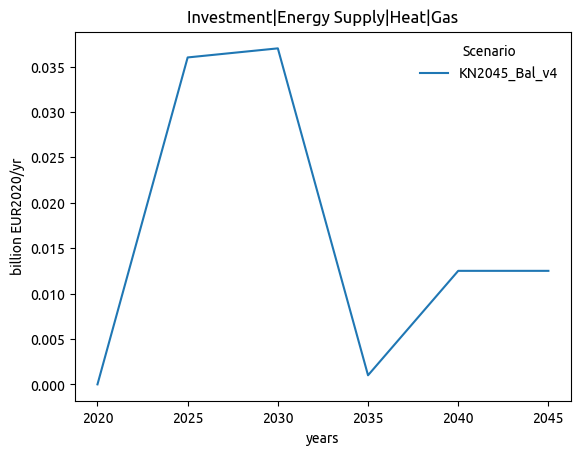
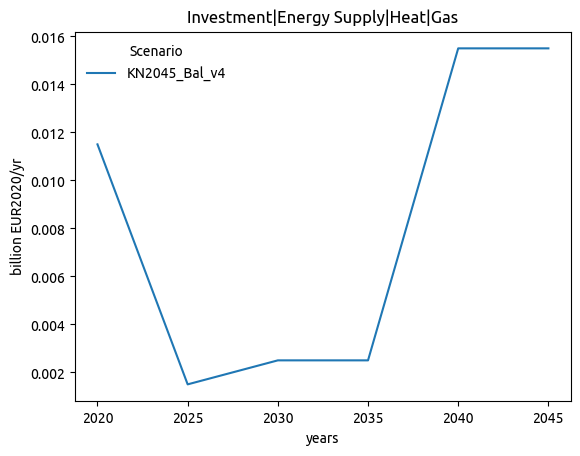
| Investment|Energy Supply|Heat|Gas | 0.555 | -0.492 |
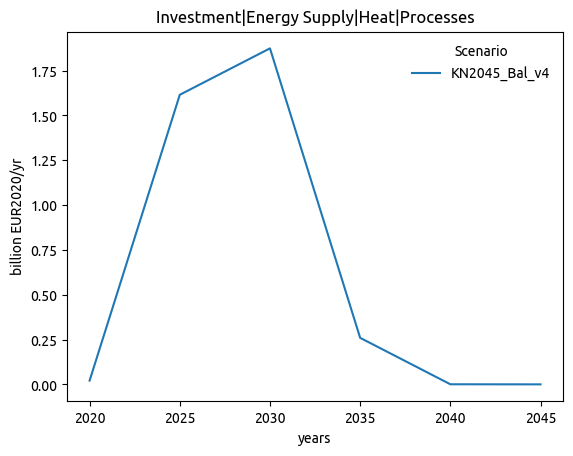
| Investment|Energy Supply|Heat|Processes | 0.542 | 0.000 |
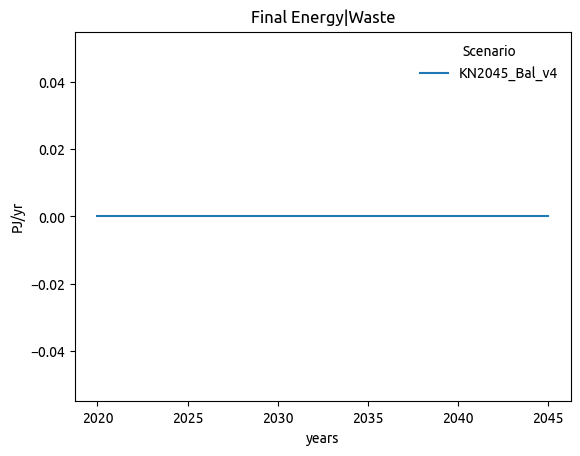
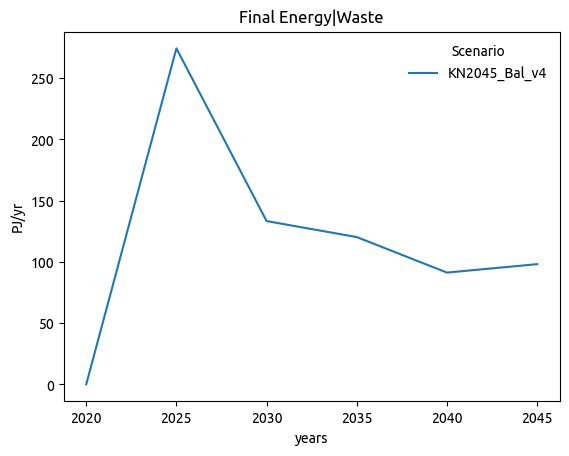
| Final Energy|Waste | 0.527 | 0.000 |
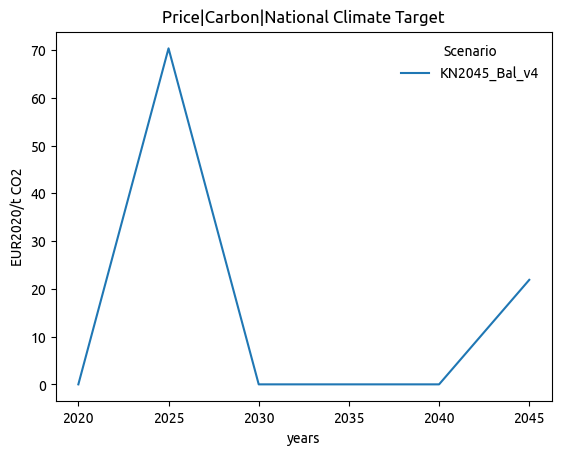
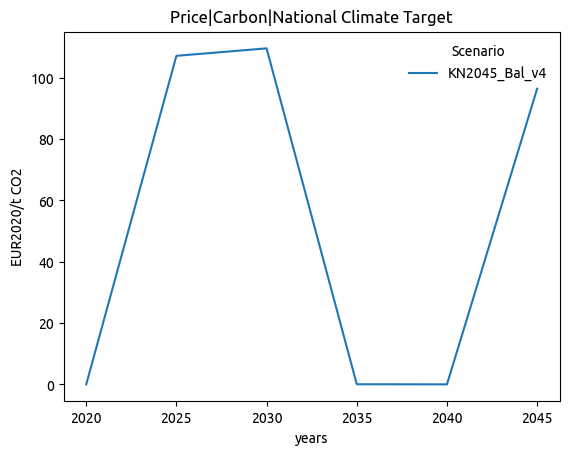
| Price|Carbon|National Climate Target | 0.512 | 0.595 |
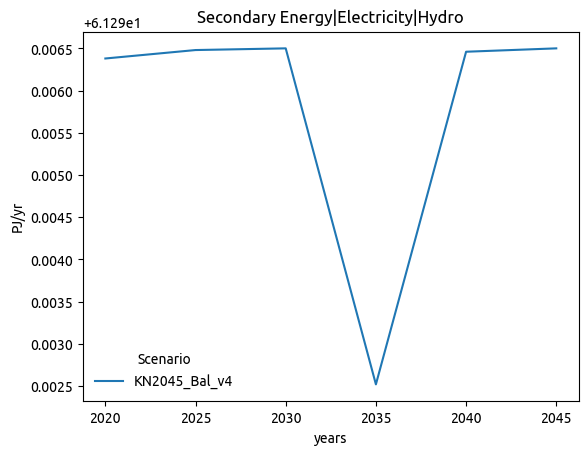
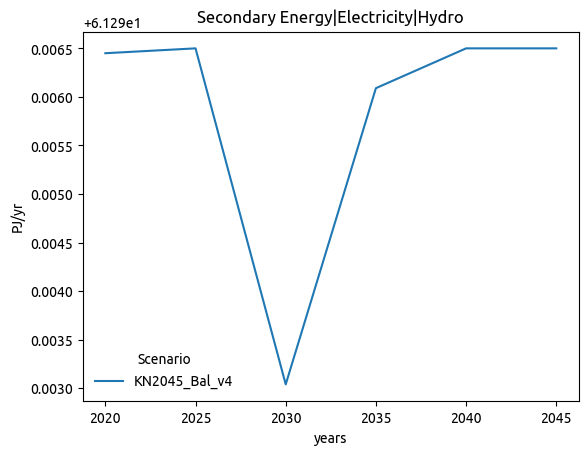
| Secondary Energy|Electricity|Hydro | 0.510 | -0.097 |
| Capacity Additions|Electricity|Biomass | 0.475 | 0.575 |
| Capacity Additions|Electricity|Biomass|Solids | 0.475 | 0.575 |
| Capacity Additions|Electricity|Biomass|w/o CCS | 0.475 | 0.575 |
| Capacity Additions|Heat|Biomass | 0.473 | 0.567 |
| Capacity Additions|Heat|Biomass|w/o CCS | 0.473 | 0.567 |
| Investment|Energy Supply|Hydrogen|Transmission and Distribution|Endogen|New-build | 0.465 | 0.509 |
| Investment|Energy Supply|Heat | 0.445 | 0.171 |
| Secondary Energy|Heat|Gas | 0.443 | -0.132 |
| Investment|Energy Supply|Liquids | 0.438 | 0.535 |
| Trade|Secondary Energy|Methanol|Gross Import|Volume | 0.436 | 0.353 |
| Capacity Additions|Heat|Heat pump | 0.436 | 0.060 |
| Investment|Energy Supply|Heat|Heat pump | 0.436 | 0.428 |
| Investment|Energy Supply|Heat|Heatpump | 0.436 | 0.428 |
| Primary Energy|Waste|Heat | 0.434 | 0.066 |
| Secondary Energy|Heat|Waste | 0.433 | 0.065 |
| Capacity|Heat|Non-Renewable Waste | 0.432 | -0.287 |
| Primary Energy|Waste | 0.432 | 0.065 |
| Capacity|Electricity|Storage Converter | 0.429 | 0.253 |
| Trade|Secondary Energy|Methanol|Volume | 0.426 | 0.576 |
| Primary Energy|Waste|Electricity | 0.426 | 0.059 |
| Secondary Energy|Electricity|Waste | 0.425 | 0.057 |
| Price|Secondary Energy|Hydrogen|Green | 0.425 | 0.000 |
| Capacity|Electricity|Non-Renewable Waste | 0.424 | -0.291 |
| Price|Final Energy|Residential and Commercial|Liquids | 0.423 | 0.000 |
| Price|Final Energy|Residential and Commercial|Liquids|Oil | 0.423 | 0.000 |
| Capacity Additions|Methanol | 0.420 | 0.414 |
| Secondary Energy Input|Electricity|Hydrogen | 0.416 | 0.749 |
| Price|Secondary Energy|Gases|Hydrogen | 0.415 | 0.000 |
| Secondary Energy|Hydrogen|Electricity | 0.414 | 0.746 |
| Capacity Additions|Heat|Gas | 0.411 | 0.016 |
| Final Energy|Carbon Dioxide Removal | 0.408 | -0.391 |
| Final Energy|Carbon Dioxide Removal|Electricity | 0.408 | -0.387 |
| Final Energy|Carbon Dioxide Removal|Heat | 0.408 | -0.388 |
| Carbon Sequestration|DACCS | 0.408 | -0.200 |
| Capacity Additions|Electricity|Hydrogen|OC | 0.408 | -0.200 |
| Capacity Additions|Hydrogen|Gas|w/ CCS | 0.408 | 0.292 |
| Capacity|Methanol | 0.404 | 0.890 |
| Investment|Energy Supply|Liquids|Biomass | 0.402 | 1.000 |
| Price|Final Energy|Industry|Liquids|Efuel | 0.391 | 0.732 |
| Price|Final Energy|Industry|Liquids|Oil | 0.391 | 0.732 |
| Primary Energy|Gas|Heat | 0.391 | 0.201 |
| Price|Primary Energy|Oil | 0.387 | 0.000 |
| Secondary Energy|Heat|Other | 0.387 | 0.803 |
| Trade|Secondary Energy|Gases|Biomass|Gross Import|Volume | 0.386 | 0.660 |
| Price|Final Energy|Industry|Liquids | 0.385 | 0.735 |
| Secondary Energy Input|Electricity|Liquids | 0.379 | 0.789 |
| Secondary Energy|Methanol | 0.379 | 0.789 |
| Final Energy|Residential and Commercial|Liquids|Petroleum | 0.372 | 0.662 |
| Capacity Additions|Electricity|Wind|Onshore | 0.360 | 0.393 |
| Capacity Additions|Hydrogen|Gas | 0.359 | 0.689 |
| Secondary Energy|Hydrogen|Gas | 0.357 | 0.440 |
| Capacity|Electricity|Gas|OC | 0.354 | 0.463 |
| Final Energy|Residential and Commercial|Liquids | 0.352 | 0.690 |
| Primary Energy|Gas|Hydrogen | 0.350 | 0.473 |
| Secondary Energy|Electricity|Gas | 0.348 | 0.571 |
| Secondary Energy|Solids|Biomass | 0.346 | -0.079 |
| Primary Energy|Biomass|Solids | 0.346 | -0.079 |
| Capacity Additions|Heat | 0.345 | 0.348 |
| Investment|Energy Supply|Hydrogen|Transmission and Distribution|Endogen | 0.341 | 0.791 |
| Secondary Energy|Heat|Oil | 0.332 | 0.667 |
| Final Energy|Industry|Gases|Biomass | 0.324 | 0.731 |
| Final Energy|Industry excl Non-Energy Use|Gases|Biomass | 0.324 | 0.699 |
| Investment|Energy Supply|Methanol | 0.323 | 0.648 |
| Investment|Energy Supply|Hydrogen|Fossil | 0.323 | 0.756 |
| Investment|Energy Supply|Hydrogen|Gas | 0.323 | 0.756 |
| Capacity|Hydrogen|Electricity | 0.322 | 0.974 |
| Primary Energy|Gas|Electricity | 0.322 | 0.650 |
| Emissions|CO2|Efuels|Gases | 0.320 | 0.449 |
| Capacity Additions|Electricity|Wind | 0.320 | 0.489 |
| Final Energy|Gases|Biomass | 0.317 | 0.612 |
| Investment|Energy Supply|Electricity|Non-Renewable Waste | 0.316 | 0.506 |
| Primary Energy|Oil|Heat | 0.315 | 0.909 |
| Secondary Energy|Liquids|Hydrogen | 0.315 | 0.846 |
| Emissions|Gross Fossil CO2|Energy|Supply|Heat | 0.313 | 0.810 |
| Emissions|CO2|Energy|Supply|Heat | 0.313 | 0.810 |
| Secondary Energy Input|Hydrogen|Liquids | 0.311 | 0.849 |
| Final Energy|Solids|Biomass | 0.308 | 0.211 |
| Final Energy|Residential and Commercial|Gases|Biomass | 0.308 | 0.820 |
| Emissions|CO2|Energy|Supply|Hydrogen | 0.305 | 0.784 |
| Emissions|Gross Fossil CO2|Energy|Supply|Hydrogen | 0.305 | 0.784 |
| Secondary Energy|Heat|Electricity|Heat Pumps | 0.299 | 0.863 |
| Capacity|Heat|Processes | 0.299 | 0.975 |
| Capacity|Hydrogen|Gas|w/o CCS | 0.294 | 1.000 |
| Secondary Energy|Electricity|Oil | 0.293 | 0.662 |
| Capacity|Liquids|Hydrogen | 0.286 | 0.948 |
| Emissions|CO2|Model|CCU | 0.286 | 0.825 |
| Capacity Additions|Liquids|Biomass | 0.284 | 1.000 |
| Capacity|Liquids|Biomass | 0.284 | 1.000 |
| Capacity Additions|Liquids | 0.284 | 0.731 |
| Price|Final Energy|Industry|Hydrogen | 0.282 | 0.698 |
| Investment|Energy Supply|Hydrogen|Electrolysis | 0.281 | 0.971 |
| Investment|Energy Supply|Hydrogen|Electricity | 0.281 | 0.971 |
| Final Energy|Bunkers|Navigation|Liquids|Biomass | 0.281 | 0.788 |
| Price|Primary Energy|Coal | 0.278 | 0.848 |
| Price|Carbon | 0.276 | 0.866 |
| Price|Final Energy|Industry|Solids|Coal | 0.275 | 0.863 |
| Secondary Energy|Electricity|Curtailment | 0.274 | 0.764 |
| Final Energy|Non-Energy Use|Gases|Biomass | 0.273 | 0.800 |
| Final Energy|Industry excl Non-Energy Use|Liquids|Biomass | 0.269 | 0.780 |
| Investment|Energy Supply|Electricity|Wind|Onshore | 0.268 | 0.759 |
| Investment|Energy Supply|Electricity|Wind Onshore | 0.268 | 0.759 |
| Capacity|Heat|Heat pump | 0.265 | 0.850 |
| Capacity Additions|Liquids|Hydrogen | 0.265 | 0.756 |
| Capacity|Liquids | 0.264 | 0.952 |
| Secondary Energy|Heat|Electricity | 0.264 | 0.890 |
| Secondary Energy|Electricity|Coal|Lignite | 0.261 | 0.761 |
| Primary Energy|Coal|Lignite | 0.256 | 0.773 |
| Trade|Secondary Energy|Gases|Biomass|Volume | 0.256 | 0.765 |
| Investment|Energy Supply|Electricity|Solar|PV|Open Field | 0.256 | 0.884 |
| Price|Final Energy|Residential and Commercial|Gases | 0.247 | 0.880 |
| Primary Energy|Coal|Electricity | 0.247 | 0.797 |
| Final Energy|Residential and Commercial|Solids | 0.246 | 0.612 |
| Final Energy|Residential and Commercial|Solids|Biomass | 0.246 | 0.612 |
| Primary Energy|Biomass|Liquids | 0.236 | 0.837 |
| Price|Secondary Energy|Liquids | 0.234 | 0.877 |
| Price|Primary Energy|Gas | 0.233 | 0.859 |
| Investment|Energy Supply|Liquids|Hydrogen | 0.232 | 0.835 |
| Final Energy|Transportation|Liquids|Biomass | 0.230 | 0.837 |
| Price|Final Energy|Transportation|Passenger|Liquids | 0.229 | 0.873 |
| Price|Final Energy|Transportation|Electricity | 0.229 | 0.873 |
| Price|Final Energy|Transportation|Freight|Liquids | 0.229 | 0.874 |
| Investment|Energy Supply|Electricity|Wind | 0.229 | 0.819 |
| Capacity Additions|Hydrogen|Transmission|Endogenous | 0.227 | 0.917 |
| Capacity|Heat|Gas | 0.227 | 0.908 |
| Capacity Additions|Heat|Processes | 0.224 | 0.923 |
| Capacity|Hydrogen|Transmission|Endogenous | 0.223 | 0.990 |
| Price|Secondary Energy|Gases | 0.222 | 0.877 |
| Secondary Energy|Hydrogen | 0.216 | 0.969 |
| Secondary Energy Input|Electricity|Heat | 0.215 | 0.912 |
| Capacity Additions|Electricity|Solar|PV|Open Field | 0.211 | 0.880 |
| Capacity|Heat | 0.209 | 0.948 |
| Capacity Additions|Hydrogen|Electricity | 0.203 | 0.951 |
| Trade|Secondary Energy|Liquids|Biomass|Gross Import|Volume | 0.198 | 0.897 |
| Capacity|Heat|Resistive heater | 0.196 | 0.969 |
| Secondary Energy|Electricity|Coal | 0.195 | 0.894 |
| Trade|Primary Energy|Biomass|Volume | 0.194 | 0.989 |
| Price|Final Energy|Industry|Solids|Biomass | 0.191 | 0.848 |
| Emissions|CO2|Energy|Supply|Electricity | 0.188 | 0.897 |
| Emissions|Gross Fossil CO2|Energy|Supply|Electricity | 0.188 | 0.897 |
| Price|Final Energy|Transportation|Passenger|Hydrogen | 0.180 | 0.000 |
| Price|Final Energy|Transportation|Freight|Hydrogen | 0.180 | 0.000 |
| Investment|Energy Supply|Electricity|Distribution | 0.179 | 0.891 |
| Final Energy|Liquids|Biomass | 0.175 | 0.892 |
| Emissions|CO2|Efuels|Liquids | 0.174 | 0.948 |
| Investment|Energy Supply|Hydrogen|Transmission and Distribution|Endogen|Retrofitted | 0.174 | 0.975 |
| Investment|Energy Supply|Heat|Resistive heater | 0.173 | 0.935 |
| Secondary Energy|Heat|Electricity|Resistive | 0.171 | 0.950 |
| Capacity Additions|Heat|Resistive heater | 0.169 | 0.933 |
| Price|Final Energy|Industry|Solids | 0.161 | 0.955 |
| Capacity|Electricity|Solar|PV|Open Field | 0.160 | 0.905 |
| Investment|Energy Supply|Hydrogen | 0.156 | 0.994 |
| Primary Energy|Coal | 0.155 | 0.927 |
| Final Energy|Solids | 0.155 | 0.920 |
| Capacity|Electricity|Wind|Onshore | 0.153 | 0.941 |
| Price|Primary Energy|Biomass | 0.153 | 0.952 |
| Trade|Secondary Energy|Hydrogen|Gross Import|Volume | 0.151 | 0.980 |
| Price|Final Energy|Residential and Commercial|Heat | 0.150 | 0.953 |
| Capacity Additions|Electricity | 0.148 | 0.883 |
| Secondary Energy|Heat|Coal | 0.148 | 0.982 |
| Primary Energy|Coal|Heat | 0.146 | 0.981 |
| Investment|Energy Supply|Electricity | 0.146 | 0.918 |
| Secondary Energy|Electricity|Wind|Onshore | 0.145 | 0.949 |
| Price|Final Energy|Residential and Commercial|Electricity | 0.145 | 0.939 |
| Final Energy|Residential and Commercial|Electricity|Heat Pumps | 0.145 | 0.960 |
| Secondary Energy|Electricity|Coal|Hard Coal | 0.143 | 0.948 |
| Price|Carbon|EU-wide Regulation All Sectors | 0.143 | 0.962 |
| Final Energy|Residential and Commercial|Electricity | 0.143 | 0.957 |
| Primary Energy|Coal|Hard Coal | 0.143 | 0.963 |
| Final Energy|Residential and Commercial|Liquids|Biomass | 0.141 | 0.975 |
| Price|Final Energy|Industry|Gases | 0.138 | 0.942 |
| Final Energy|Industry|Liquids|Biomass | 0.138 | 0.938 |
| Secondary Energy|Electricity|Storage Losses | 0.137 | 0.968 |
| Price|Final Energy|Industry|Heat | 0.137 | 0.934 |
| Trade|Secondary Energy|Liquids|Biomass|Volume | 0.136 | 0.953 |
| Price|Final Energy|Residential and Commercial|Solids|Biomass | 0.136 | 0.965 |
| Price|Final Energy|Residential and Commercial|Solids | 0.136 | 0.965 |
| Price|Secondary Energy|Liquids|Hydrogen | 0.135 | 0.977 |
| Primary Energy|Hydro | 0.134 | 0.970 |
| Price|Final Energy|Transportation|Passenger|Electricity | 0.134 | 0.970 |
| Primary Energy|Biomass|Gases | 0.133 | 0.946 |
| Secondary Energy|Gases|Biomass | 0.133 | 0.946 |
| Price|Final Energy|Industry|Electricity | 0.133 | 0.974 |
| Emissions|CO2|Energy|Supply|Electricity and Heat | 0.133 | 0.958 |
| Emissions|CO2|Energy|Demand|Residential and Commercial | 0.132 | 0.970 |
| Price|Secondary Energy|Electricity | 0.131 | 0.968 |
| Emissions|Gross Fossil CO2|Energy|Supply | 0.128 | 0.962 |
| Investment|Energy Supply|Electricity|Transmission and Distribution | 0.127 | 0.940 |
| Final Energy|Non-Energy Use|Liquids|Biomass | 0.125 | 0.950 |
| Capacity|Electricity|Wind | 0.123 | 0.961 |
| Trade|Secondary Energy|Liquids|Hydrogen|Volume | 0.122 | 0.970 |
| Trade|Secondary Energy|Electricity|Gross Import|Volume | 0.120 | 0.979 |
| Price|Secondary Energy|Hydrogen | 0.119 | 0.949 |
| Primary Energy|Biomass | 0.119 | 0.968 |
| Trade|Secondary Energy|Electricity|Volume | 0.116 | 0.935 |
| Capacity|Hydrogen | 0.114 | 0.986 |
| Primary Energy|Oil|Electricity | 0.113 | 0.966 |
| Capacity Additions|Electricity|Wind|Offshore | 0.113 | 0.952 |
| Price|Secondary Energy|Gases|Biomass | 0.113 | 0.000 |
| Emissions|CO2|Energy|Supply|Liquids | 0.113 | 0.976 |
| Primary Energy|Biomass|Heat | 0.111 | 0.951 |
| Emissions|CO2|Energy|Supply | 0.108 | 0.970 |
| Capacity Additions|Hydrogen | 0.107 | 0.976 |
| Final Energy|Bunkers|Aviation|Liquids|Biomass | 0.107 | 0.964 |
| Secondary Energy|Heat | 0.105 | 0.985 |
| Secondary Energy|Electricity | 0.104 | 0.981 |
| Secondary Energy|Heat|Biomass | 0.104 | 0.956 |
| Trade|Secondary Energy|Hydrogen|Volume | 0.103 | 0.978 |
| Secondary Energy|Liquids|Biomass | 0.102 | 0.968 |
NRMSE: Normalized (combined-min-max) Root Mean Square Error
Pearson: Pearson correlation coefficient
Threshold: NRMSE > 0.1
Only variables reaching the threshold are shown. Find the equivalent plot for all of them below.
Plots
| Main branch | Feature branch |
|---|---|
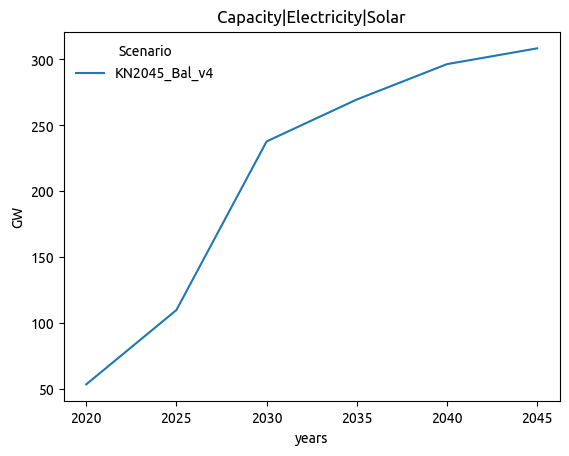
 |
 |
 |
 |
 |
 |
 |
 |
 |
 |
 |
 |
 |
 |
 |
 |
 |
 |
 |
 |
 |
 |
 |
 |
 |
 |
 |
 |
 |
 |
 |
 |
 |
 |
 |
 |
 |
 |
 |
 |
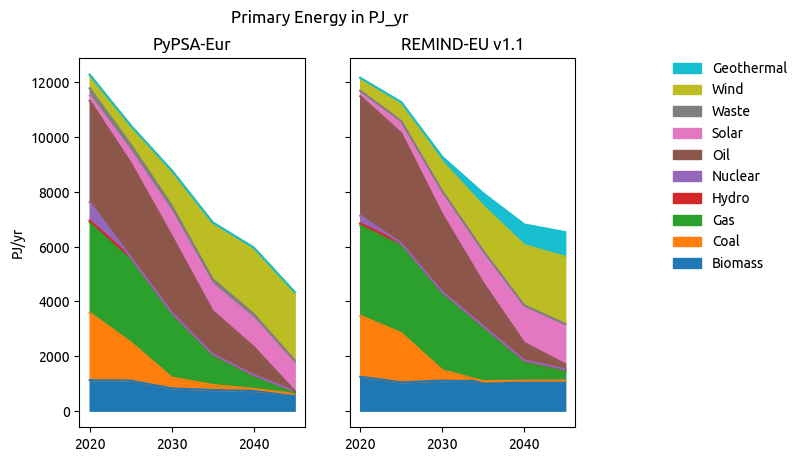
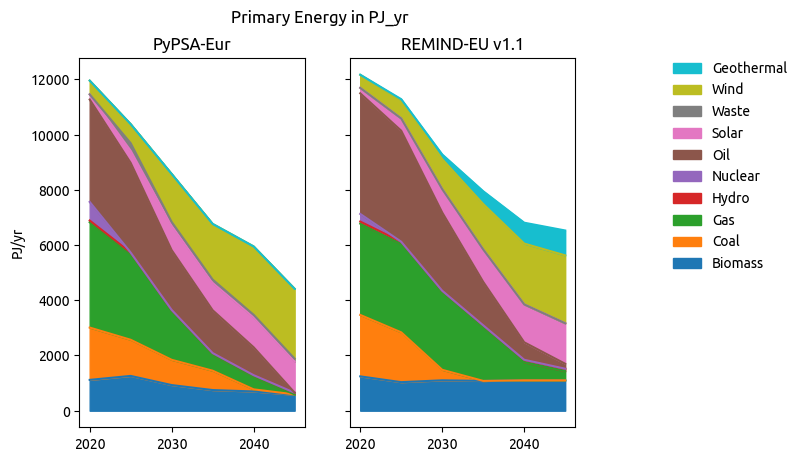
General
Plots comparison
| Main branch | Feature branch |
|---|---|
 |
 |
 |
 |
 |
 |
 |
 |
 |
 |
 |
 |
Files comparison
| Status | NRMSE | MAE (norm) | |
|---|---|---|---|
| csvs/prices.csv | 0.041 | 0.08 | |
| csvs/market_values.csv | 0.099 | 0.07 | |
| csvs/price_statistics.csv | 0.091 | 0.22 | |
| csvs/cumulative_cost.csv | 0.020 | 0.13 | |
| csvs/metrics.csv | 0.031 | 0.06 | |
| csvs/curtailment.csv | 0.000 | 0.07 | |
| csvs/nodal_cfs.csv | |||
| csvs/supply.csv | ✅ Almost equal | 0.005 | 0.04 |
| csvs/capacities.csv | ✅ Almost equal | 0.003 | 0.00 |
| csvs/nodal_costs.csv | ✅ Almost equal | 0.003 | 0.00 |
| csvs/nodal_capacities.csv | ✅ Almost equal | 0.001 | 0.00 |
| csvs/nodal_supply_energy.csv | ✅ Almost equal | 0.001 | 0.00 |
| csvs/cfs.csv | ✅ Almost equal | 0.038 | 0.00 |
| csvs/costs.csv | ✅ Almost equal | 0.011 | 0.01 |
| csvs/supply_energy.csv | ✅ Almost equal | 0.005 | 0.03 |
| csvs/energy.csv | ✅ Almost equal | 0.006 | 0.02 |
| csvs/weighted_prices.csv | ✅ Equal |
NRMSE: Normalized (combined-min-max) Root Mean Square Error
MAE (norm): Mean Absolute Error on normalized data (min-max)
Status Threshold: MAE (norm) > 0.05 and NRMSE > 0.3
Model Metrics
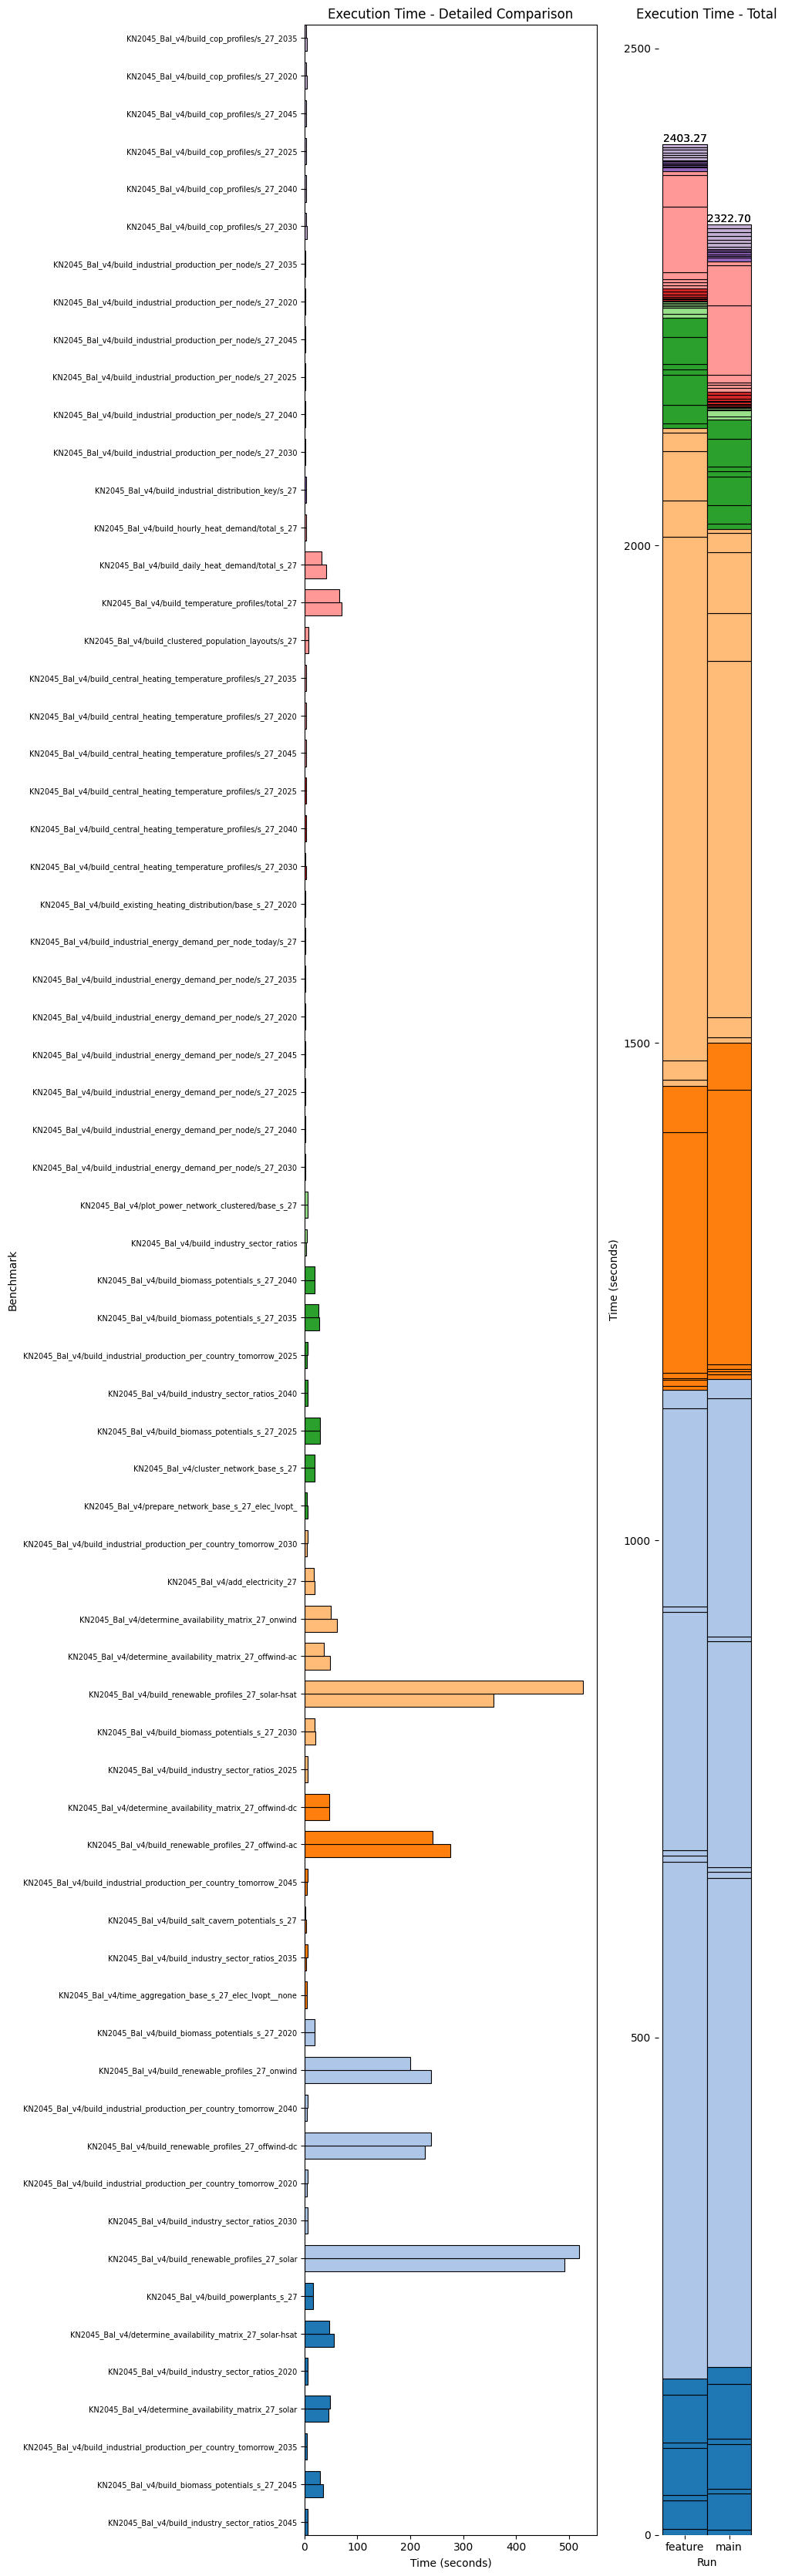
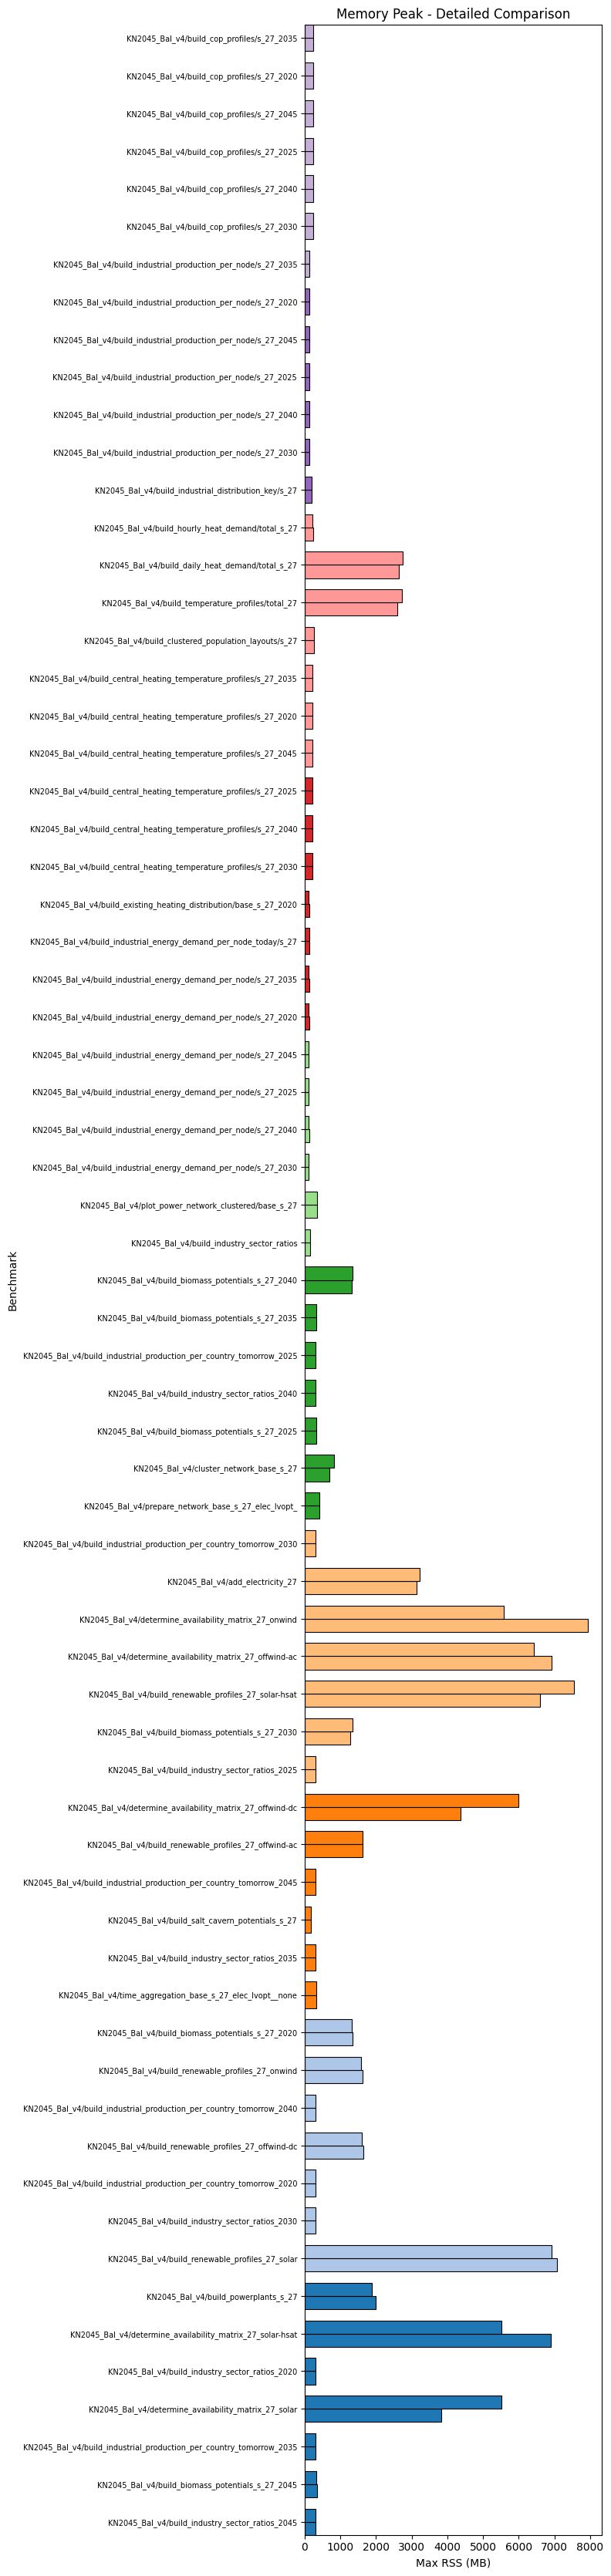
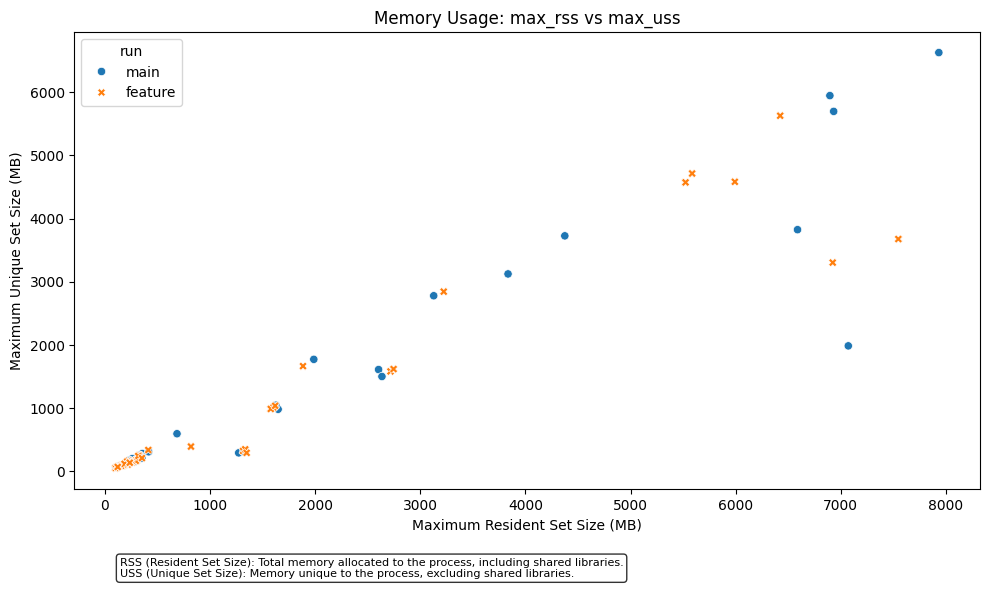
Benchmarks
Comparing toniseibold-patch-1 (c59cbf7) with main (5f413e2).
Branch is 3 commits ahead and 5 commits behind.
Last updated on 2024-12-04 16:31:34 CET.
Sign up for free
to subscribe to this conversation on GitHub.
Already have an account?
Sign in.
2 participants
Add this suggestion to a batch that can be applied as a single commit.
This suggestion is invalid because no changes were made to the code.
Suggestions cannot be applied while the pull request is closed.
Suggestions cannot be applied while viewing a subset of changes.
Only one suggestion per line can be applied in a batch.
Add this suggestion to a batch that can be applied as a single commit.
Applying suggestions on deleted lines is not supported.
You must change the existing code in this line in order to create a valid suggestion.
Outdated suggestions cannot be applied.
This suggestion has been applied or marked resolved.
Suggestions cannot be applied from pending reviews.
Suggestions cannot be applied on multi-line comments.
Suggestions cannot be applied while the pull request is queued to merge.
Suggestion cannot be applied right now. Please check back later.
Fixing linopy to < 0.4.0 since we have trouble with the latest version.
ML: Also, taking over snakemake <8.25 from pypsa-eur
Before asking for a review for this PR make sure to complete the following checklist:
ariadne_allcompletes without errorsexport_ariadne_variableshas been adapted to the changesChangelog.mdmainhas been merged into the PRYYYYMMDDdescriptive_title