Utilities to visualize and explore output from the NOAA Office of Water Prediction's (OWP) Water Resources Evaluation Service (WRES). The primary use-case for these tools is to support the routine evaluation of the National Water Model.
In accordance with the python community, we support and advise the usage of virtual
environments in any workflow using python. In the following installation guide, we
use python's built-in venv module to create a virtual environment in which the
tool will be installed. Note this is just personal preference, any python virtual
environment manager should work just fine (conda, pipenv, etc. ).
# Create and activate python environment, requires python >= 3.10
$ python3 -m venv venv
$ source venv/bin/activate
$ python3 -m pip install --upgrade pip wheel

# Install wres.explorer
$ python3 -m pip install wres.explorerUsage: wres-explorer [OPTIONS]
Visualize and explore output from WRES CSV2 formatted files.
Run "wres-explorer" from the command-line, ctrl+c to stop the server.:
Options:
--help Show this message and exit.The application features a tabbing interface. The "CSV Selector" tab is active by default.
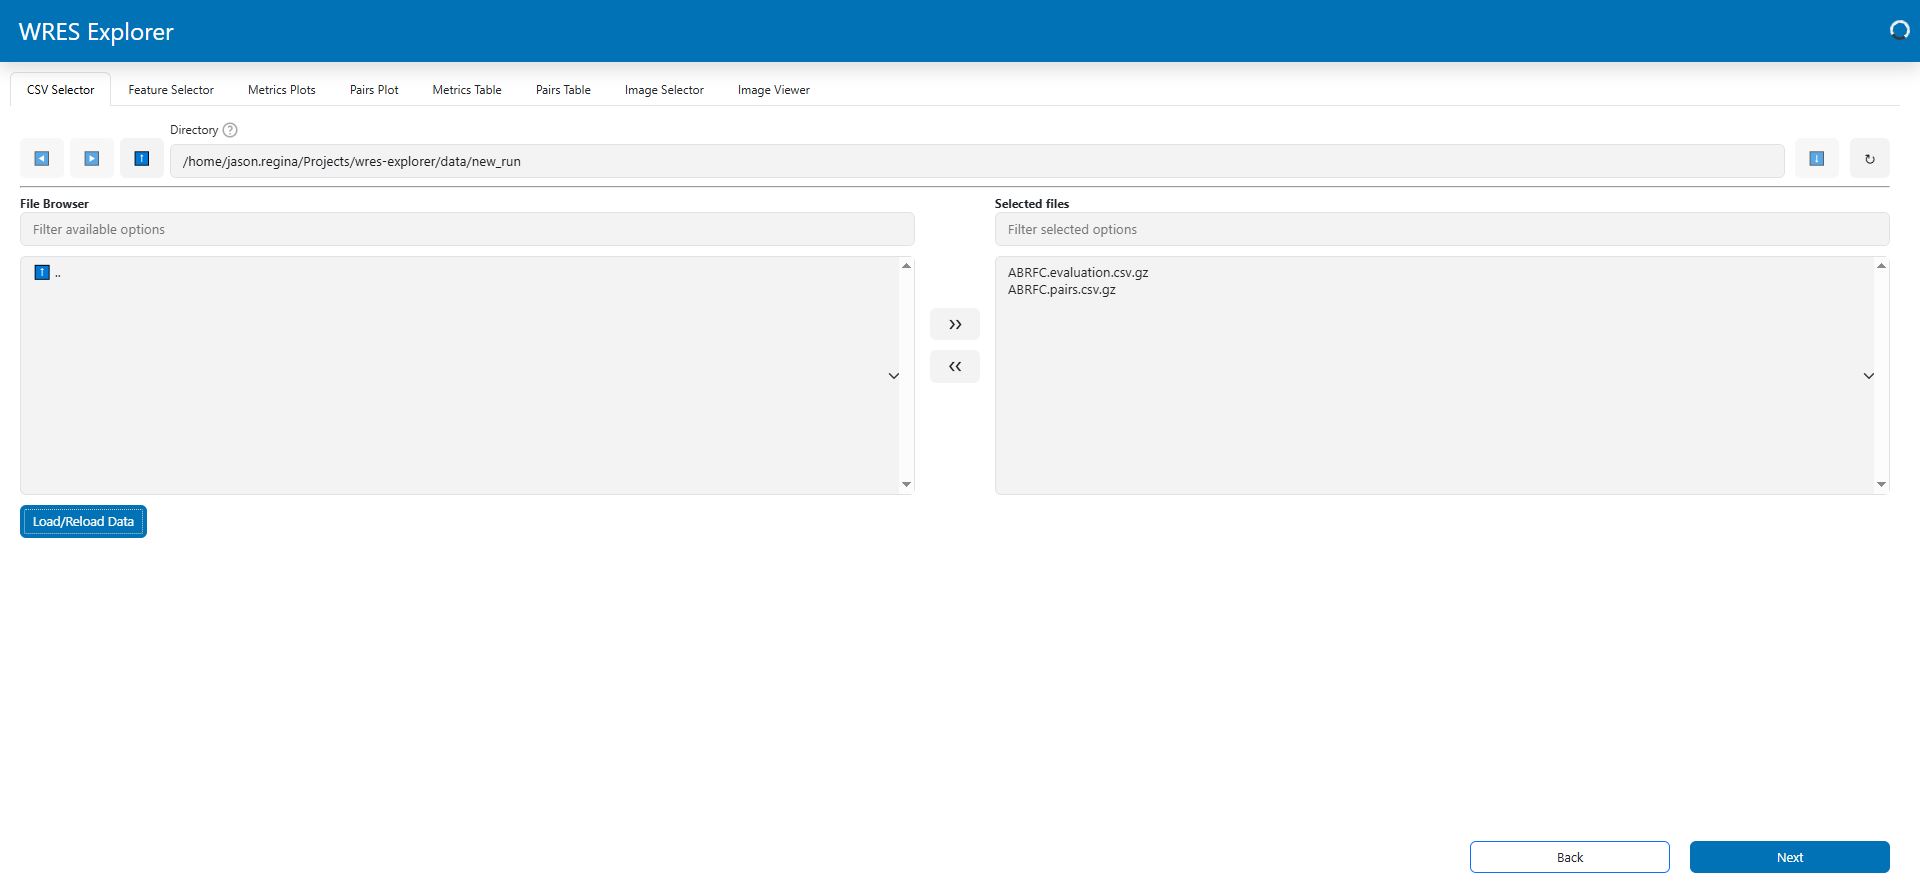
The file browser starts in the directory where the application was launched. Use the arrows (>> or <<) to move the files you want to visualize from the "File Browser" to the "Selected files".
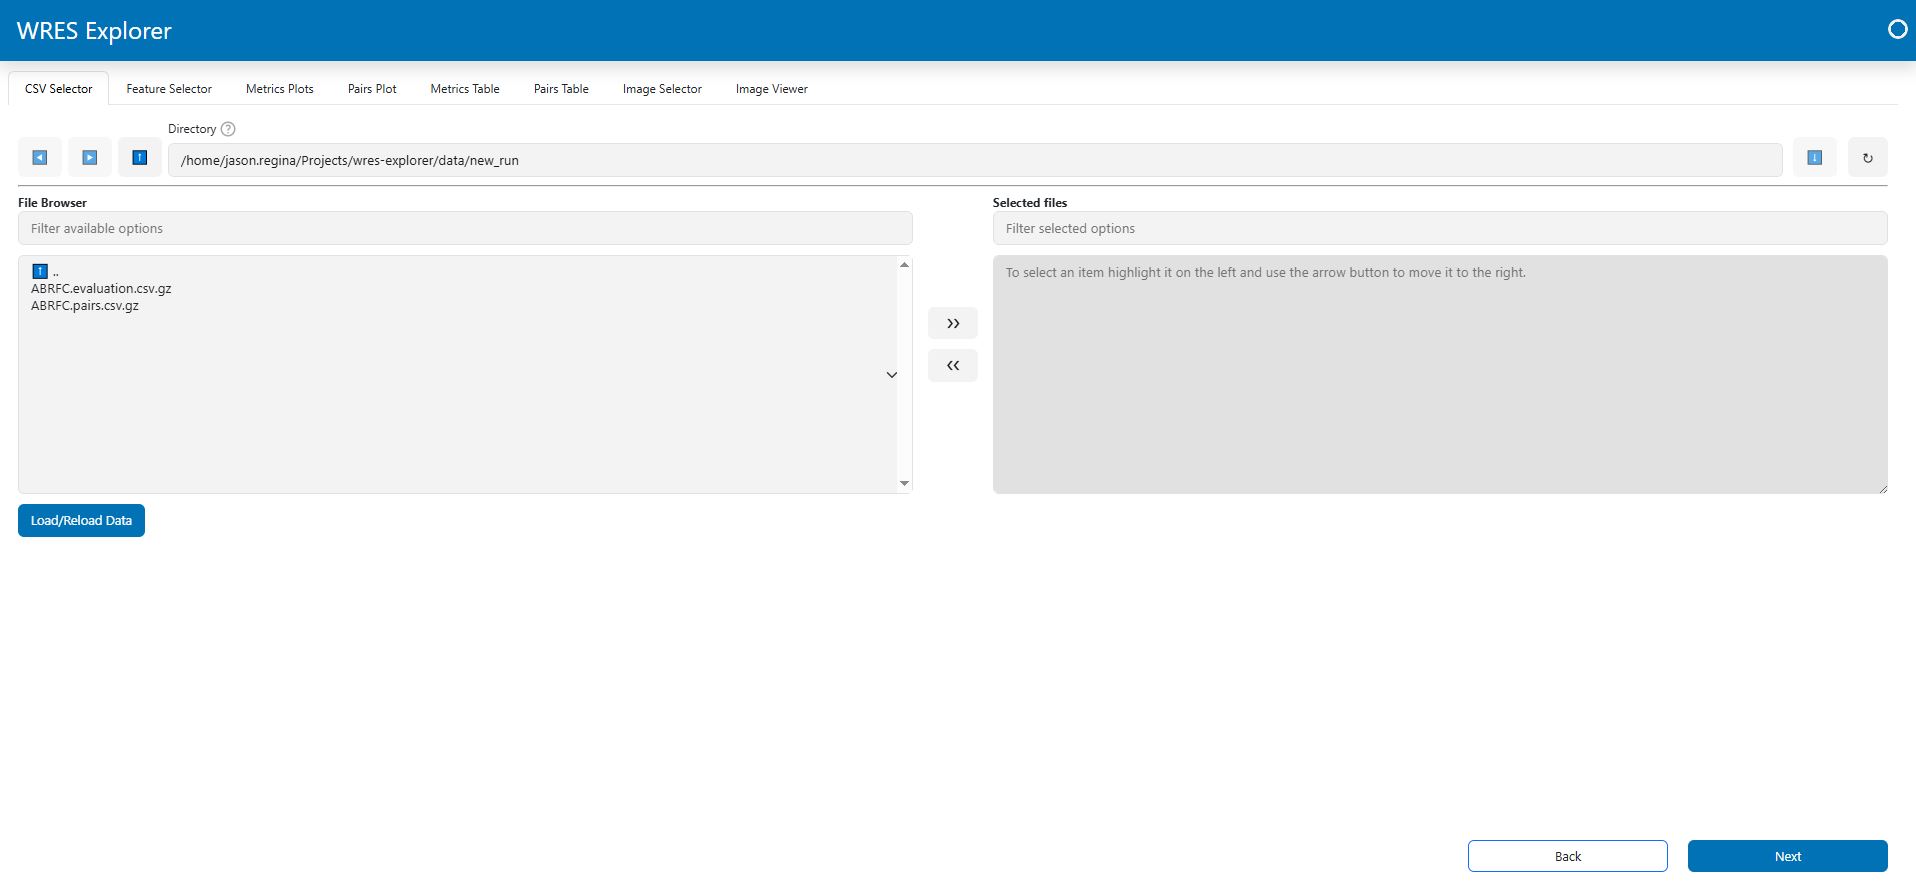
The example below has selected the files ABRFC.evaluation.csv.gz and ABRFC.pairs.csv.gz. After selecting one or more files, click the "Load/Reload Data" button to read the files.
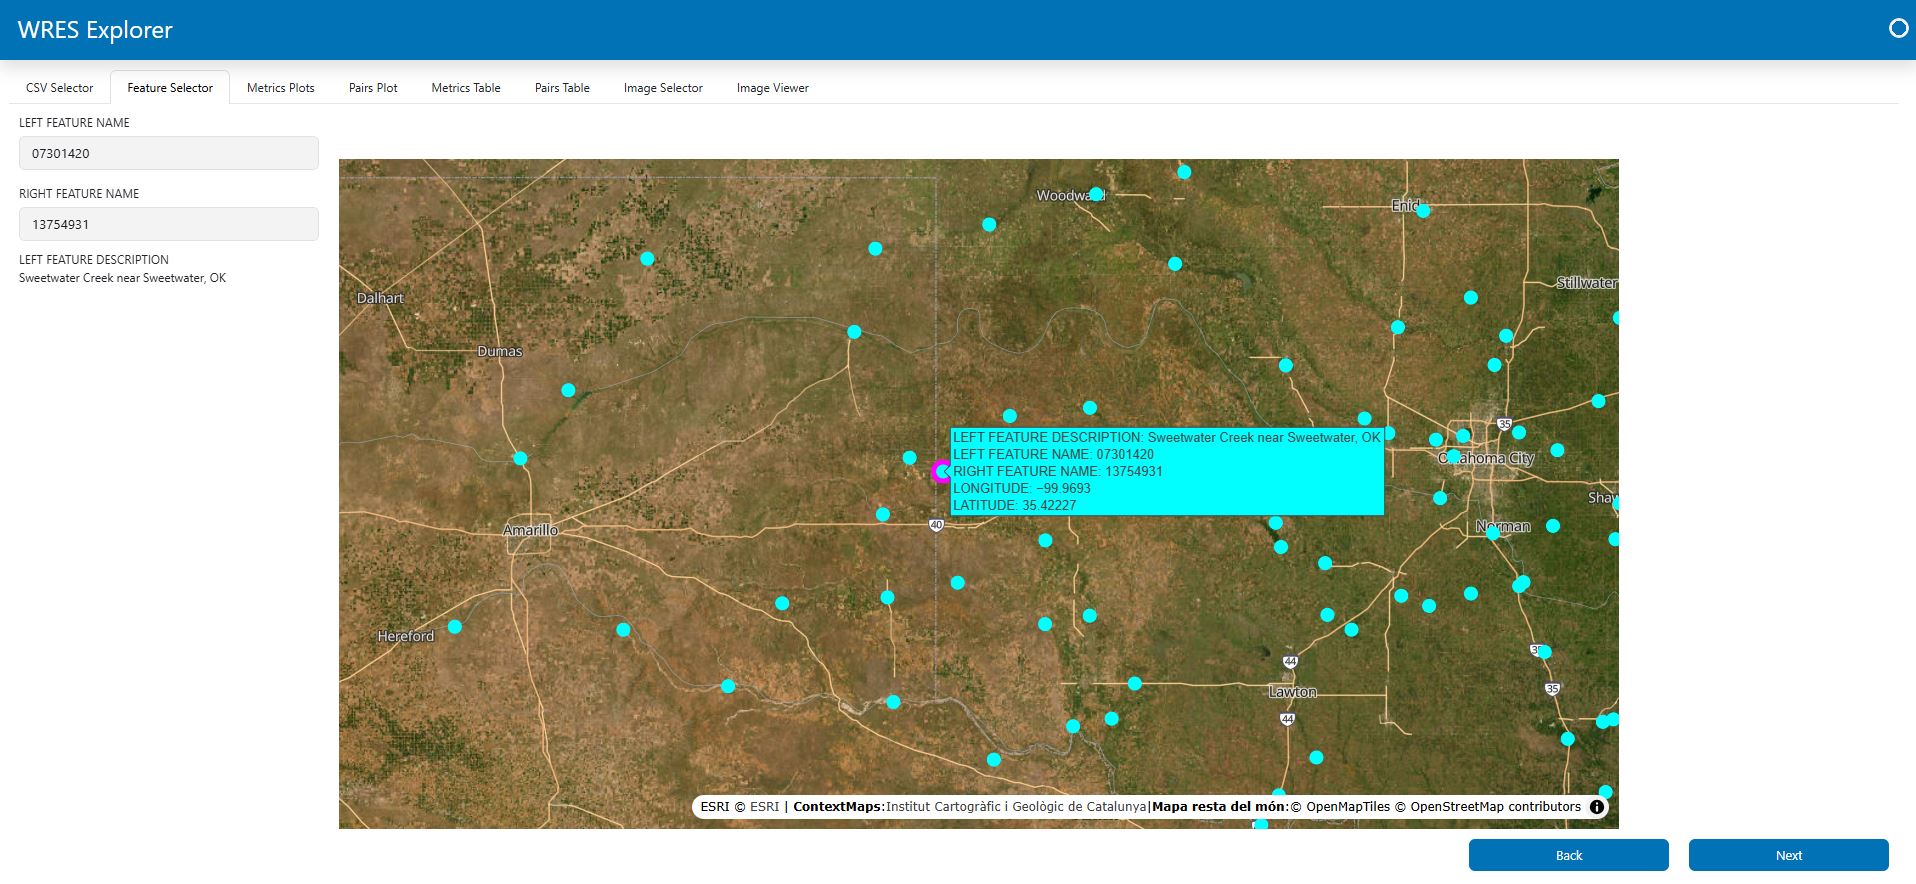
To inspect the metrics at a specific feature (site), you need to select a feature from the selection boxes or by clicking on the map. The available options are determined by the features found in the files you selected earlier. Note the selected site in magenta.
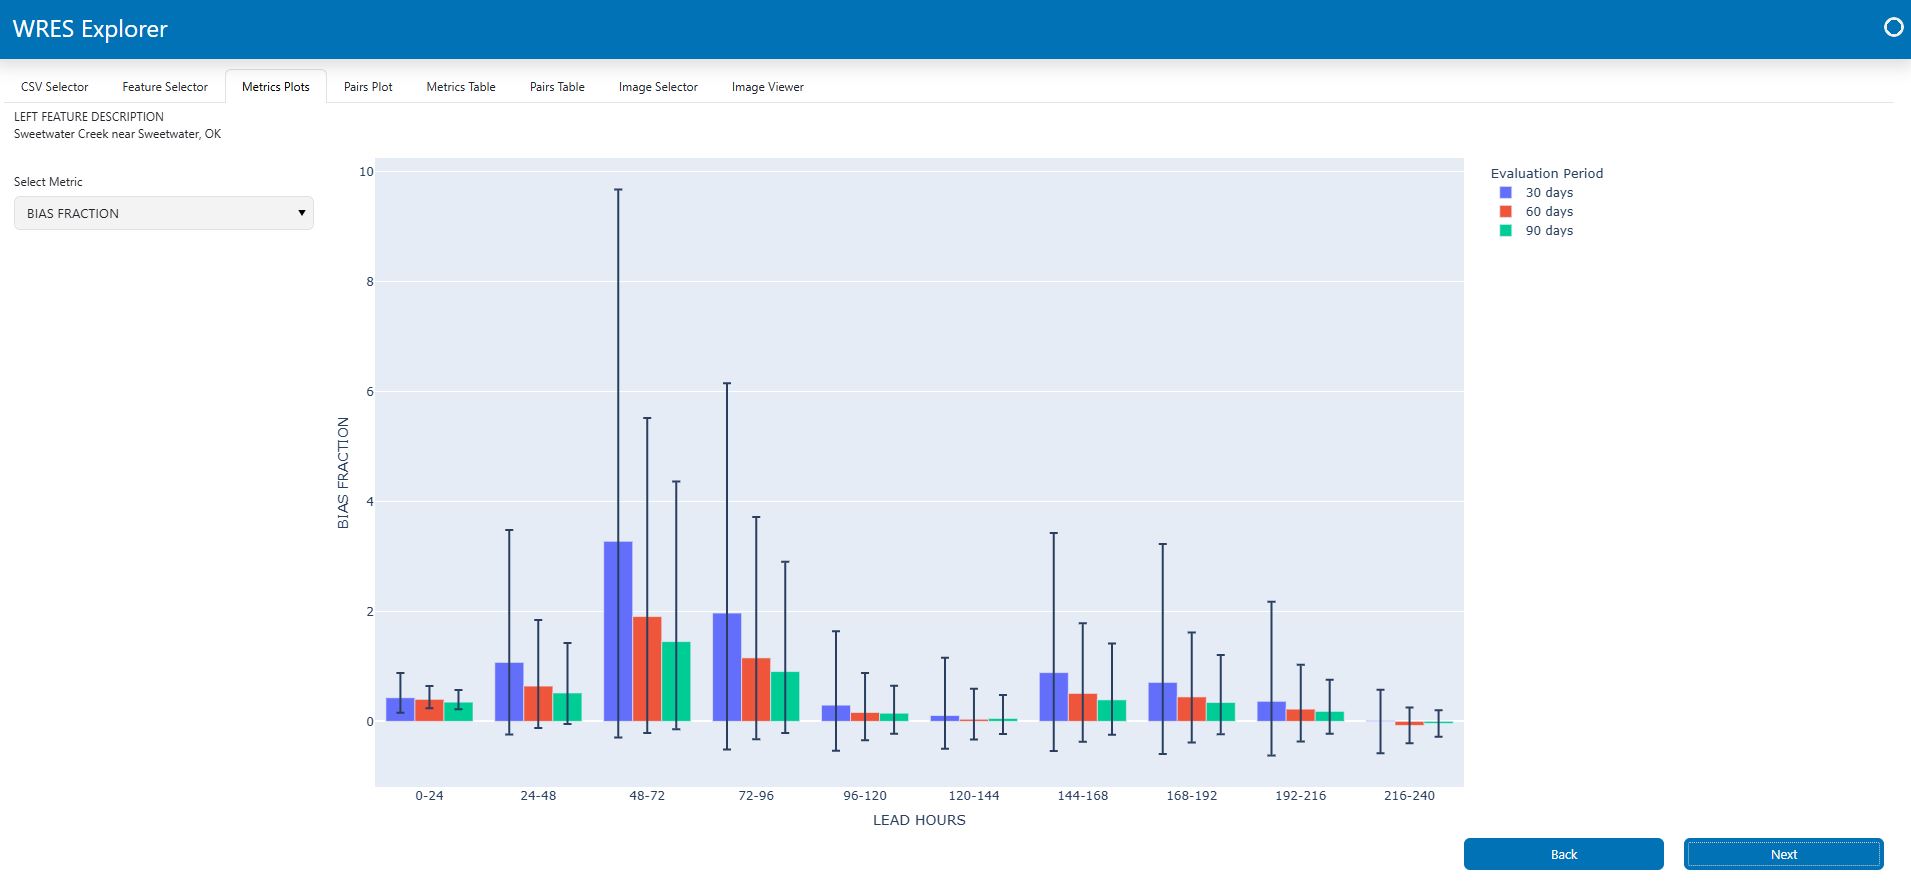
After a site is selected, the "Metrics Plots" tab will be populated with plots showing the metrics found at this feature. Use the dropdown menu ("Select Metric") to view different metrics.
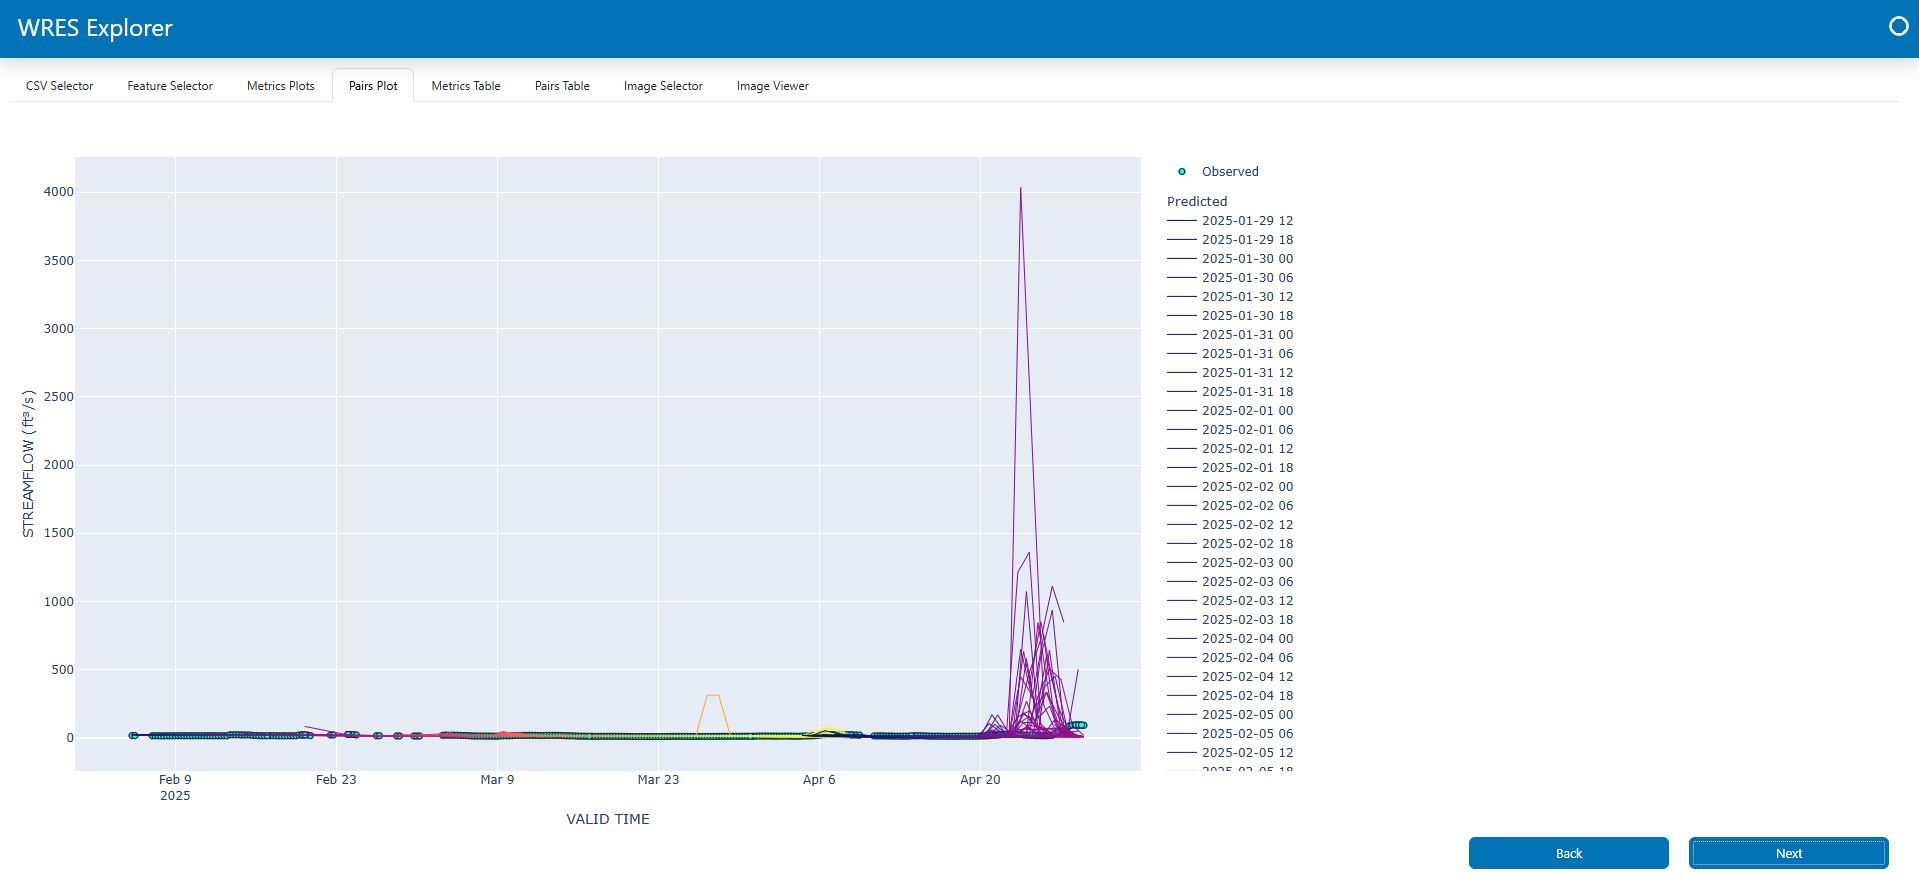
After a site is selected, the "Pairs Plots" tab will be populated with plots showing the pairs (time series) for the selected feature.
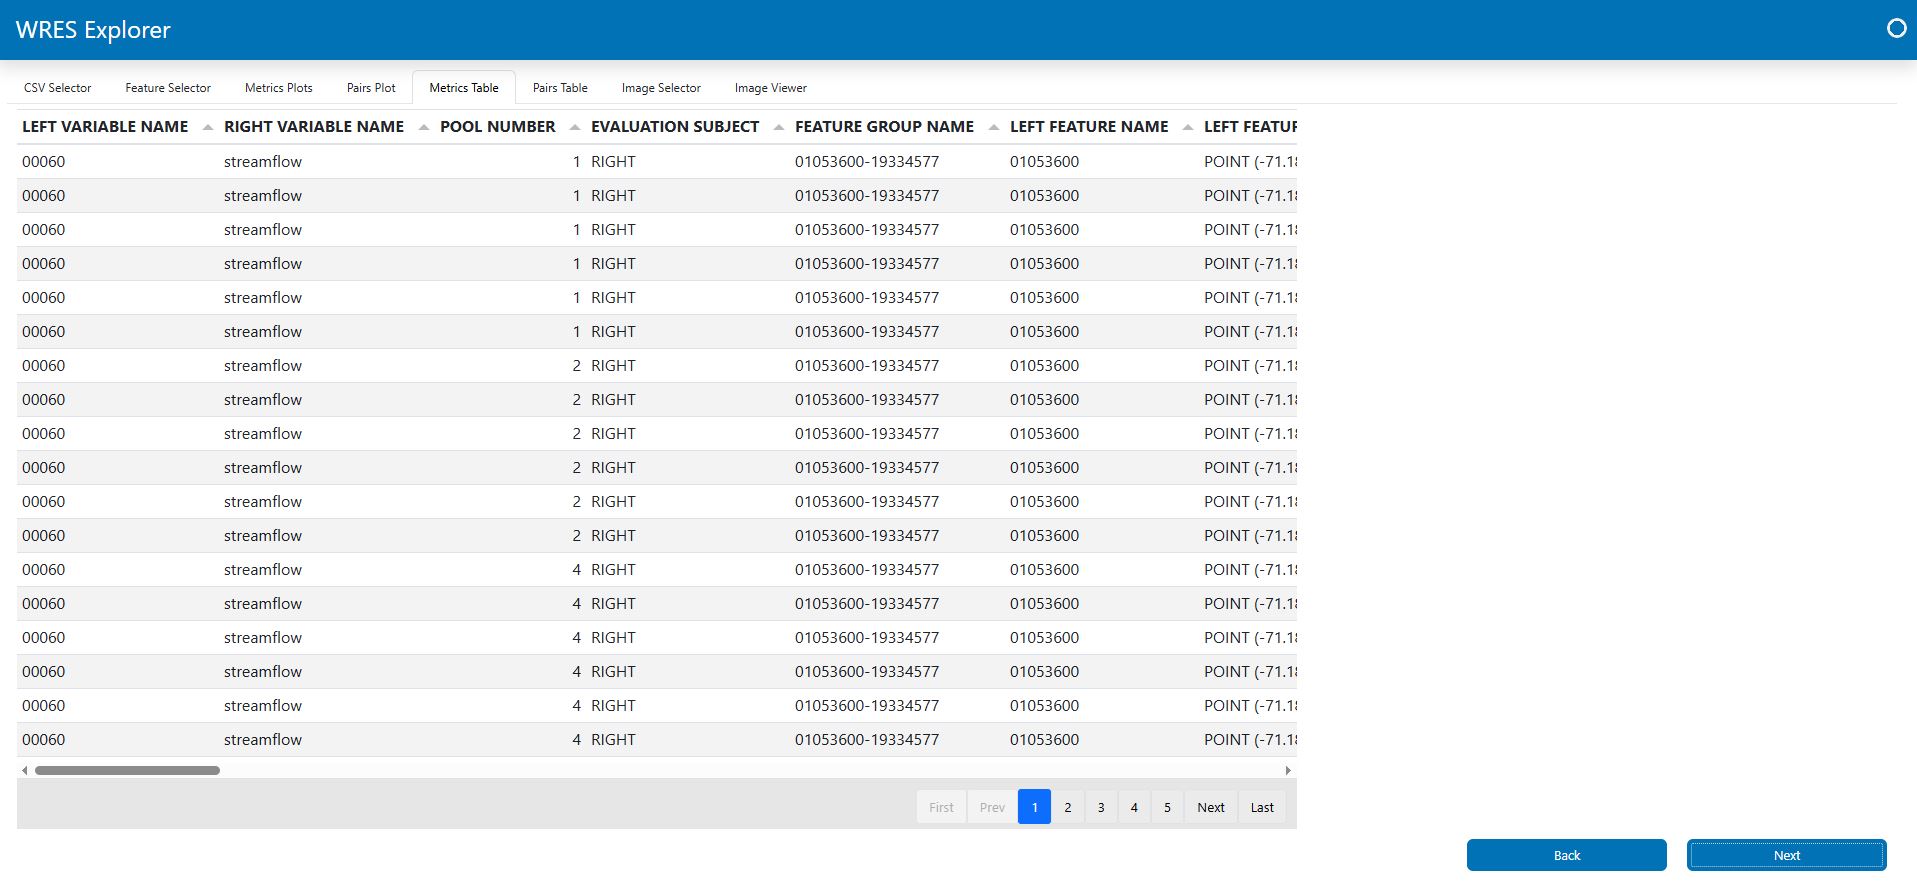
Once data are loaded, you will be able to explore the metrics file(s) contents through a paging tabular interface shown below.
You can also explore the pairs file(s) contents through a paging tabular interface.

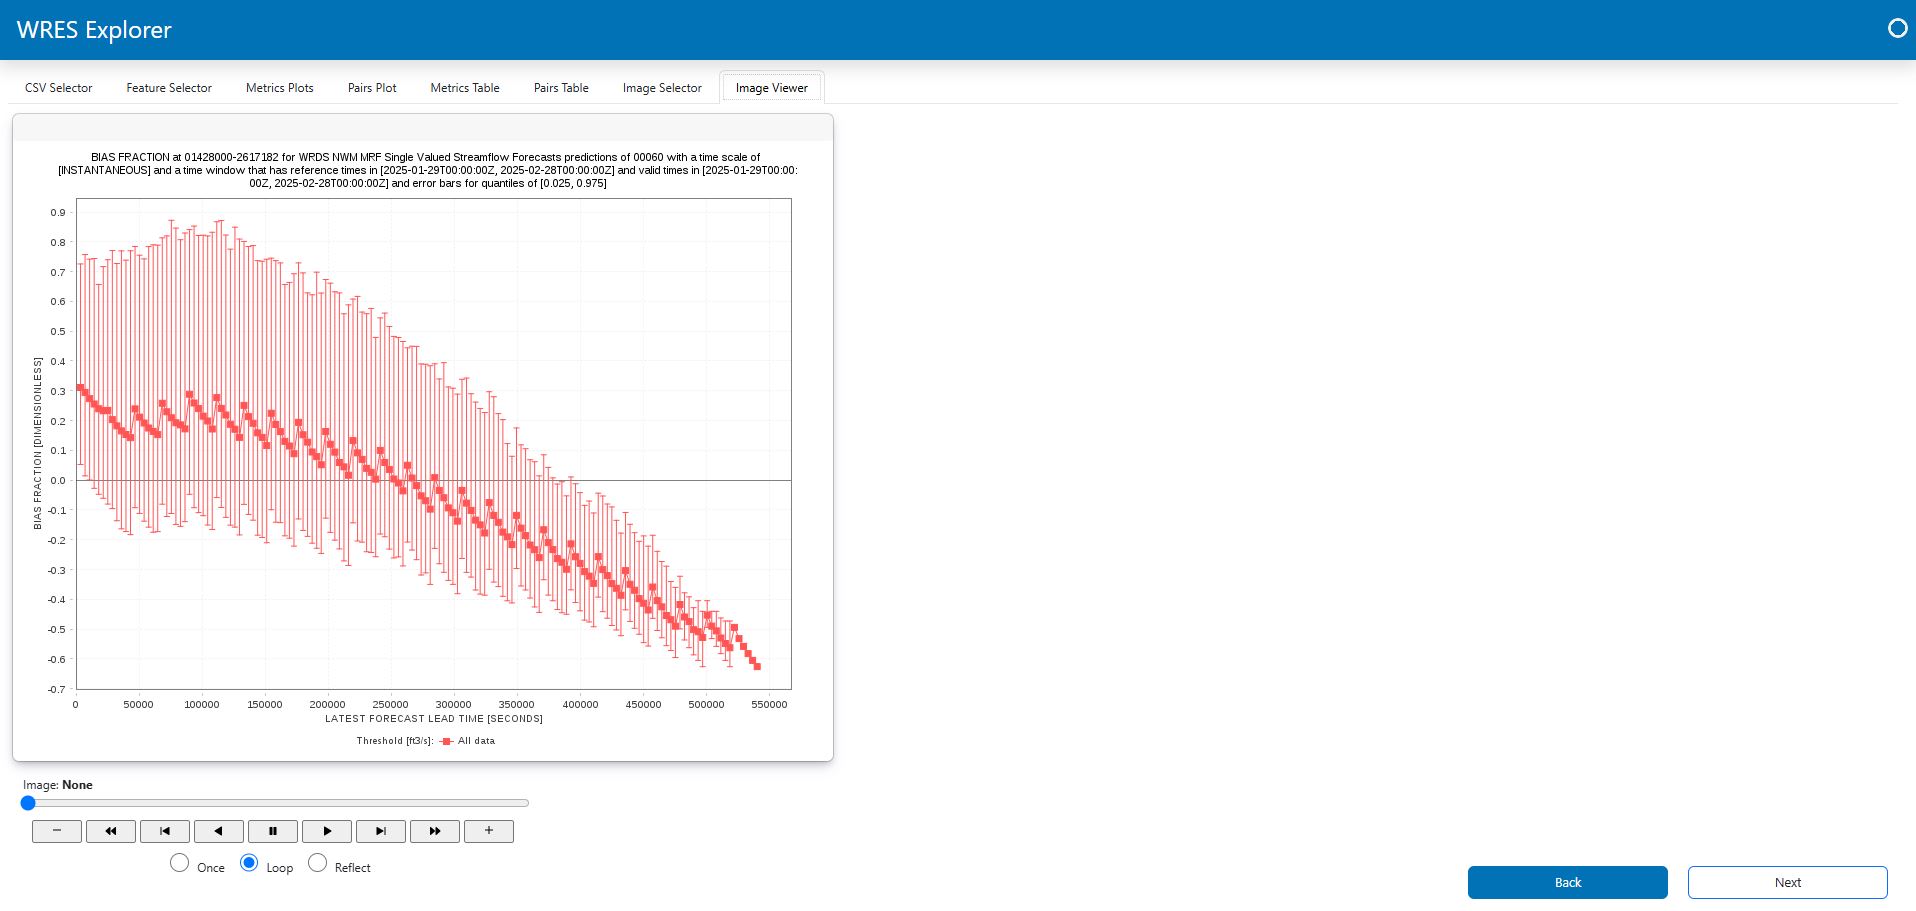
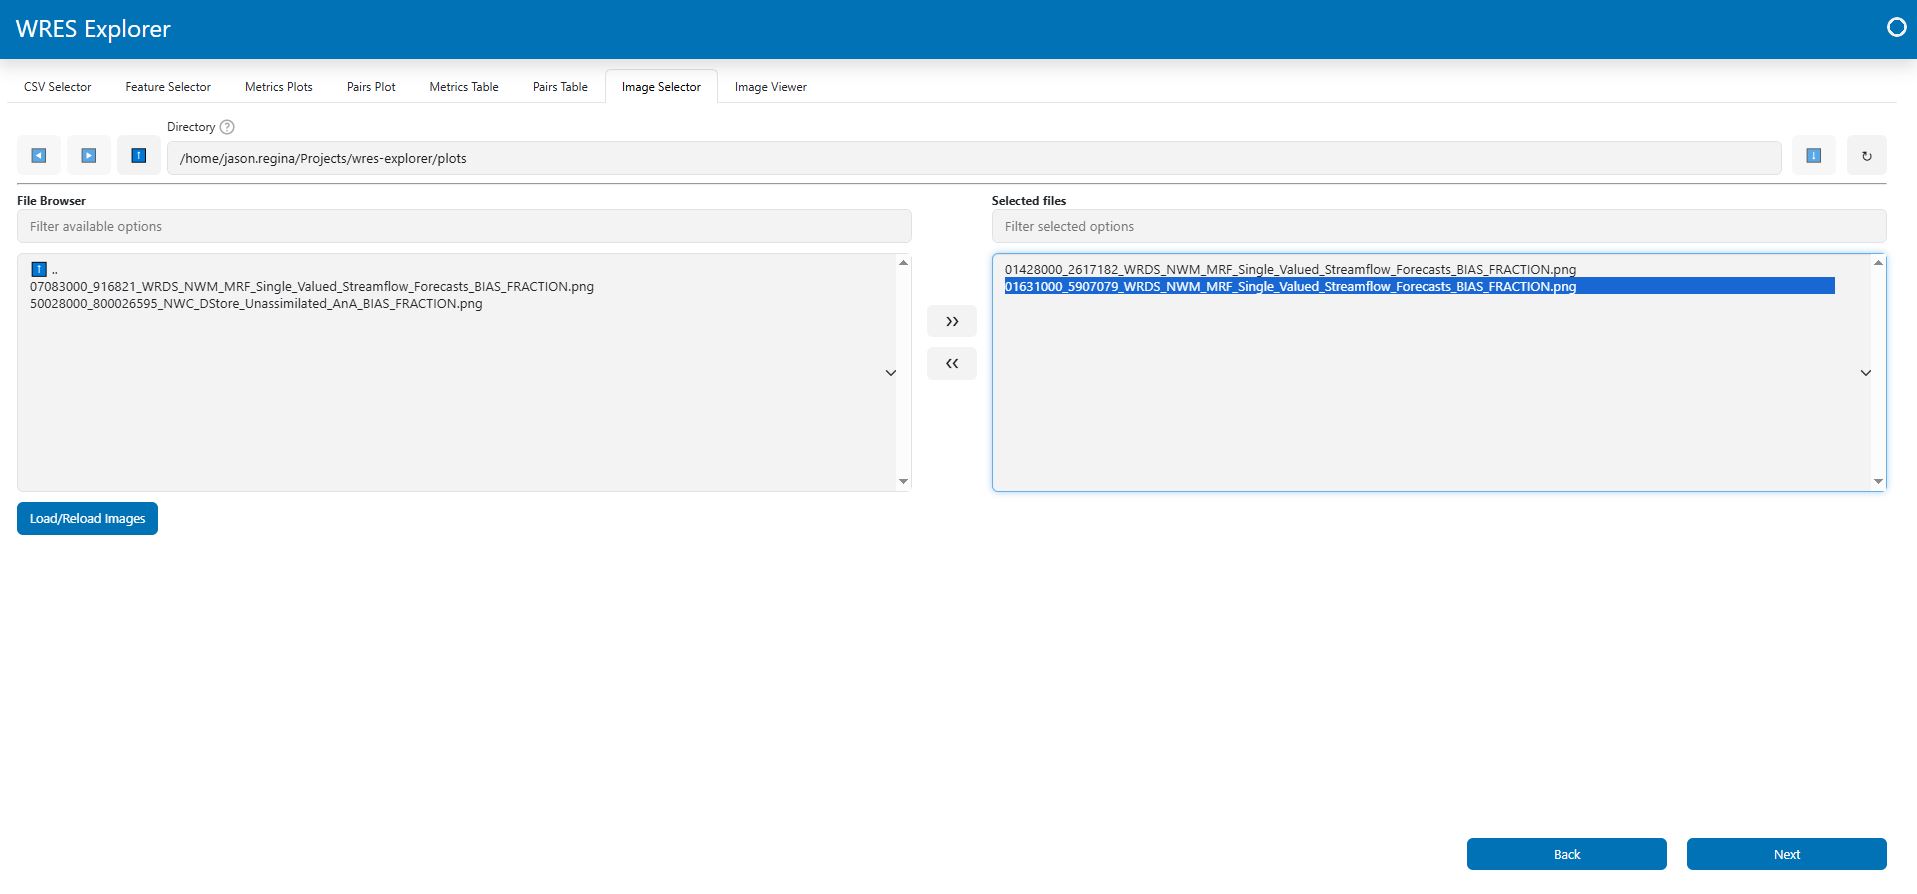
You can use the image selector tab to select and load WRES .png files for display and exploration. Selecting one or more image files and clicking "Load/Reload Images" will populate the "Image Viewer."
The "Image Viewer" includes a carousel style image browser for exploring WRES plots.