PwC Switzerland Power BI Job Simulation on Forage - March 2025
PwC Virtual Internship – Business Intelligence Analyst
Client: PhoneNow
Tools Used: Power BI, Excel
As part of the PwC Virtual Internship, I worked on three key industrial tasks for PhoneNow, leveraging Power BI to provide data-driven insights:
Analyzed call volumes, average handling time (AHT), and customer satisfaction (CSAT) metrics.
Identified peak call hours and agent performance trends to optimize workforce allocation.
Created an interactive dashboard to track key performance indicators (KPIs) and improve operational efficiency.
Examined churn rates, customer lifetime value (CLV), and engagement patterns.
Conducted cohort analysis to identify retention trends and potential areas for improvement.
Designed a Power BI report highlighting customer segments at risk of churn and actionable retention strategies.
Assessed workforce diversity across gender, ethnicity, and age demographics.
Evaluated hiring trends, promotion equity.
Developed a visual report to showcase inclusivity progress and recommend data-driven HR policies.
Through this internship, I gained hands-on experience in data analytics, storytelling, and dashboard development, translating complex datasets into meaningful business insights.
Visualizing customer and agent behavior:
Create a dashboard in Power BI for Call Centre Manager that reflects all relevant Key Performance Indicators (KPIs) and metrics in the dataset.
The purpose of this analysis is to create a dashboard in PowerBI for call canter manager that reflects all relevant Key Performance Indicators (KPIs) and metrics in the dataset.
Possible KPIs include:
• Overall customer satisfaction
• Overall calls answered/abandoned
• Calls by time
• Average speed of answer
• Agents performance quadrant -> average handle time(talk duration) vs calls answered
The Dataset used for this analysis was presented by PWC Switzerland and available at their official website page.
(I also Uploaded the Dataset in the respective file folder.)
Data transformation was done in Power Query and the dataset was loaded into Microsoft Power BI Desktop for modelling.
The call canter dataset is given by a table named:
Call Center; which has 10 columns and 5000 rows of observation.
| Column Name | Description |
|---|---|
| Call Id | Represents every unique observation in the dataset |
| Agent | Describes the name of the agent |
| Date | Describes the date of the call |
| Time | Represents the time of the call |
| Topic | Describes the topic of the caller |
| Answered | (Y/N) Describes if the call was Answered or not |
| Resolved | Describes if the problem was Resolved or not |
| Speed of answer(in seconds) | Represents the speed of answer in seconds |
| AvgTalkDuration | Represents the average talk duration of call |
| Satisfaction rating | Represents the satisfaction rating of the agent during the call |
Data Cleaning and transformation for the dataset were done in power query as follows:
Unnecessary columns were removed
Each of the columns in the table was validated to have the correct data type
Unnecessary rows were removed
Data visualization for the datasets was done in Microsoft Power BI Desktop:
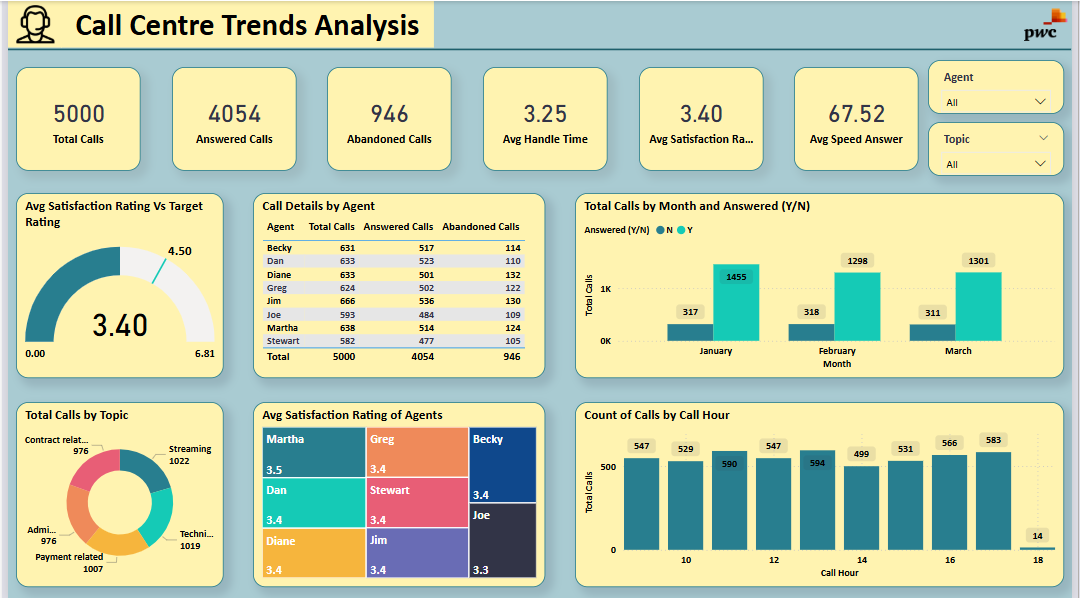
The Call Center Manager Page: Shows KPIs including overall customer satisfaction, overall calls answered/abandoned, calls by time, average speed of answer, agents performance quadrant -> average handle time(talk duration) vs calls answered.
Measures used in visualization are:
1.Total Calls = COUNT(Sheet1[Call Id])
2.Target_Rating = 4.5
3.Avg Speed Answer = DIVIDE(SUM(Sheet1[Speed of answer in seconds]),
COUNTROWS(FILTER(Sheet1, Sheet1[Answered (Y/N)]="Y")))
4.Avg Satisfaction Rating = CALCULATE(AVERAGE(Sheet1[Satisfaction rating]),
FILTER(Sheet1, Sheet1[Answered (Y/N)]="Y"))
5.Avg Handle Time = AVERAGEX(FILTER(Sheet1, Sheet1[Answered (Y/N)]="Y"
),Sheet1[AverageTalkDurationInMinutes])
6.Answered Calls = CALCULATE(COUNT(Sheet1[Call Id]),
Sheet1[Answered (Y/N)]="Y")
7.Abandoned Calls = CALCULATE(COUNT(Sheet1[Call Id]),
Sheet1[Answered (Y/N)]="N")
Calculated Columns used in visualization are:
1.Call Hour = HOUR(Sheet1[Time])
2.AverageTalkDurationInMinutes = HOUR(Sheet1[AvgTalkDuration]*60
+ MINUTE(Sheet1[AvgTalkDuration])
+SECOND(Sheet1[AvgTalkDuration]/60))
It can be deduced that:
• The average satisfaction rating is 3.40
• 4054 calls were answered and 3646 issues resolved
• Jim has the highest satisfaction rating
• The average speed of answer is 67.52 seconds
• Jim has answered total 536 call which is highest whereas Stewart answered lowest number of calls i.e. 477
Report Page
The telecom Retention Manager has scheduled a meeting with the engagement partner at PwC to cover these points:
• Customers in the telecom industry are hard-earned: we don’t want to lose them.
• The retention department is here to get customers back in case of termination.
• Currently, we get in touch after they have terminated the contract, but this is reactionary: it would be better to know in advance who is at risk.
• We have done customer analysis with Excel: it has always ended in a dead-end.
• We would like to know more about our customers: visualised clearly so that it’s self-explanatory for our management.
The engagement partner, asks you to do the following tasks:
• Define proper KPIs
• Create a dashboard for the retention manager reflecting the KPIs
• Write a short email to him (the engagement partner) explaining your findings, and include suggestions as to what needs to be changed
Here are some inputs:
• Customers who left within the last month
• Services each customer has signed up for: phone, multiple lines, internet, online security, online backup, device protection, tech support, and streaming TV and movies
• Customer account information: how long as a customer, contract, payment method, paperless billing, monthly charges, total charges and number of tickets opened in the categories administrative and technical
• Demographic info about customers – gender, age range, and if they have partners and dependents
The Dataset used for this analysis was presented by PWC Switzerland and available in their official website page.
(I also Uploaded the Dataset in the respective file folder.)
Data transformation was done in Power Query and the dataset was loaded into Microsoft Power BI Desktop for modelling.
The Customer Retention dataset is given by a table named:
Customer retention(Churn Dataset) which has 23 columns and 7043 rows of observation;
| Column Name | Description |
|---|---|
| customerID | Represents the unique number of the customer in the dataset |
| gender | Describes the gender of the customer |
| SeniorCitizen | Describes if the customer is a senior citizen |
| Partner | Describes if the customer has a partner |
| Dependents | Describes if the customer has a dependent |
| tenure | Describes how long as a customer |
| PhoneService | Describes if the customer has registered a phone service |
| MultipleLines | Describes if the customer has registered multiple lines |
| InternetService | Describes if the customer has registered for internet service |
| OnlineSecurity | Describes if the customer has registered for online security |
| OnlineBackup | Describes if the customer has registered for online backup |
| DeviceProtection | Describes if the customer has registered for device protection |
| TechSupport | Describes if the customer has registered for tech support |
| StreamingTV | Describes if the customer has registered to stream tv |
| StreamingMovies | Describes if the customer has registered to stream movies |
| Contract | Describes if the length of the contract of the customer |
| PaperlessBilling | Describes if the customer has registered for paperless billing |
| PaymentMethod | Describes the payment method of the customer |
| MonthlyCharges | Represents the monthly charge incurred by the customer |
| TotalCharges | Represents the total charge incurred by the customer |
| numAdminTickets | Represents the number of admin tickets opened by the customer |
| numTechTickets | Represents the number of tech tickets opened by the customer |
| Churn | Describes if the customer is at risk of churn |
Data Cleaning and transformation for the dataset were done in power query as follows:
• Each of the columns in the table was validated to have the correct data type
• Unnecessary rows were removed
Data Modelling
After the dataset was cleaned and transformed, it was ready to be modelled.
Data visualization for the datasets was done in Microsoft Power BI Desktop:
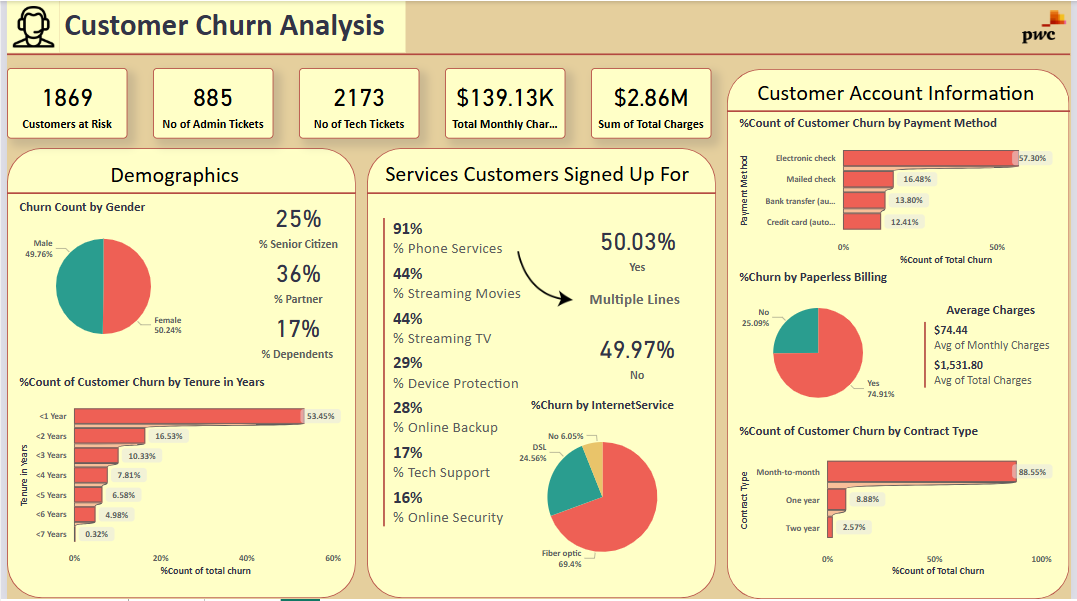
• Demographic Info : Shows the male-female distribution, churn by senior citizen, dependents impact, partner impact, effect of internet service provider, recommendations and a short insight on the report
• Account Info : shows contract type, payment method, tenuraity impact on customer count, total charges, average monthly charges etc
• Services : shows customer count by streamingTV, customer count by streamingmovies, churn by phoneservice, online security device protection, Tech support etc
• Email / Insights and suggestion :Insights and suggestions to the engagement partner explaining findings, and include suggestions as to what needs to be changed
Measures used in visualization are:
-
Churn Count = CALCULATE(COUNT('Churn-Dataset'[Churn]), 'Churn-Dataset'[Churn]="Yes")
-
%Churn Rate =
DIVIDE(CALCULATE(COUNT('Churn-Dataset'[Churn]), 'Churn-Dataset'[Churn]="Yes"),
COUNT('Churn-Dataset'[Churn]),0)
3.% Yes Multiple Line = DIVIDE(CALCULATE(COUNT('Churn-Dataset'[MultipleLines]),
'Churn-Dataset'[MultipleLines]="Yes", 'Churn-Dataset'[Churn]="Yes"),
CALCULATE(COUNT('Churn-Dataset'[MultipleLines]), 'Churn-Dataset'[MultipleLines]<>"No phone service"),0
)
4.% Tech Support = DIVIDE(CALCULATE(COUNT('Churn-Dataset'[TechSupport]),
'Churn-Dataset'[TechSupport]="Yes", 'Churn-Dataset'[Churn]="Yes"),
CALCULATE(COUNT('Churn-Dataset'[TechSupport]), 'Churn-Dataset'[Churn]="Yes"),0
)
5.% Streaming TV = DIVIDE(CALCULATE(COUNT('Churn-Dataset'[StreamingTV]),
'Churn-Dataset'[StreamingTV]="Yes", 'Churn-Dataset'[Churn]="Yes"),
CALCULATE(COUNT('Churn-Dataset'[StreamingTV]), 'Churn-Dataset'[Churn]="Yes"),0
)
6.% Streaming Movies = DIVIDE(CALCULATE(COUNT('Churn-Dataset'[StreamingMovies]),
'Churn-Dataset'[StreamingMovies]="Yes", 'Churn-Dataset'[Churn]="Yes"),
CALCULATE(COUNT('Churn-Dataset'[StreamingMovies]), 'Churn-Dataset'[Churn]="Yes"),0
)
7.% Senior Citizen = DIVIDE(CALCULATE(COUNT('Churn-Dataset'[SeniorCitizen]),
'Churn-Dataset'[SeniorCitizen]=1, 'Churn-Dataset'[Churn]="Yes"),
CALCULATE(COUNT('Churn-Dataset'[SeniorCitizen]), 'Churn-Dataset'[Churn]="Yes")
)
8.% Phone Services = DIVIDE(CALCULATE(COUNT('Churn-Dataset'[PhoneService]),
'Churn-Dataset'[PhoneService]="Yes", 'Churn-Dataset'[Churn]="Yes"),
CALCULATE(COUNT('Churn-Dataset'[PhoneService]), 'Churn-Dataset'[Churn]="Yes"),0
)
9.% Partner = DIVIDE(CALCULATE(COUNT('Churn-Dataset'[Partner]),
'Churn-Dataset'[Partner]="Yes", 'Churn-Dataset'[Churn]="Yes"),
CALCULATE(COUNT('Churn-Dataset'[Partner]), 'Churn-Dataset'[Churn]="Yes"),0
)
10.% Online Security = DIVIDE(CALCULATE(COUNT('Churn-Dataset'[OnlineSecurity]),
'Churn-Dataset'[OnlineSecurity]="Yes", 'Churn-Dataset'[Churn]="Yes"),
CALCULATE(COUNT('Churn-Dataset'[OnlineSecurity]), 'Churn-Dataset'[Churn]="Yes"),0
)
11.% Online Backup = DIVIDE(CALCULATE(COUNT('Churn-Dataset'[OnlineBackup]),
'Churn-Dataset'[OnlineBackup]="Yes", 'Churn-Dataset'[Churn]="Yes"),
CALCULATE(COUNT('Churn-Dataset'[OnlineBackup]), 'Churn-Dataset'[Churn]="Yes"),0
)
12.% No Multiple Line = DIVIDE(CALCULATE(COUNT('Churn-Dataset'[MultipleLines]),
'Churn-Dataset'[MultipleLines]="No", 'Churn-Dataset'[Churn]="Yes"),
CALCULATE(COUNT('Churn-Dataset'[MultipleLines]), 'Churn-Dataset'[MultipleLines]<>"No phone service"),0
)
13.% Device Protection = DIVIDE(CALCULATE(COUNT('Churn-Dataset'[DeviceProtection]),
'Churn-Dataset'[DeviceProtection]="Yes", 'Churn-Dataset'[Churn]="Yes"),
CALCULATE(COUNT('Churn-Dataset'[DeviceProtection]), 'Churn-Dataset'[Churn]="Yes"),0
)
14.% Dependents = DIVIDE(CALCULATE(COUNT('Churn-Dataset'[Dependents]),
'Churn-Dataset'[Dependents]="Yes", 'Churn-Dataset'[Churn]="Yes"),
CALCULATE(COUNT('Churn-Dataset'[Dependents]), 'Churn-Dataset'[Churn]="Yes"),0
)
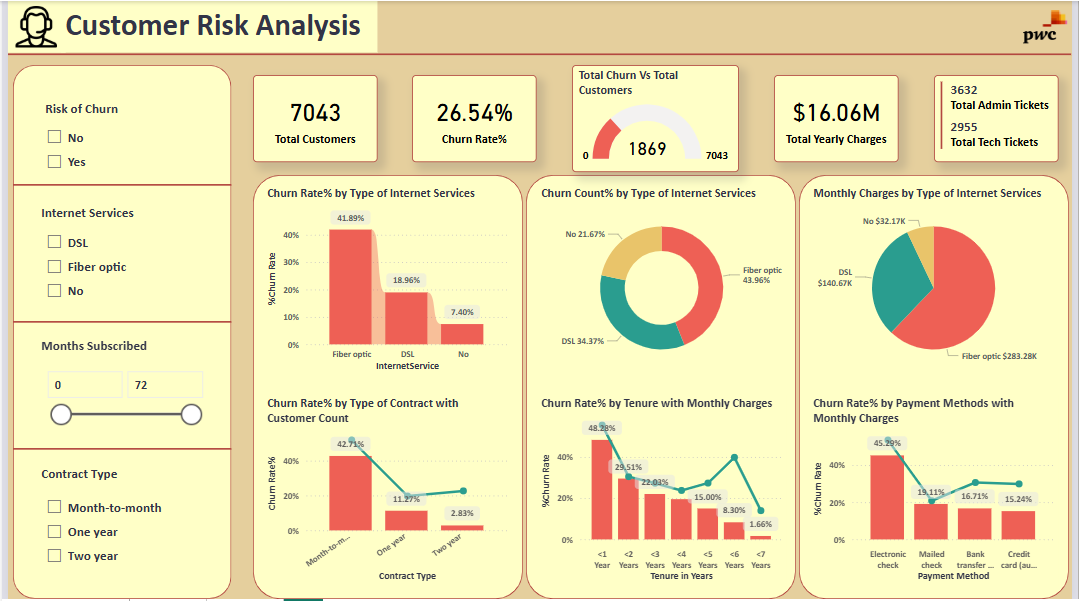
As shown by Data Visualization, It can be deduced that:
• Higher churn rate:
Younger customers (under 3 years).
Customers with paperless billing.
Customers with monthly subscriptions.
• Lower churn rate:
Customers with senior citizen discount.
Customers with multiple lines of service.
Customers with annual subscriptions.
• If no Tech Support, Device Protection, and Online Security are provided then the chances of customers churning are high.
• payment method like Electronic check also makes a significant impact on the churning decision.
• There is no relation between gender with churning.
• senior citizens are less likely to churn.
• Customers with any dependents or partners are churning less likely, whereas the non-dependents and non-partners customers are more likely to shift.
• Tenure and contract play an important role in determining whether the customer will churn. Customers with monthly contracts i.e. lower tenure will switch frequently.
• Customers with Fiber Optic internet service will churn more compared to DSL internet service holders.
Suggestions
• Increasing the basic contract plan from 1 month to 3 months or 6 months can be a good starting point. This will help customers to be with us for a longer tenure.
• Starting special offers or schemes for customers who are single and have no family responsibility. They can become a permanent customer of the company. 'Catch them Young' is key to success here.
• provide some offers to the senior citizens as they are stable customers like offer some discounts on long tenure plans.
• Offering basic services like device protection, tech support, and online security should be the primary goal. This will help the customer stay longer with the brand.
Report Page 1
Report Page 2
Task is to do the following:
• Define relevant KPIs in hiring, promotion, performance and turnover, and create a visualisation.
• Write what you think some root causes of their slow progress might be.
The Dataset used for this analysis was presented by PWC Switzerland and available at their official website page.
(I also Uploaded the Dataset in the respective file folder.)
Data transformation was done in Power Query and the dataset was loaded into Microsoft Power BI Desktop for modelling.
The Diversity & Inclusion dataset is given by a table named:
• Diversity & Inclusion; which has 32 columns and 500 rows of observation
| Column Name | Description |
|---|---|
| Employee ID | Represents the unique number of the employee in the dataset |
| Gender | Describes the gender of the employee |
| Job Level after FY20 promotions | Describes the job level of the employee after being promoted in FY20 |
| New hire FY20? | Describes if the employee is a new hire in FY20 |
| FY20 Performance Rating | Represents the performance rating of the employee in FY20 |
| Promotion in FY21? | Describes if the employee is being promoted in FY21 |
| In base group for Promotion FY21 | Describes if the employee is being selected for promoted in FY21 |
| Target hire balance | Describes the target hire balance of the employee |
| FY20 leaver? | Describes if the employee is a leaver in FY20 |
| In base group for turnover FY20 | Describes if the employee is in a group for turnover in FY20 |
| Department @01.07.2020 | Describes the department each employee belongs to as at January 7, 2020 |
| Leaver FY | Describes if the employee is a leaver in a FY |
| Job Level after FY21 promotions | Describes the job level of the employee after being promoted in FY21 |
| Last Department in FY20 | Describes the last department each employee belongs in FY20 |
| FTE group | Describes if the employee belongs to a FTE group |
| Time type | Describes the contract type employee |
| Department & JL group PRA status | Describes the department and JL group PRA status of the employee |
| Department & JL group for PRA | Describes the department and JL group PRA of the employee |
| Job Level group PRA status | Describes the job level group PRA status of the employee |
| Job Level group for PRA | Describes the job level group PRA of the employee |
| Time in Job Level @01.07.2020 | Describes the time in job level of the employee |
| Job Level before FY20 promotions | Describes the job level employee before being promoted in FY20 |
| Promotion in FY20? | Describes if the employee is being promoted in FY20 |
| FY19 Performance Rating | Describes the performance rating of the employee in FY19 |
| Age group | Describes the age group of the employee |
| Age @01.07.2020 | Represents the age of the employee as at January 07, 2020 |
| Nationality 1 | Describes the nationality of the employee in state level |
| Region group: nationality 1 | Describes the nationality of the employee in country level |
| Broad region group: nationality 1 | Describes the nationality of the employee in regional level |
| Last hire date | Describes the last hire date of the employee |
| Years since last hire | Represents the number of years since last hire of the employee |
| Rand | generates random number for each entry in the dataset |
Data Cleaning and transformation for the dataset were done in power query as follows:
• Each of the columns in the table was validated to have the correct data type.
• Unnecessary rows were removed.
• Unnecessary rows were filtered.
Data Modelling
• After the dataset was cleaned and transformed, it was ready to be modelled.
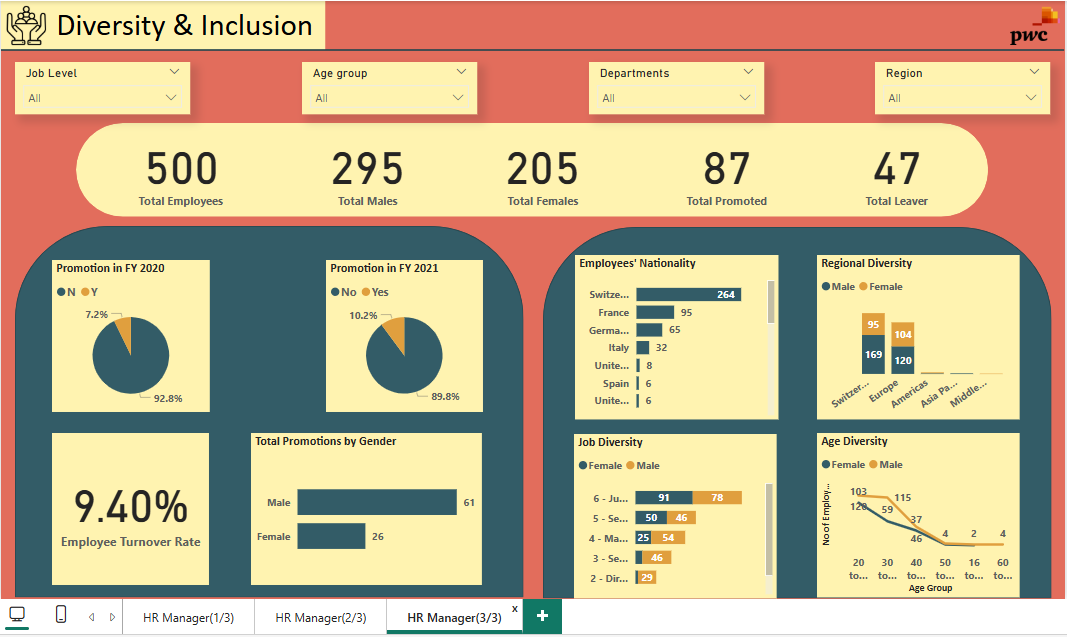
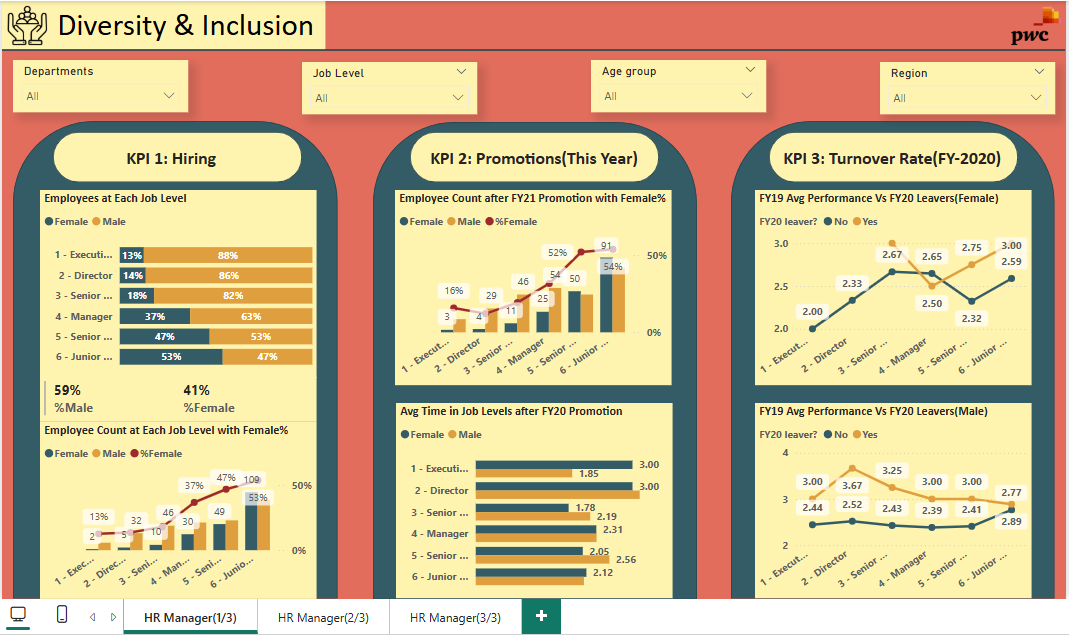
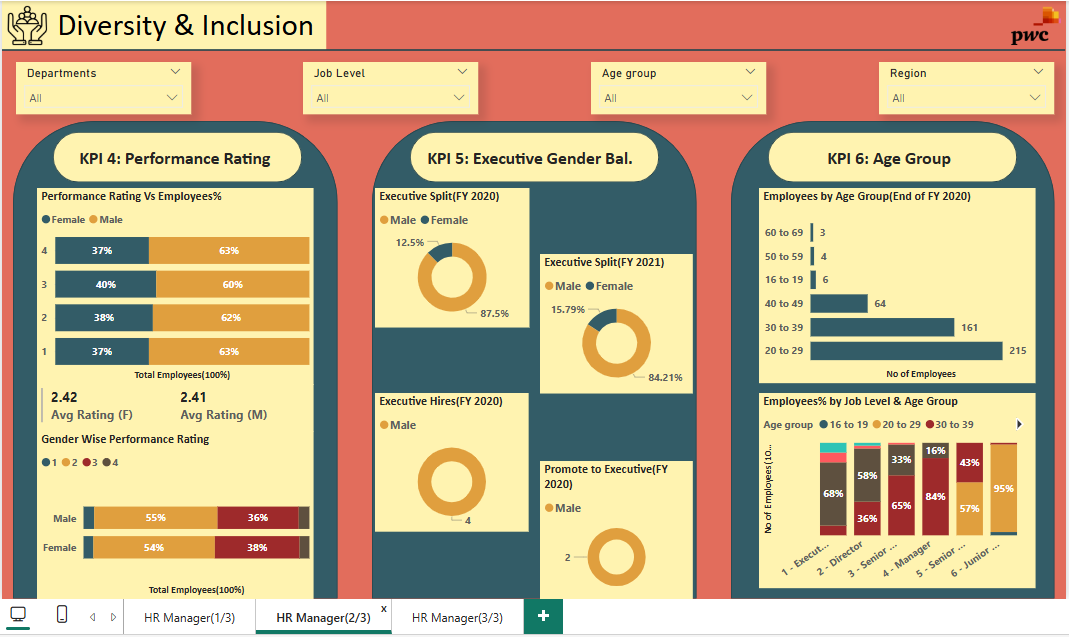
Data visualization for the datasets was done in Microsoft Power BI Desktop:
• KPI 1 (Hiring): Employees hired at each job level, % of male and female employees hired, employee count at each job level with %female employees.
• KPI 2 (Promotion(This Year 2021)): Employee count at each job level after promotion with %female employee, average time duration at each job level of male and female employees.
• KPI 3 (Turnover Rate(FY 2020)): FY19 avg performance Vs FY20 Leaver(Female), FY19 avg performance Vs FY20 Leaver(Male)
• KPI 4 (Performance Rating): Performance Rating Vs Employee %, Average performance rating of male and female employees, Gender wise performance rating.
• KPI 5 (Executive Gender Balance): Executive Split(FY 20), Executive Split(FY 21), Executive Hired(FY 20), Promoted to Executive(FY 20).
• KPI 6 (Age Group): Employee Count Vs Age Group, Employee% Vs Job level and Age Group
• Diversity & Inclusion EDA
Measures used in visualization are:
-
#Female = CALCULATE(COUNT('Pharma Group AG'[Employee ID]),
'Pharma Group AG'[Gender]="Female") -
#Male = CALCULATE(COUNT('Pharma Group AG'[Employee ID]),
'Pharma Group AG'[Gender]="Male") -
%Female = DIVIDE([#Female], COUNT('Pharma Group AG'[Employee ID]),0)
-
%Male = DIVIDE([#Male], COUNT('Pharma Group AG'[Employee ID]),0)
-
Avg_Rating_Female =
CALCULATE(AVERAGE('Pharma Group AG'[FY20 Performance Rating])
, 'Pharma Group AG'[Gender]="Female") -
Avg_Rating_Male =
CALCULATE(AVERAGE('Pharma Group AG'[FY20 Performance Rating])
, 'Pharma Group AG'[Gender]="Male") -
Total Promotions = CALCULATE(COUNT('Pharma Group AG'[Promotion in FY20?]), 'Pharma Group AG'[Promotion in FY20?]="Y")
+
CALCULATE(COUNT('Pharma Group AG'[Promotion in FY21?]), 'Pharma Group AG'[Promotion in FY21?]="Yes") -
Turnover Rate = DIVIDE(COUNT('Pharma Group AG'[Leaver FY]), COUNT('Pharma Group AG'[Employee ID]),0)
As shown by Data Visualization, It can be deduced that:
• Overall, the company seems to have a good gender balance in terms of hiring, with women making up just under half (41%) of new hires.
• However, there is a significant disparity in promotion rates, with only 25% of promotions going to women. This suggests that there may be barriers in place that are preventing women from being promoted at the same rate as men.
• The turnover rate is higher for women than for men. This could be due to a number of factors, including the gender pay gap, a lack of opportunities for advancement, or a hostile work environment.
• Maximum hiring of employees is done from Switzerland, France & Germany respectively, hence in order to increase diversity need to hire talented employees from different part of globe.
• The slow progress in the executive level is of the fact that only less than 20% female is promoted to this managerial and executive roles.
• FY20 Hires vs FY21 Job Level: While the number of females hired increased slightly from FY20 (40) to FY21 (41), the number of females in senior positions (director and above) remained the same (3) in both years. This indicates a potential gap in promoting women to higher-level positions.
• Women are more likely to be in lower-level positions, such as junior officers and managers, while men are more likely to be in higher-level positions, such as directors and executives. This suggests that there may be a lack of opportunities for women to progress to senior leadership positions.
Suggestions
To ensure progress in diversity and inclusion in the executive level;
• More women should be hired and especially promoted because the gap in the ratio of men to women is quite large.
• For the Executive and Director position ,female employee count as well as the promotion count is too low compared to male employee hence more women should be hired as well as promoted.
Report Page 1
Report Page 2
Report Page 3