Spotify is a globally available audio platform comprising of different songs, podcasts, playlists,albums of different singers,entertainers and artists. So, in this project we analyzed the audio dynamics of numerical features of different tracks and thus recommend top songs based on the tracks of a particular playlist.
The dataset we are working on is a combination of different playlists comprising of information like -
- Number of tracks in that playlist
- Number of albums used in that playlist
- Followers of that playlist
This web-scrapped dataset of 2017 consists of over 90,000 entries and was broken down into 4 json file for simpler transferrable purpose.
Inside the playlists, we have tracks' information like the names of artists, albums and tracks and their respective URIs along with the duration of that particualr track in milliseconds.
This whole dataset was considered as the base dataset used further in feature extraction.
Audio features of the first 2000 entries of the base dataset were extracted through our own client_id and client_secret obtained through 'Spotify Account for Developers'.
Numerical features like -
1. Danceability
2. Loudness
3. Instrumentalness
4. Speechiness
5. Acousticness etc.
were retrived as part of the audio features.
Refer to features.py for the code.
The audio features extracted were merged with the base dataset on the basis of track id.
We dropped the duplicates by creating a column consisting of summation of track and album name. Another column of Genre List was created containing the list of genres of that particular track. Further, this column was used to understand the Term frequency — Inverse document frequency analysis of words in the whole dataset for observational purposes. No Nan values were found after dropping the irrelevant columns therefore no mising value imputation was done.
A final pre-processed file was generated.
Before modelling and after splitting we scaled the selected data using normalisation to shift the distribution within the new range of 0 and 1.
MaxMinScaler was used since it is least disruptive ot the original dataset and the selected columns are in float datatypes.
from sklearn.preprocessing import MinMaxScaler
mms=MinMaxScaler()
feat_scaled = mms.fit_transform(features[columns_to_cluster])
fit_transform is used to estimate the minimum and maximum observable values of the training data and eventually transforming it to use it in training our model.
9 audio features were normalised in this way and were stored in a different dataframe.
Sentiment Analysis was performed on the track name column of the pre-proceesed file to understand the tone of text and observe patterns in subjectivity and polarity.
For subjectivity, the value lies in the range of 0 to 1 where our bordering line was fixed at 1/3. The value closer to 1 indicated the particular track keywords are searched by more number of people.
Polarity is of 'float' type as well and lies in the range of -1, 1, where 1 means a high positive sentiment, and -1 means a high negative sentiment.
The dataset from sentiment analysis was converted into a dataframe using dummy variable approach of one-hot encoding. The sentiment analysis was for observational purpose only.
The final pre-processed file comprises of 1999 rows x 38 columns. This dataset contains all three data-types - object, int64 and float64.
Outliers were rejected from the int64 and float64 columns by defining the quantiles at 0.25 and 0.75 for lower and upper outliers futher having a deviation of 1.5 from the interquantile range.
Multicolinearity of features having again the datatypes of int64 aand foat64 were studied to observe the weightage of the coorealtion metrics of independent variables on each other through the Variance Inflation Factor(VIF). Features having high coorelation have a lower VIF and vice versa. However, no column was eliminated on this basis since we can have models that perfectly fit the data without the need to interpret the parameter estimates.
Kmeans algorithm is an iterative algorithm that tries to partition the dataset into Kpre-defined distinct non-overlapping subgroups (clusters) where each data point belongs to only one group. It tries to make the intra-cluster data points as similar as possible while also keeping the clusters as different (far) as possible.
The prediction of clusters were identified on the basis of the previously defined 9 audio scaled features.
Inertia values i.e. the parameter to decide how well a dataset was clustered by K-Means by calculating the sum of squared distances of audio features to their closest cluster centre were stored in a list.
Silhouette score analysis has been done to determine the number of clusters. The coefficients determine how close each point in one cluster is to points in the neighboring clusters. It ranges between -1 and 1 where -
1. near to +1 -> sample is far away from the neighboring clusters.
2. near to 0 -> the sample is on or very close to the decision boundary between two neighboring clusters.
3. near to -1 -> samples might have been assigned to the wrong cluster.
Through observation of silhouette co-eficients, the number of clusters could be either 8 or 11. K-Elbow plot between number of clusters and inertia values was graphed which highlighted that inertia(or distrotion) start decreasing in a linear fashion after k=8.
Hence model was finally trained on the 9 audio scaled fetaures getting divided into 8 different clusters and stored under the name model.pkl using joblib.
Joblib is a set of tools to provide lightweight pipelining in Python and is optimized to be fast and robust on large data sets.
Refer to model.py for the elaborated code.
We had to analyse the number of songs going in each cluster.
To do so, a cluster column was created in the audio scaled features dataframe and cluster labels returned obtained through kmeans.labels_ were stored in that column.
A merged dataset file consisting of the pre-processing file and audio scaled feature file was stored under cluster.csv present in the Data Folder
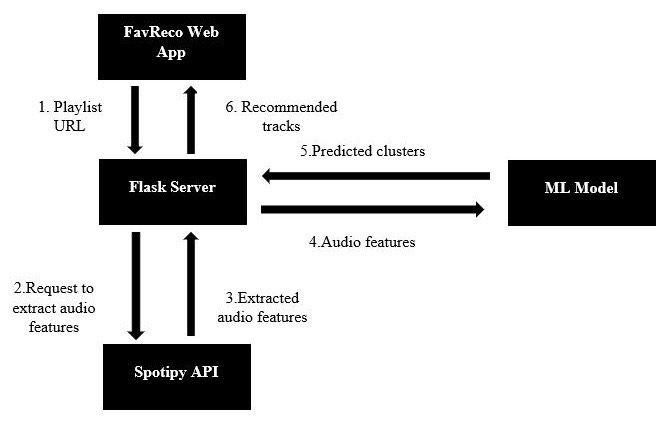
The user gives an input of playlist's URL and the number of recommendations he/she wants.
After extracting the playlist id, the tracks data was retrieved, where the track id was stored in a list along with the same 9 audio features used in training the model. The cluster value was predicted by the model.
The count of unique cluster values along with the counts of unique tracks in those clusters was stored in two different variables which were used to compute the percentage value of each cluster.
The user gets the top recommended tracks.
The percentage obtained for each cluster is multiplied with the number of track recommendation user wants.
Therefore the type of recommendation is directly dependant on the weightage(percentage value) of the cluster and the track name are appended in a seperate output list.
recommendation.py can be referred for the back-end understanding.
app.py is main driver file.
- Our web application has been built on flask and can be found here Music Recommendation System.
Flask is used for developing web applications using python and comes with in-built advantages like built-in development server and a fast debugger,lightweight, secure cookies are supported,Request dispatching using REST to name a few. The files of this part are set up in
venvfolder.