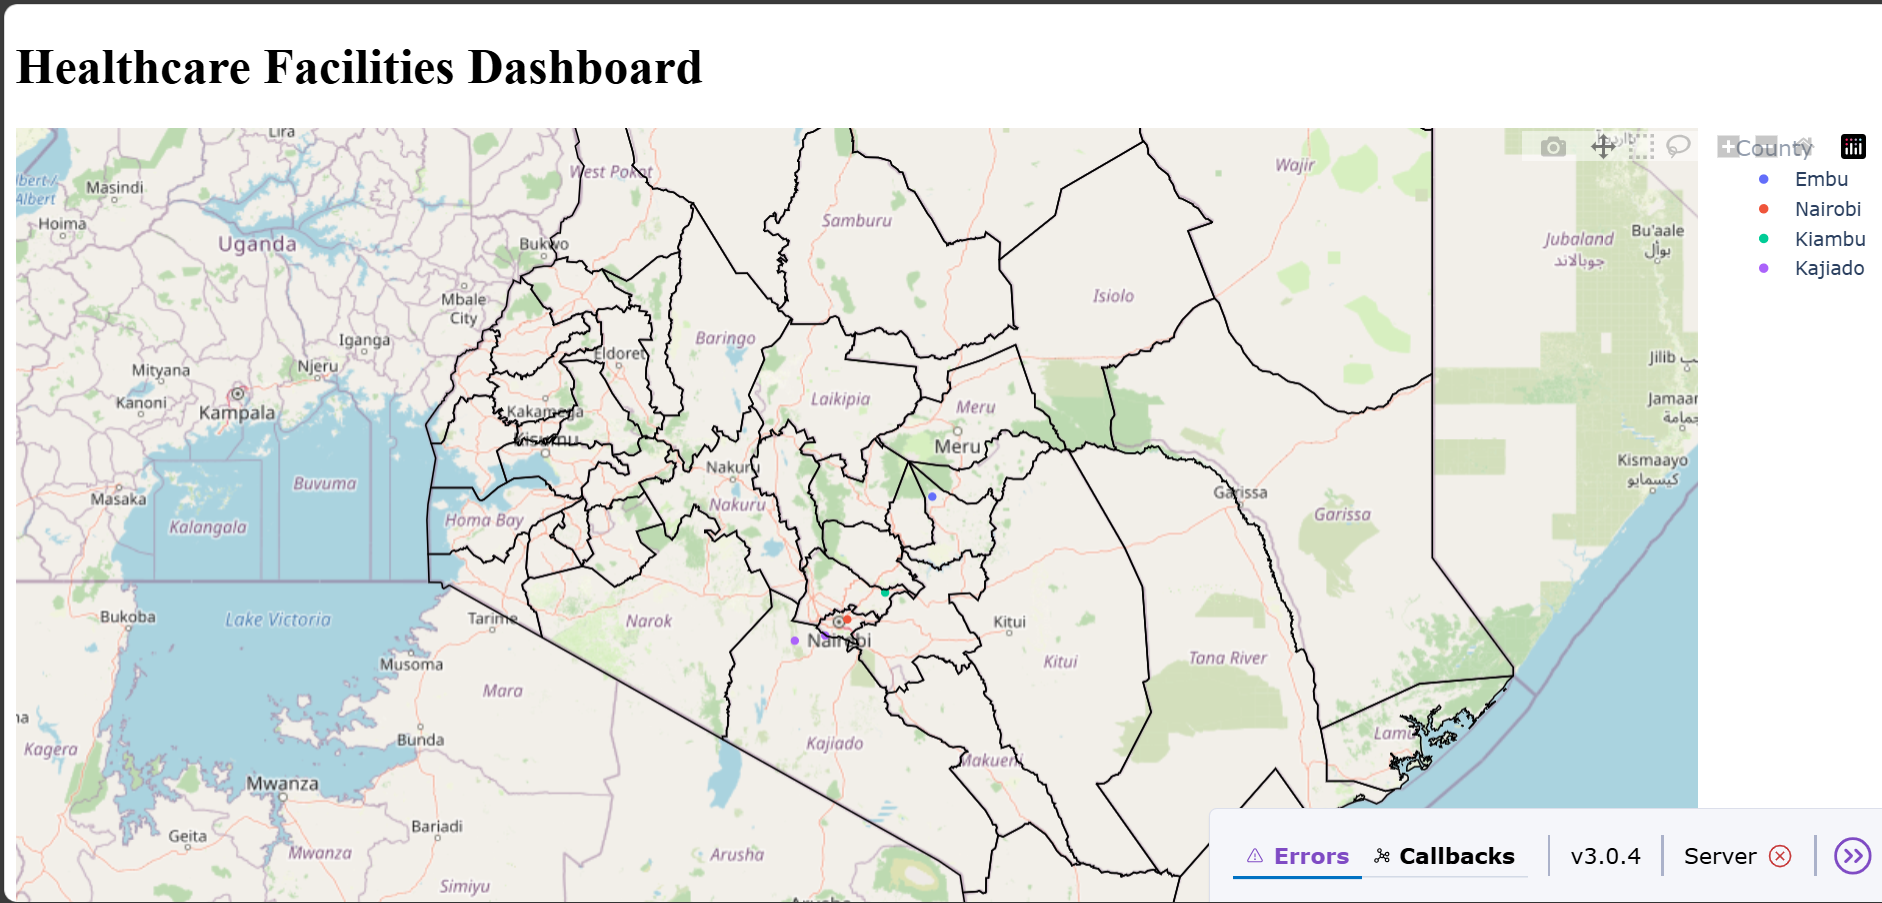
A Dash-based interactive web application that visualizes healthcare facilities in Kenya using data from the EnergyData.info CKAN API and shapefile-based county boundaries.
- 🗺️ Interactive map displaying healthcare facilities by county
- 🏥 Facility names shown on hover
- 🧭 County boundaries overlayed using a shapefile
- 🐍 Built with Python, Dash, Plotly, GeoPandas, and CKAN API
- Healthcare Facilities: EnergyData.info CKAN API
- County Boundaries: Local shapefile (
County.shpand associated files)
git clone https://github.com/your-username/healthcare-dashboard.git
cd healthcare-dashboard
Windows:
python -m venv venv
venv\Scripts\activate
macOS/Linux:
python3 -m venv venv
source venv/bin/activate
If a requirements.txt file exists:
pip install -r requirements.txt
If not, install modules manually and then generate the file:
pip install dash pandas geopandas plotly requests
pip freeze > requirements.txt
Ensure the following shapefile components are present:
County.shp

County.shx

County.dbf

County.prj
Place them inside a directory called shp in the project root:
markdown

healthcare-dashboard/
├── app.py
├── README.md
├── requirements.txt
└── shp/
    ├── County.shp
    ├── County.shx
    ├── County.dbf
    └── County.prj
In your script, reference the shapefile like this:
python
gpd.read_file('shp/County.shp')
After activating the virtual environment, run:
python app.py
Then open your browser and navigate to:
http://127.0.0.1:8050/