This project at its core is designed to help an up-and-coming playwright, Louise, to establish the best solution for crowdfunding her play: "Fever". She had already done her own budget calculations, but arrived at a number over $10,000, which is a daunting proposition in of itself. To help Louise have a successful campaign and find the right number for her budget, a dataset of a variety of media types that were crowdfunded was used. This was then organized, sorted and analyzed to help find the most successful campaign path for her and her play as the project grew from just a budget concern.
To begin, I organized the data so that later filtering, formatting, etc. would make analysis easier. Once that had been done the data was then separated out into further fine points that would later assist in giving Louise the best information to make an educated decision. This then culminated into the last two points of analysis that were done.
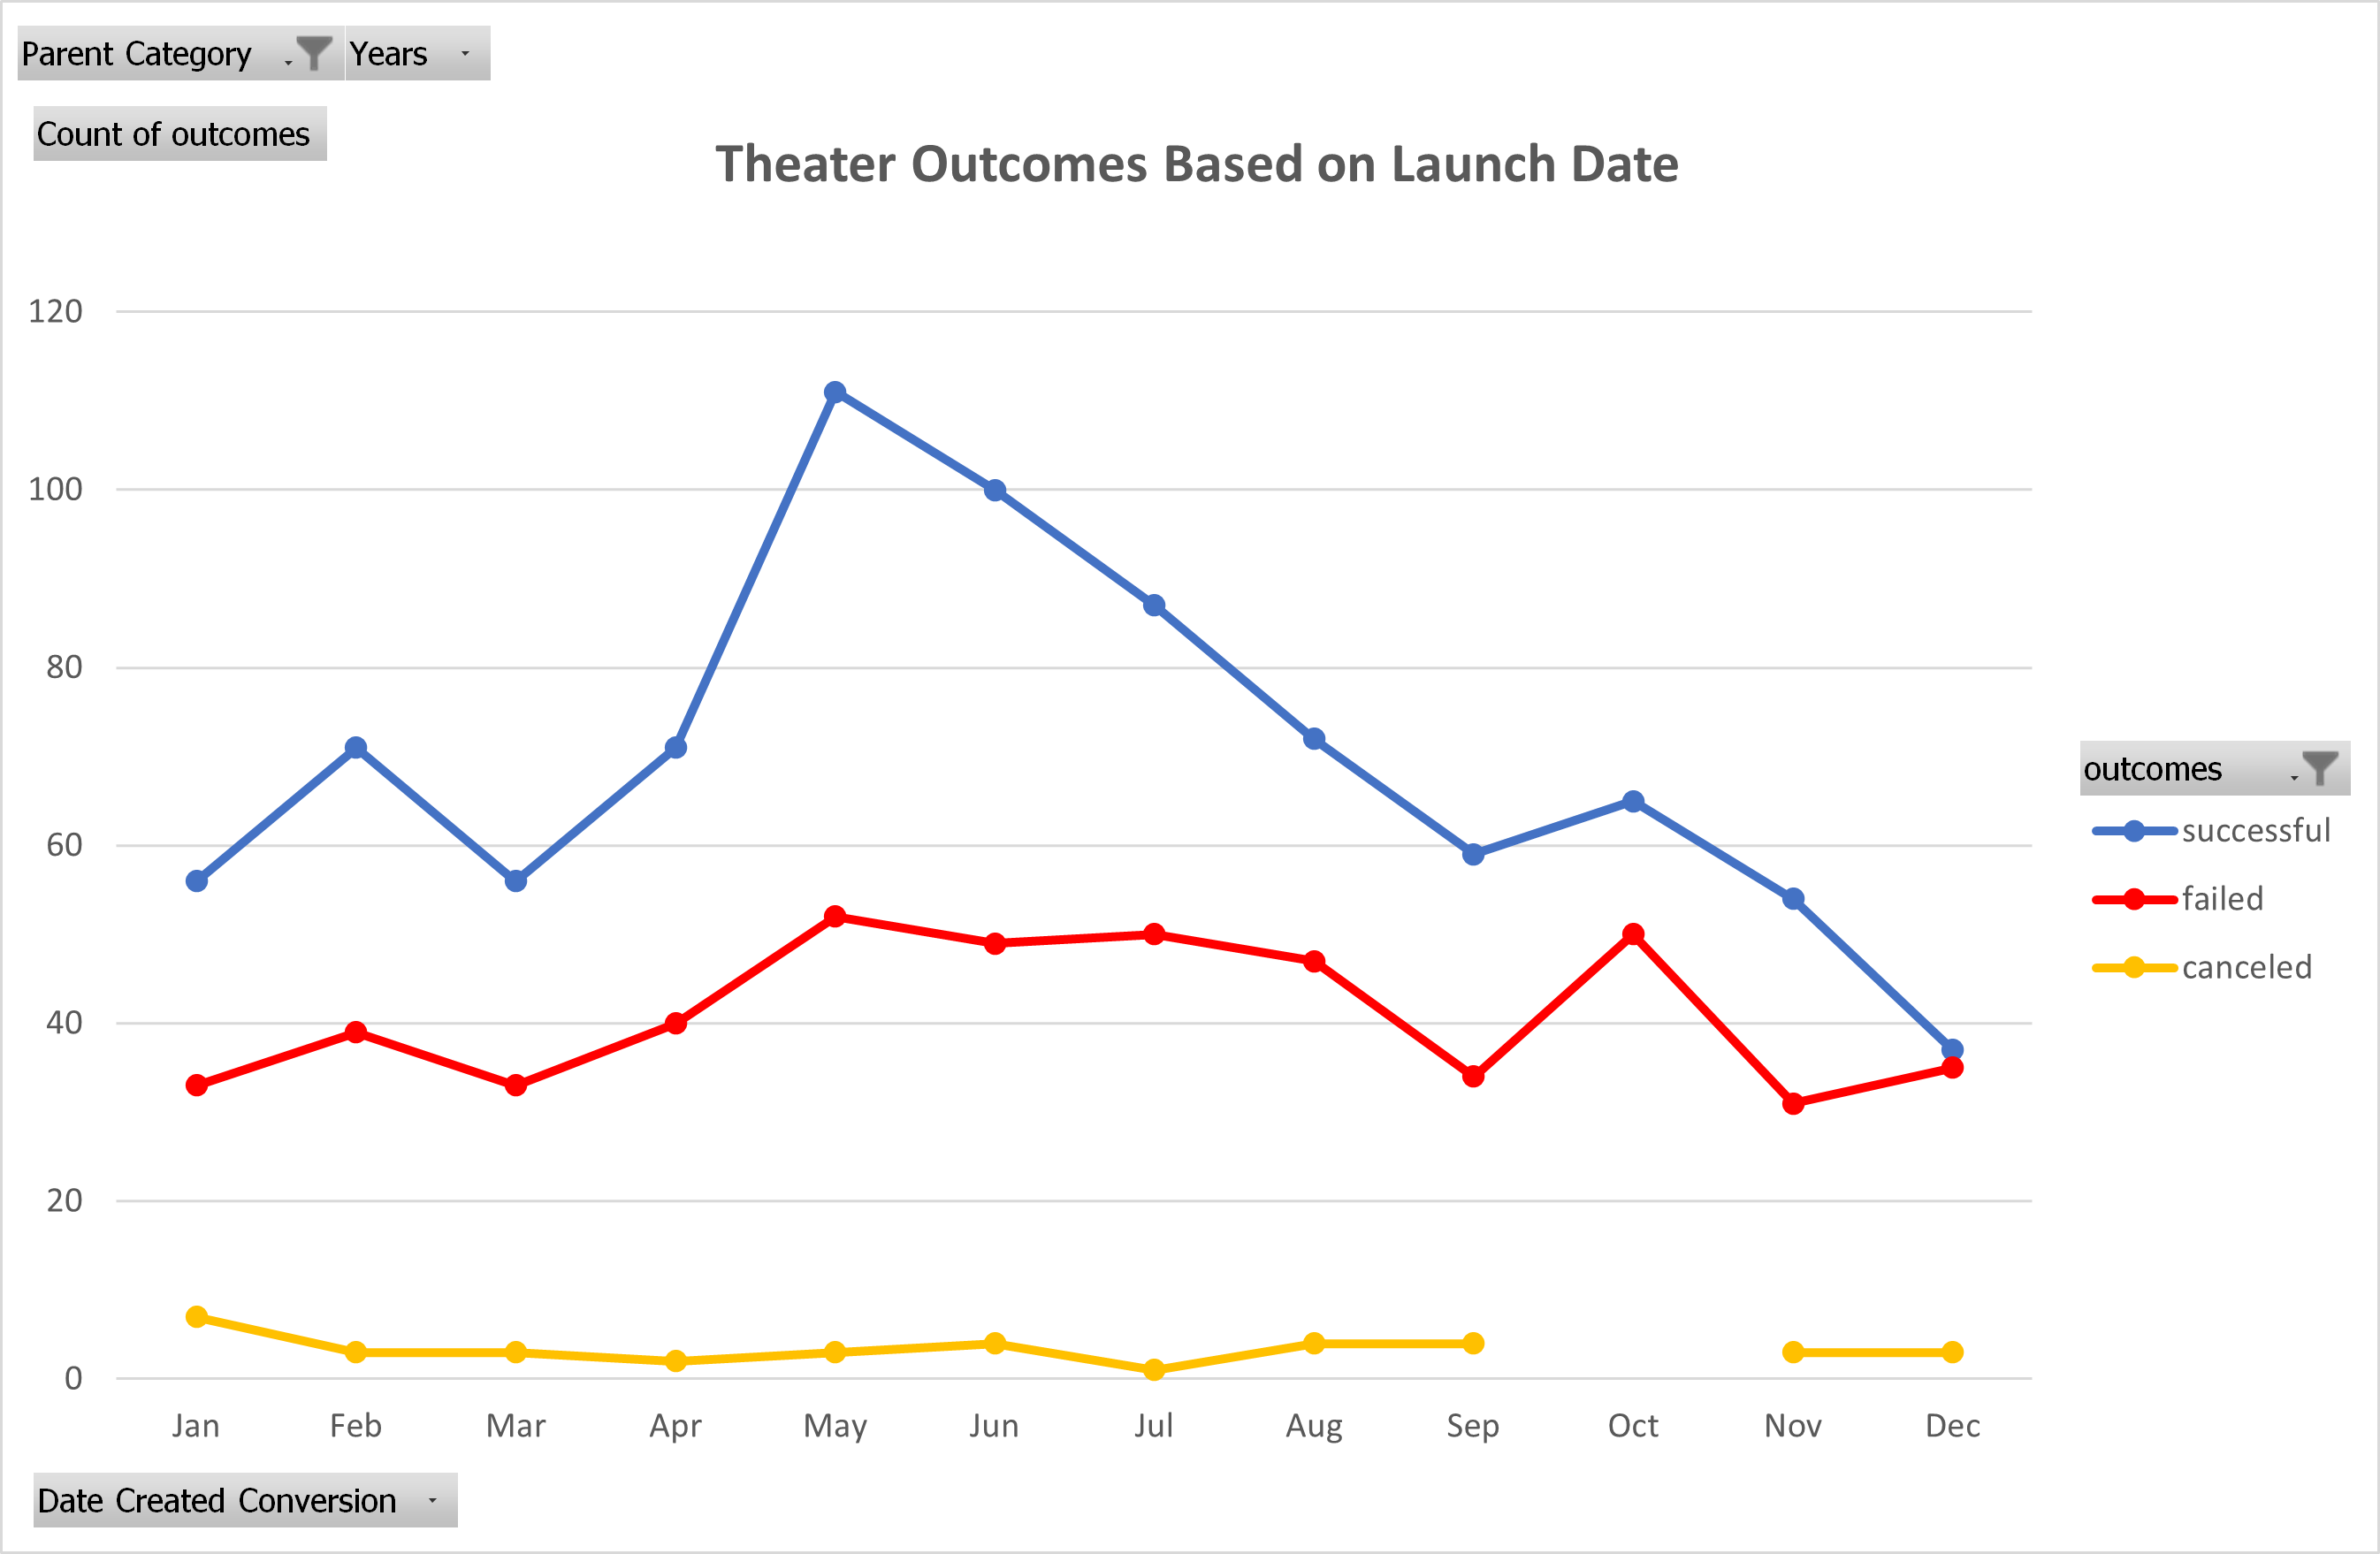
The first graph is a visualization of how other theater outcomes fared in any given month on their launch date. The PivotTable, and subsequently the Pivot graph, helped consolidate the parameters of the outcomes, months and launch date. Furthermore, the percentage of successes, cancellations, and failures, were combined, filtered and counted with the previous data to make a PivotTable. This spelled out data was then translated into a graph to show which periods of time were more prone to success than others.
The most challenging part of this Deliverable was the fourth requirement. No hand holding here! But, as our instructor suggested during the class that went over PivotTables, “Experiment with the fields, mess around with it”. Not a direct quote, but honestly it helped since I did just that, and realized honestly pretty quickly what I wasn’t doing to complete the table. Definitely a Eureka moment, since I had previously been banging my head on this for half a day. Looking back, it seems so simple, but before it was so daunting.
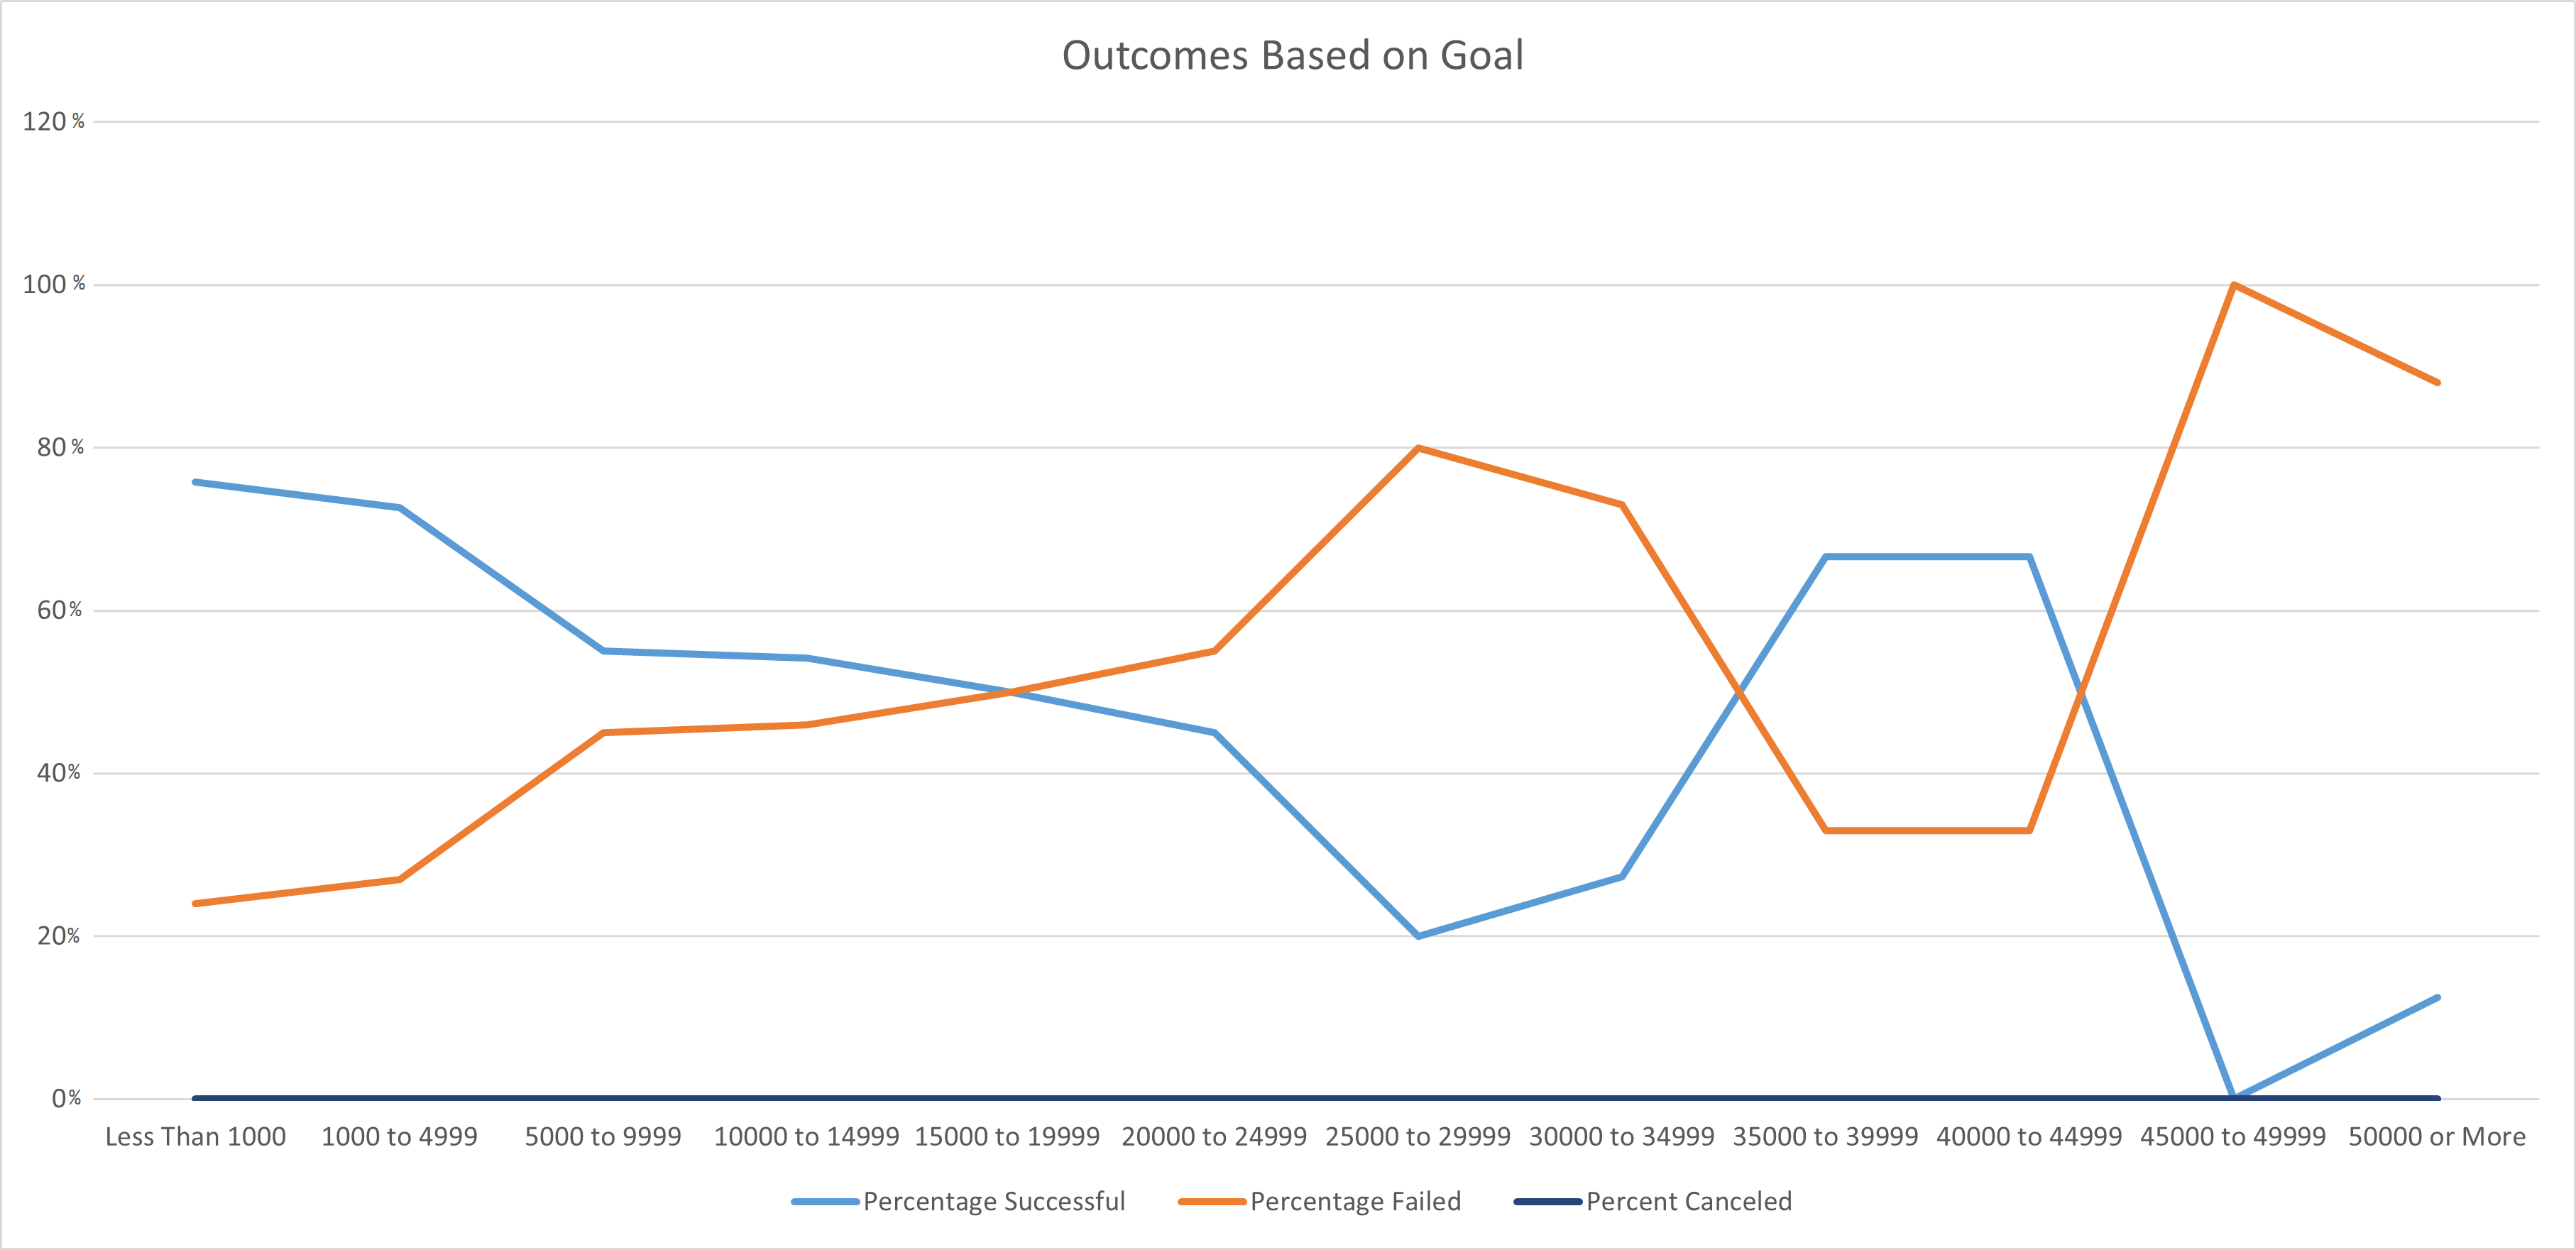
The purpose of this second analysis was to see the success, failure, and canceled rates of plays and how those factors correlated with how much the funding goal was. The first thing done was establish parameters for the goal amounts. This was then cross referenced with the outcomes of each play in the dataset. The result was enumerated out and then set to percentages to fulfill a necessary parameter for the coming graph. The graph itself had the goal amounts set to the x axis, and the y axis devoted to the percentage amount of the success, failure, and cancelation. This allowed for an examination of the results associated with how much the budget for each play was.
For this Deliverable, the real challenge came in the form of the COUNTIFS() functions, but once I had wrapped my head around it, again looking back it makes so much sense but not when I first started. It probably doesn’t help that this is really my first actual foray into Excel itself. It has been my knowledge of how the ribbon works (from Word), previous encounters with functions and arguments, and building tables in HTML that really got me through this one. What hung me up was really how it fit together and what order things could go in, which come to find out it doesn’t care. As long as the criteria range and criteria itself are together then you’re golden. Also, I thought I was losing it on the Percentage Canceled and that I had really goofed up. But I did several manual filters on the dataset, and realized that within the parameters set it was correct.
The two conclusions I can come to for the “Theater Outcomes by Launch Date” is that:
- The beginning of May seems to be a prime time of the year for theater in general.
- That across the board the successes stayed above the failed, and especially the cancelled, which shows there is a strong market for theater.
The conclusion for “Outcomes based on Goals” is that successful goals either have a shoestring to low end budget or a relatively high budget in the 40,000s, which then crashes just short of the highest goals. Concluding that there really isn’t a middle ground but rather it is an either-or extreme.
Honestly, I find this one very hard to answer. I blame it on how new I am to this level of Excel. It already seems like an incredible amount of data that can be tweaked to answer a lot of questions. But, no doubt at the end of this course I’ll look back and laugh at this statement.
Speaking of answers to questions, it would be interesting to see which years had the most successes and failures, and also if there were years with more outcomes than others. The Percentage Funded data would also be interesting to see how it relates to each country, and with which categories have the most and least funding.