Music forecasting is a highly discussed topic within the music industry, as identifying the formula for "success" can give artists and producers a commercial advantage regarding investment opportunities. Despite its importance, it remains as an obstacle in the music industry due to the inherently contextual nature of song popularity.
This report intended to provide additional perspectives to this field of knowledge, through examination of quantitative data present in all audio tracks. Additionally, the report aimed to define what musical features are associated with popular songs and genres. The specific research questions were listed as follows:
- Which musical feature most impacts a song’s popularity?
- What features distinguish high – and low –popularity genres?
- Can genre popularity be predicted?
The dataset was sourced from the Maharshipandya Dataset.
The dataset contains 114,000 tracks with distinct musical features spanning across 114 genres, with each track containing unique numerical features with ranging scales and values.
The report was carried out using R programming language Version 4.4.1 (2024-06-14 ucrt) and software RStudio Desktop for winOS version 2024.12.0+467. Besides the base R packages, the following packages were also used:
tidyversecarcorrplotRColorBrewertreemapifyggalt
The dataset and code generated composite visualisations depicting the predictive power of models employed throughout analysis. These were visualised to provide a detailed view of musical features and their relationships to popularity across genres:
-
Univariate popularity ~ feature analysis: Presented relationships between popularity across genres, and their musical features.
-
Multivariate popularity ~ features analysis: Displayed genre - feature associations to evaluate differences between high/low popularity genres.
Before running the code, ensure the following software is installed:
- R(Version 4.0 or later)
- RStudio (Integrated Development Environment, IDE)
- Git (to clone the repository)
Download the project files by cloning the repository. This can be performed by running the following command in your IDE:
git clone https://github.com/G-Imola/Popularity-Feature-Analysis.git
After cloning, verify that the active Git branch is set to main.
To check the branch, run the following command:
git branch
You've done this correctly if the output shows *main.
If the branch is not set to main, you can switch to the main branch by following these steps:
#enter the terminal on your selected IDE and input the command below:

cd Popularity-Feature-Analysis


#Following this, type the code below:

git checkout main


#Finally, test to verify "main" branch has been selected:

git branch
This ensures that you're working on the correct branch for the project.
After following the steps above, your IDE should display the repository, alongside all other data that comes with it!
Ensure that the Original Dataset is downloaded and placed in the root directory of the cloned repository.
Open R file.R (link) in Rstudio, or your preferred IDE, and run the script sequentially to generate:
- Descriptive box plots
- Correlation plots
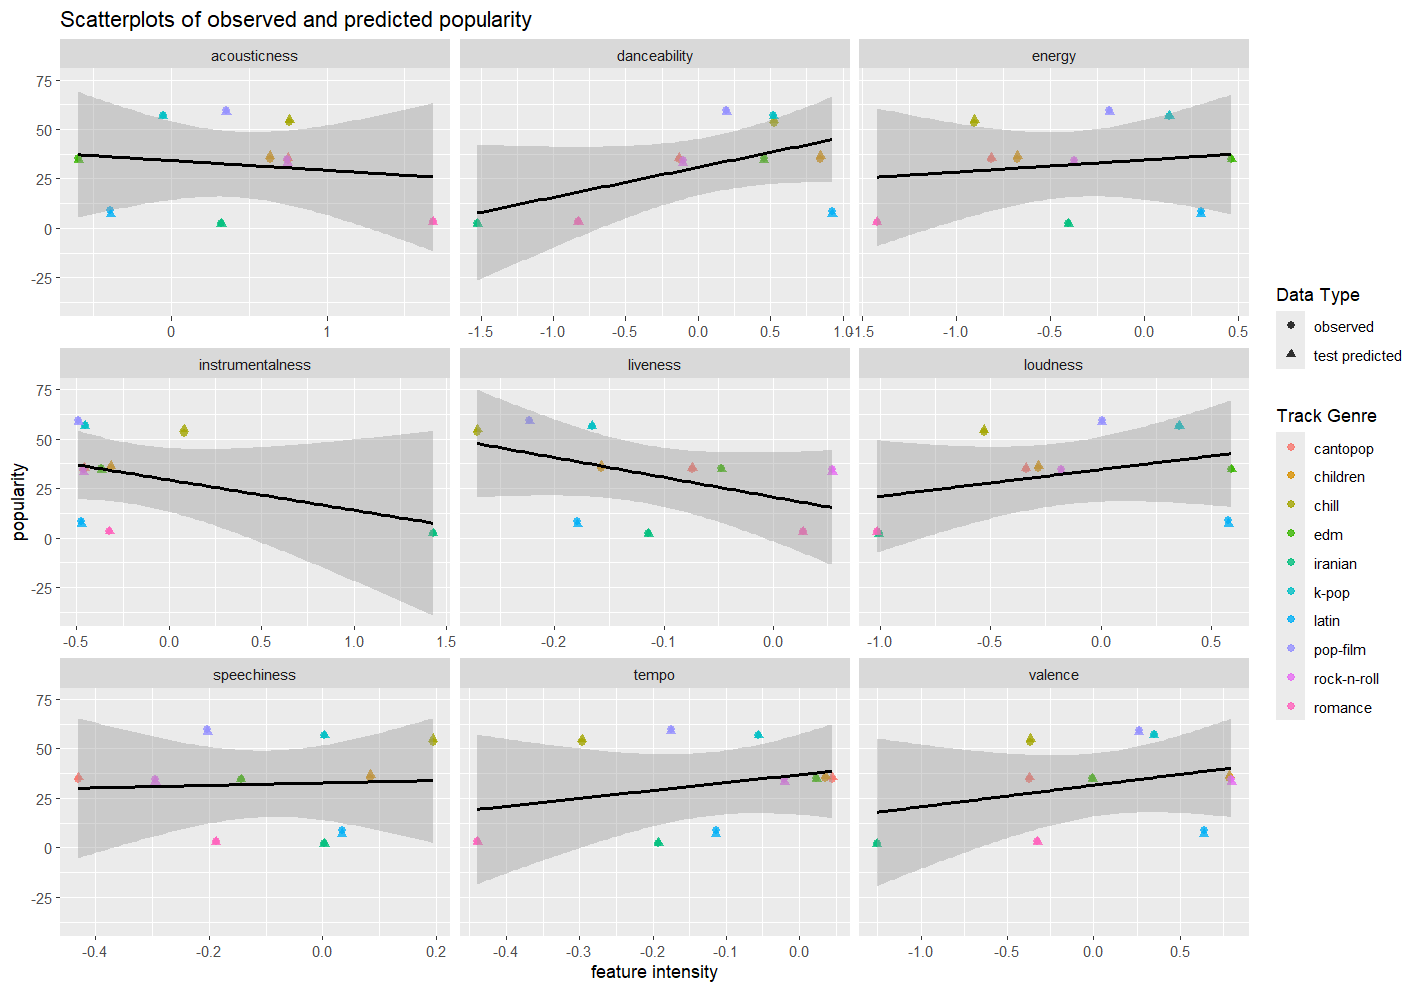
- Composite scatter-plots of models
- Additional descriptive plots
Generated visualisations are all stored in the plots directory.
The outputs include:
Faceted univariate plot.pngFaceted MVR plot.pngPopularity-genre Box plot.pngCorrplot full data(grouped).pngCorrplot full data(ungrouped).png
Additionally, generated .csv files are stored in the csv ouputs folder, which contain various outputs from the dataset, including:
MVR test residuals.csvFull MVR Model output.csvvif scores for training data.csvTest-dataset predicted Avg.csv- and more!
-
Primary predictors of popularity:
-
High popularity tracks presented high danceability, loudness, low instrumentalness and liveness.
- Suggests high popularity tracks are highly loud danceable tracks with little instruments and studio-produced.
-
low popularity tracks presented high accousticness, and low significant values for valence,
- Suggests low popularity songs are primarily acoustic, slower songs with less rhythm and tempo.
-
-
Linear modelling provides high predictive precision, however displays low explanatory power (R^2 = 7%).
- This suggests that popularity is primarily determined through non non-musical drivers, i.e marketing and trends.
-
Genre, as a category, masks features present when displayed amongst aggregated data
- This implies that smaller samples with less genres allow for greater predictability, but poses the risk of skewed/biased data.
This project is licensed under CC BY 4.0
See license file for more details.
For queries or further information, please contact:
Name: Gianmarco Imola Email: gian.imola2003@gmail.com GitHub: https://github.com/G-Imola