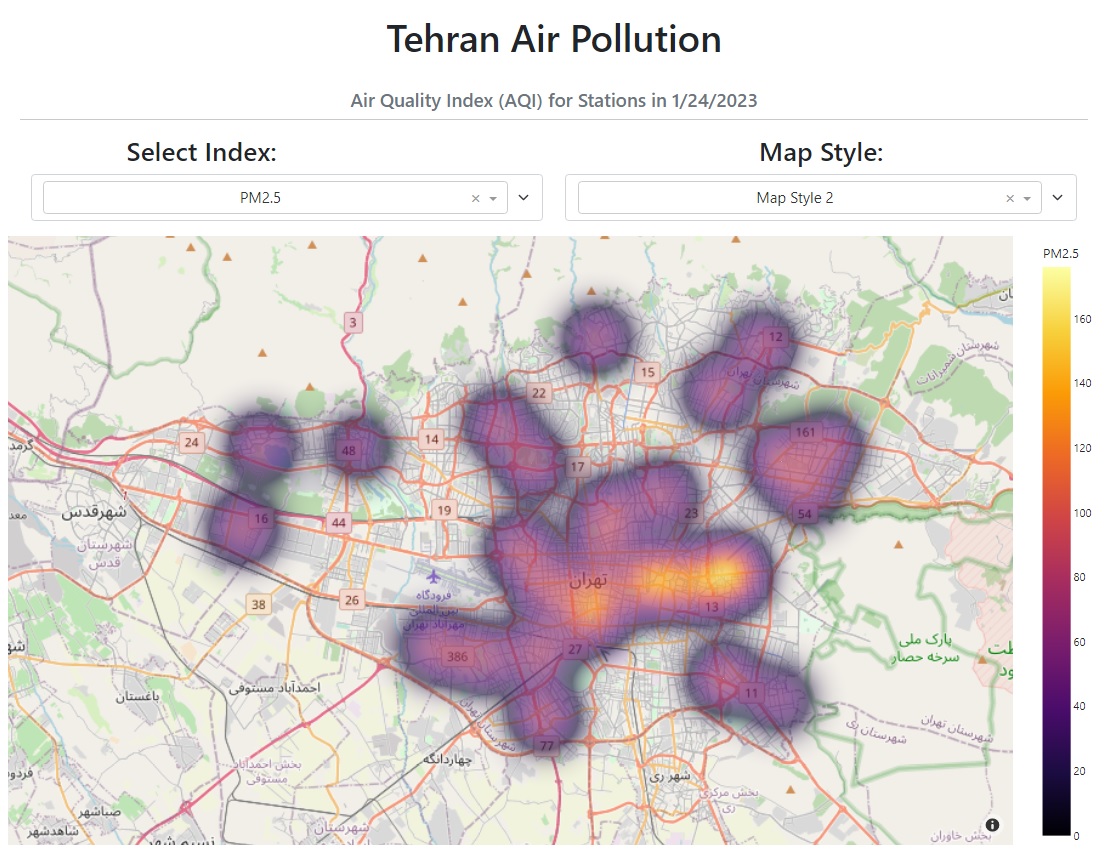
Air Quality Index (AQI) for Stations in 1/24/2023
𝘱𝘺𝘵𝘩𝘰𝘯 𝘱𝘭𝘰𝘵𝘭𝘺 𝘥𝘢𝘴𝘩
During the IBM course - Visualizing Data with Python and learning about Dash and learning the following topics:
- Creating Maps and Visualizing Geospatial Data
- Creating Dashboards with Plotly and Dash
I decided to implement a personal project as more practice and learning. Considering the dire weather conditions of the great city of Tehran, and being interested in the issue of implementing various types of maps, I chose the issue of Tehran's air quality index!
-
Approximately 35 important points of Tehran
-
by 6 important air quality indicators (CO/O3/NO2/SO2/PM10/PM2.5)
-
Display information in maps in 5 different types and a table
- Practicing Python coding, learning Dash and plotly, implementing map types and connecting to data, learning callbacks, implementing dash_table and other things...
- Undoubtedly, this project has many problems and needs to be improved. I would be happy if you are also interested, we can have a good cooperation to get better.
Learning continues ♥
www.linkedin.com/in/farid-moghadam


