Anomaly Validation
False positives are a major challenge for most monitoring systems. They force users to spend time validating individual alerts, which is too much work. This leads to missed alerts and a less useful monitoring system.
One important strategy for dealing with false positives is to use accurate anomaly detection models. The time series models should be accurate, and the mapping of outlier scores to outlier classifications should also be accurate. This is the domain of the Anomaly Detection module.
Unfortunately this isn't enough to solve the problem. In most real-life time series, there's overlap between noise and anomalies. In other words, sometimes noise generates data points with larger outlier scores than those associated with smaller anomalies.

(Adapted from a figure in Outlier Analysis by Charu C. Aggarwal (Springer).)
To address the "irreducible" component of prediction error, Adaptive Alerting includes the Anomaly Validation module. The idea here is to look for evidence beyond the outlier score that would either confirm or disconfirm a purported anomaly.
The investigatory process takes a little more time to perform, but that's why we split the Anomaly Engine into an Anomaly Detection phase and an Anomaly Validation phase. The Anomaly Detection phase quickly identifies candidate anomalies, but generates more false positives than we'd like to see, due to irreducible error. The Anomaly Validation phase is slower, but we run it only on the small subset of metric points that the Anomaly Detector classifies as anomalies.
We'll begin by looking at the flow, and then we'll look at the underlying module architecture.
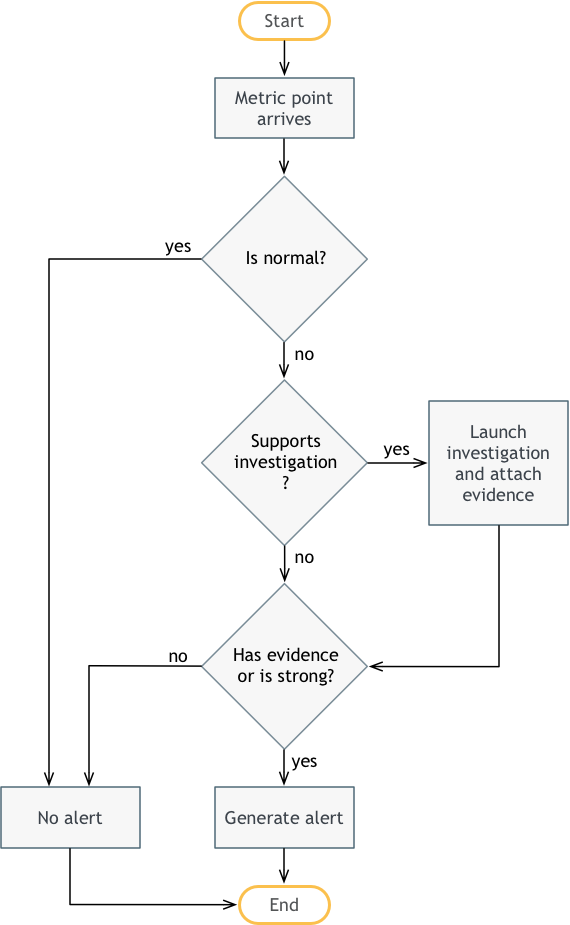
Here's what's happening:
- First, a classified metric point arrives into the Anomaly Validation module from the Anomaly Detection module. The classification is either normal, weak anomaly or strong anomaly.
- If the metric point is normal, then we end without generating an alert.
- Otherwise, we check to see whether the anomaly has an associated investigation process. An investigation process is just a set of additional queries we can perform to confirm that the anomaly is "real" and not just noise. This could be queries against Splunk, ServiceNow or whatever other backend systems might be available to help validate the anomaly. Usually investigations are associated with higher-level business or application metrics (e.g., bookings drops, application KPIs) and not lower-level system metrics.
- If investigations are defined for the anomaly, then we launch those, and attach any evidence we find to the anomaly.
- Whether or not there was an investigation, now we have to decide whether to generate an alert. If the investigation turned up evidence, or if the anomaly is strong, then we generate an alert. Otherwise, we end without an alert.
That's the process. Now let's look at the underlying architecture.

The pre-filter drops any metric points we can immediately exclude from consideration. For example, we know we don't want to generate alerts for normal data points, so we just drop the normal data points here.
After the pre-filter, we enter the investigation stage. The point is to find corroborating evidence for generating an alert. This evidence is generally a search for possible causes, such as application errors that would explain a bookings drop. But the evidence could also be a search for correlated effects as well. For instance, if we see a hotel bookings drop, we might notice that there's a concurrent flight bookings drop as well as a cars bookings drop (Expedia examples). If we see all these things at the same time, then chances are that the hotel bookings drop is "real", even if we don't know what caused it.
The entry point into the investigation stage is the Investigator Selector. The Investigator Selector finds any investigators associated with the metric in question. Not all metrics have associated investigators. In general the higher-level business or application metrics are more likely to have investigators than lower-level system metrics. At any rate, the selector finds any mapped investigators.
If the metric has one or more investigators, then the Investigator Launcher launches them in parallel. The investigators must return their results within a short time period. This is configurable, with 30 seconds being a typical time limit. The Investigation Launcher merges all of the resulting evidence (if any) and places it on the anomaly.
Investigator Managers help group sets of related investigators. "Related" here generally means investigators that query the same given source system. For example there might be an Investigator Manager for Splunk investigators, and another Investigator Manager for ServiceNow investigators.
Investigators do the actual querying. There can be any number of different types of investigators--it just depends on what sources of evidence exist in your environment. At Expedia, for example, we have a lot of log data in Splunk, and we have a lot of change data (software releases, A/B tests, network routing changes, etc.) in ServiceNow. Correspondingly we have investigators that know how to query these systems to find out which apps are generating event spikes, which recent change have occurred and so forth.
The post-filter does a final filtering pass before generating an alert. The filtering behavior here and in the pre-filter will eventually be configurable, but for now, the post-filter generates an alert if and only if either (1) an investigation generated at least one piece of evidence for the anomaly or (2) the anomaly is a strong anomaly. In other words, we drop weak anomalies for which there is no supporting evidence.