RRG-Lite is a Python CLI tool for displaying Relative Rotation graph (RRG) charts.
Supports Python >= 3.8
I have added a new feature branch feat/sma_rs_crossover which uses the RS crossover of 10 and 30 SMA as the base. I found the earlier calculation was too volatile and unreliable. I am still tweaking the code but I'm happy with the result so far.
Once complete, I will set this as default and update the main branch with an config option to switch to the old calculation.
If you wish to try it out, clone the repo as usual and run the below code. This is create the feature branch locally so you can experiment and run it.
git checkout -b feat/sma_rs_crossover origin/feat/sma_rs_crossover
Perform the rest of the setup as usual. (see below for install and setup)
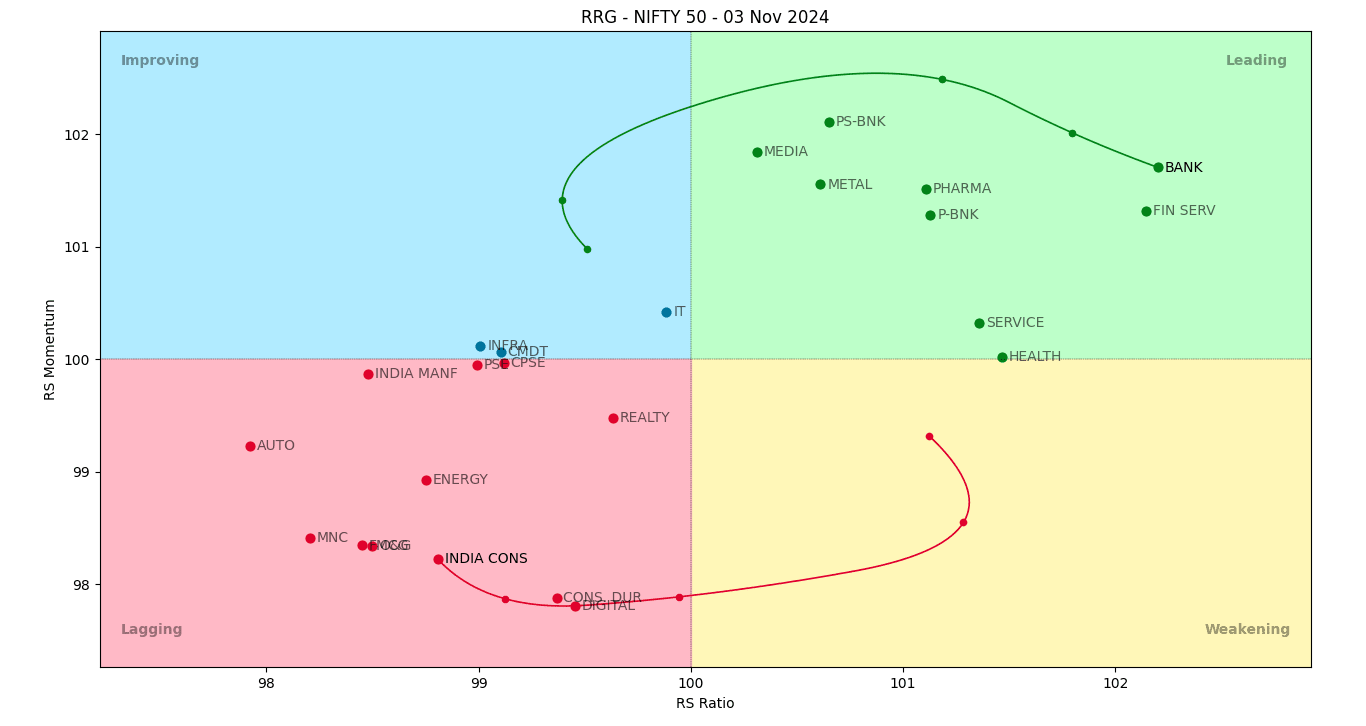
An RRG (Relative Rotation Graph) chart is used to analyze the relative strength and momentum of multiple stocks or sectors compared to a benchmark (usually a market index like the S&P 500 or Nifty 50).
It provides a bird's-eye view of how various stocks or sectors are performing relative to the benchmark over time.
RRG charts can help identify which stocks or sectors are outperforming or underperforming the index.
They are useful for asset allocation decisions and for identifying both momentum stocks and potential bottom-fishing opportunities.
Read more about RRG - Investopedia.com
Unlike traditional RRG charts,
- Tickers are shown without tail lines or labels for a cleaner look. (See Chart controls)
- Mouse and keyboard controls enhance the user experience and aid in detailed analysis.
By default,
- The timeframe is weekly and 14 week average is used for calculations.
- The RS momentum is calculated by comparing the current value to its value from 52 weeks ago.
- See wiki for explanation of RS ratio and Momentum calculations
This project was inspired and made possible due to the work of An0n1mity/RRGPy.
If you liked this project, please 🌟 the repos to encourage more inspirational works. ❤️
git clone https://github.com/BennyThadikaran/RRG-Lite.git
pip install -r requirements.txt
Optional: To enable curved tail lines, install scipy.
pip install scipy
- If tail count is less than 3, it defaults to straight lines.
To get started, you need a folder containing OHLC data (Daily timeframe or higher) in CSV format.
Folder must contain:
- Atleast one Benchmark index file.
- One or more stock / etf / sector files.
Create a user.json file in src/ as below
{
  "DATA_PATH": "full/path/to/data/folder/"
}
DATA_PATH must be a folder path, where OHLC data is stored. Above is the minumum configuration required to get started.
See additional configuration options
If you need data on Indian Stocks (NSE), you can try EOD2 and follow install instructions here to setup EOD2.
Once EOD2 is setup, follow the setup instructions, and set DATA_PATH to the full path to EOD2 daily folder located in src/eod2_data/daily/.
You can download my sectors watchlist file that works with EOD2 - sectors.csv
Pass a benchmark index using -b and a list of symbol names using --sym.
py init.py -b "nifty bank" --sym csbbank rblbank
Note: In the above example, it will look for files named nifty bank.csv, csbbank.csv, and rblbank.csv in the DATA_PATH folder
Pass a watchlist file using -f option
py init.py -b 'nifty 50' -f sectors.csv
Note: See details on setting up a watchlist
To display help, use the -h option.
py init.py -h
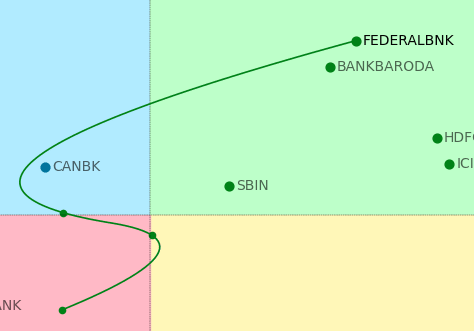
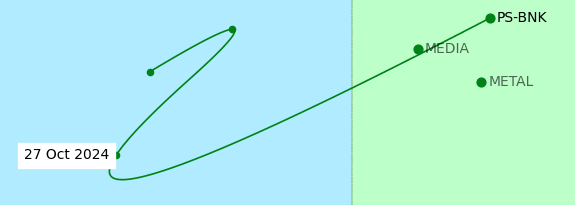
Left Mouse click on any point (marker) to display/highlight the tail line and label.
When a line is highlighted:
- Press
Left arroworRight arrowkeys to cycle through each marker on the line, diplaying a date label. (see image below) - Press
deleteto remove all highlighted lines.
Press h to toggle help text (Keybindings) in the chart.
Press a to toggle displaying ticker labels (Annotations)
Press t to toggle tail lines for all tickers.
Press q to quit the chart.
To reset the chart, press r
To use the zoom to rectangle tool - Press o (useful when lots of symbols on the chart.)
Matplotlib provides useful window controls like zooming and panning. Read the links below on how to use the various tools.