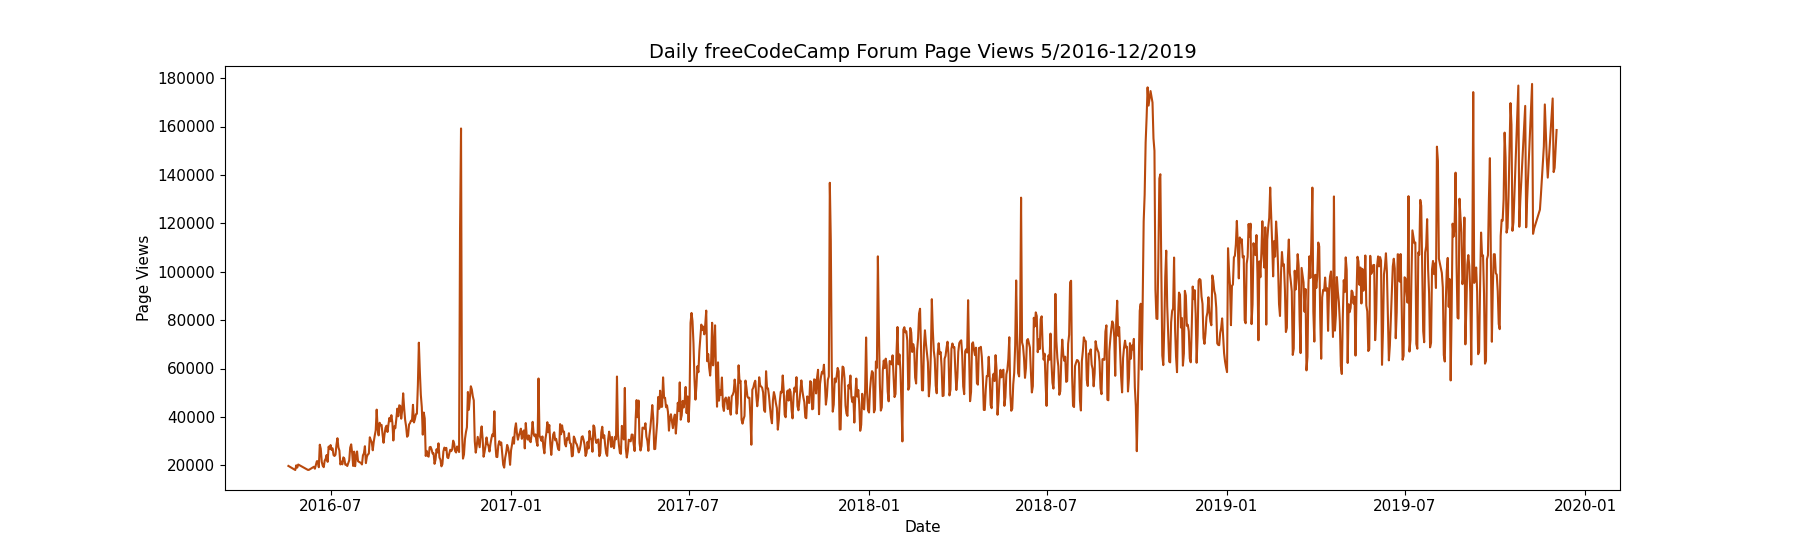
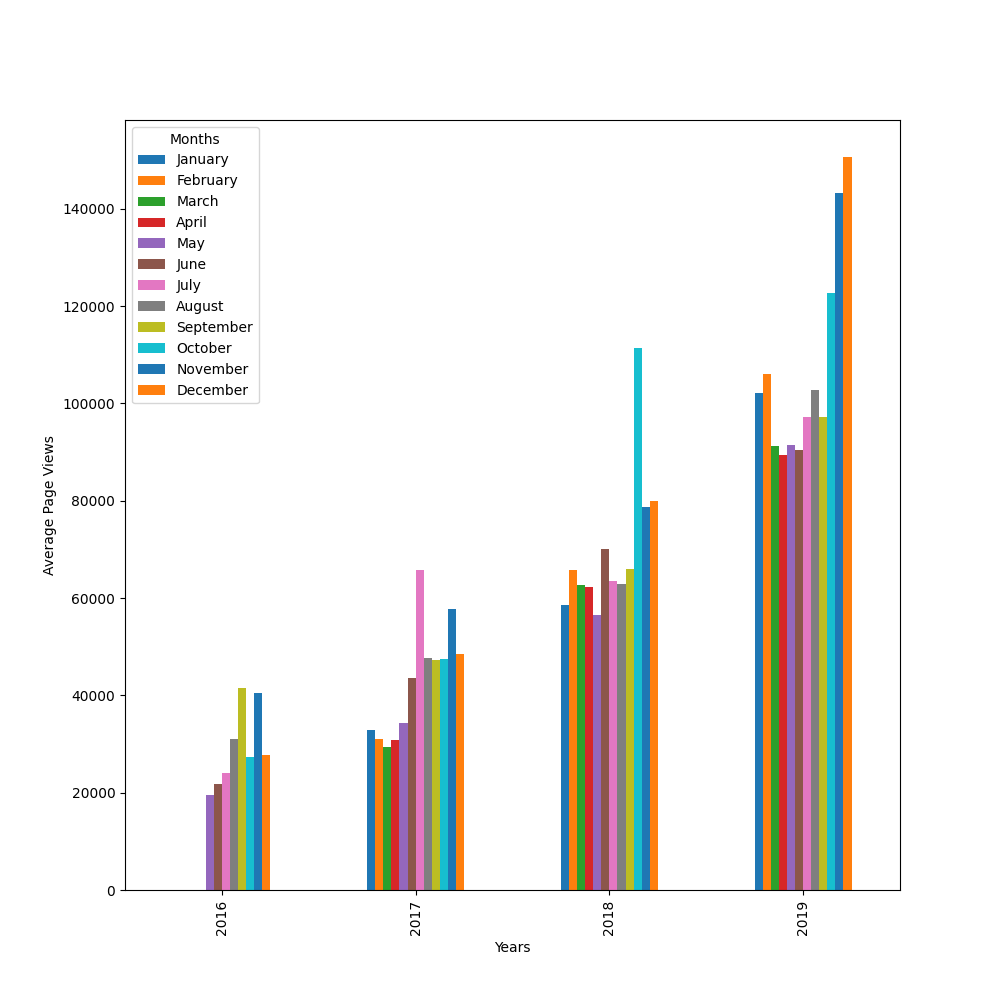
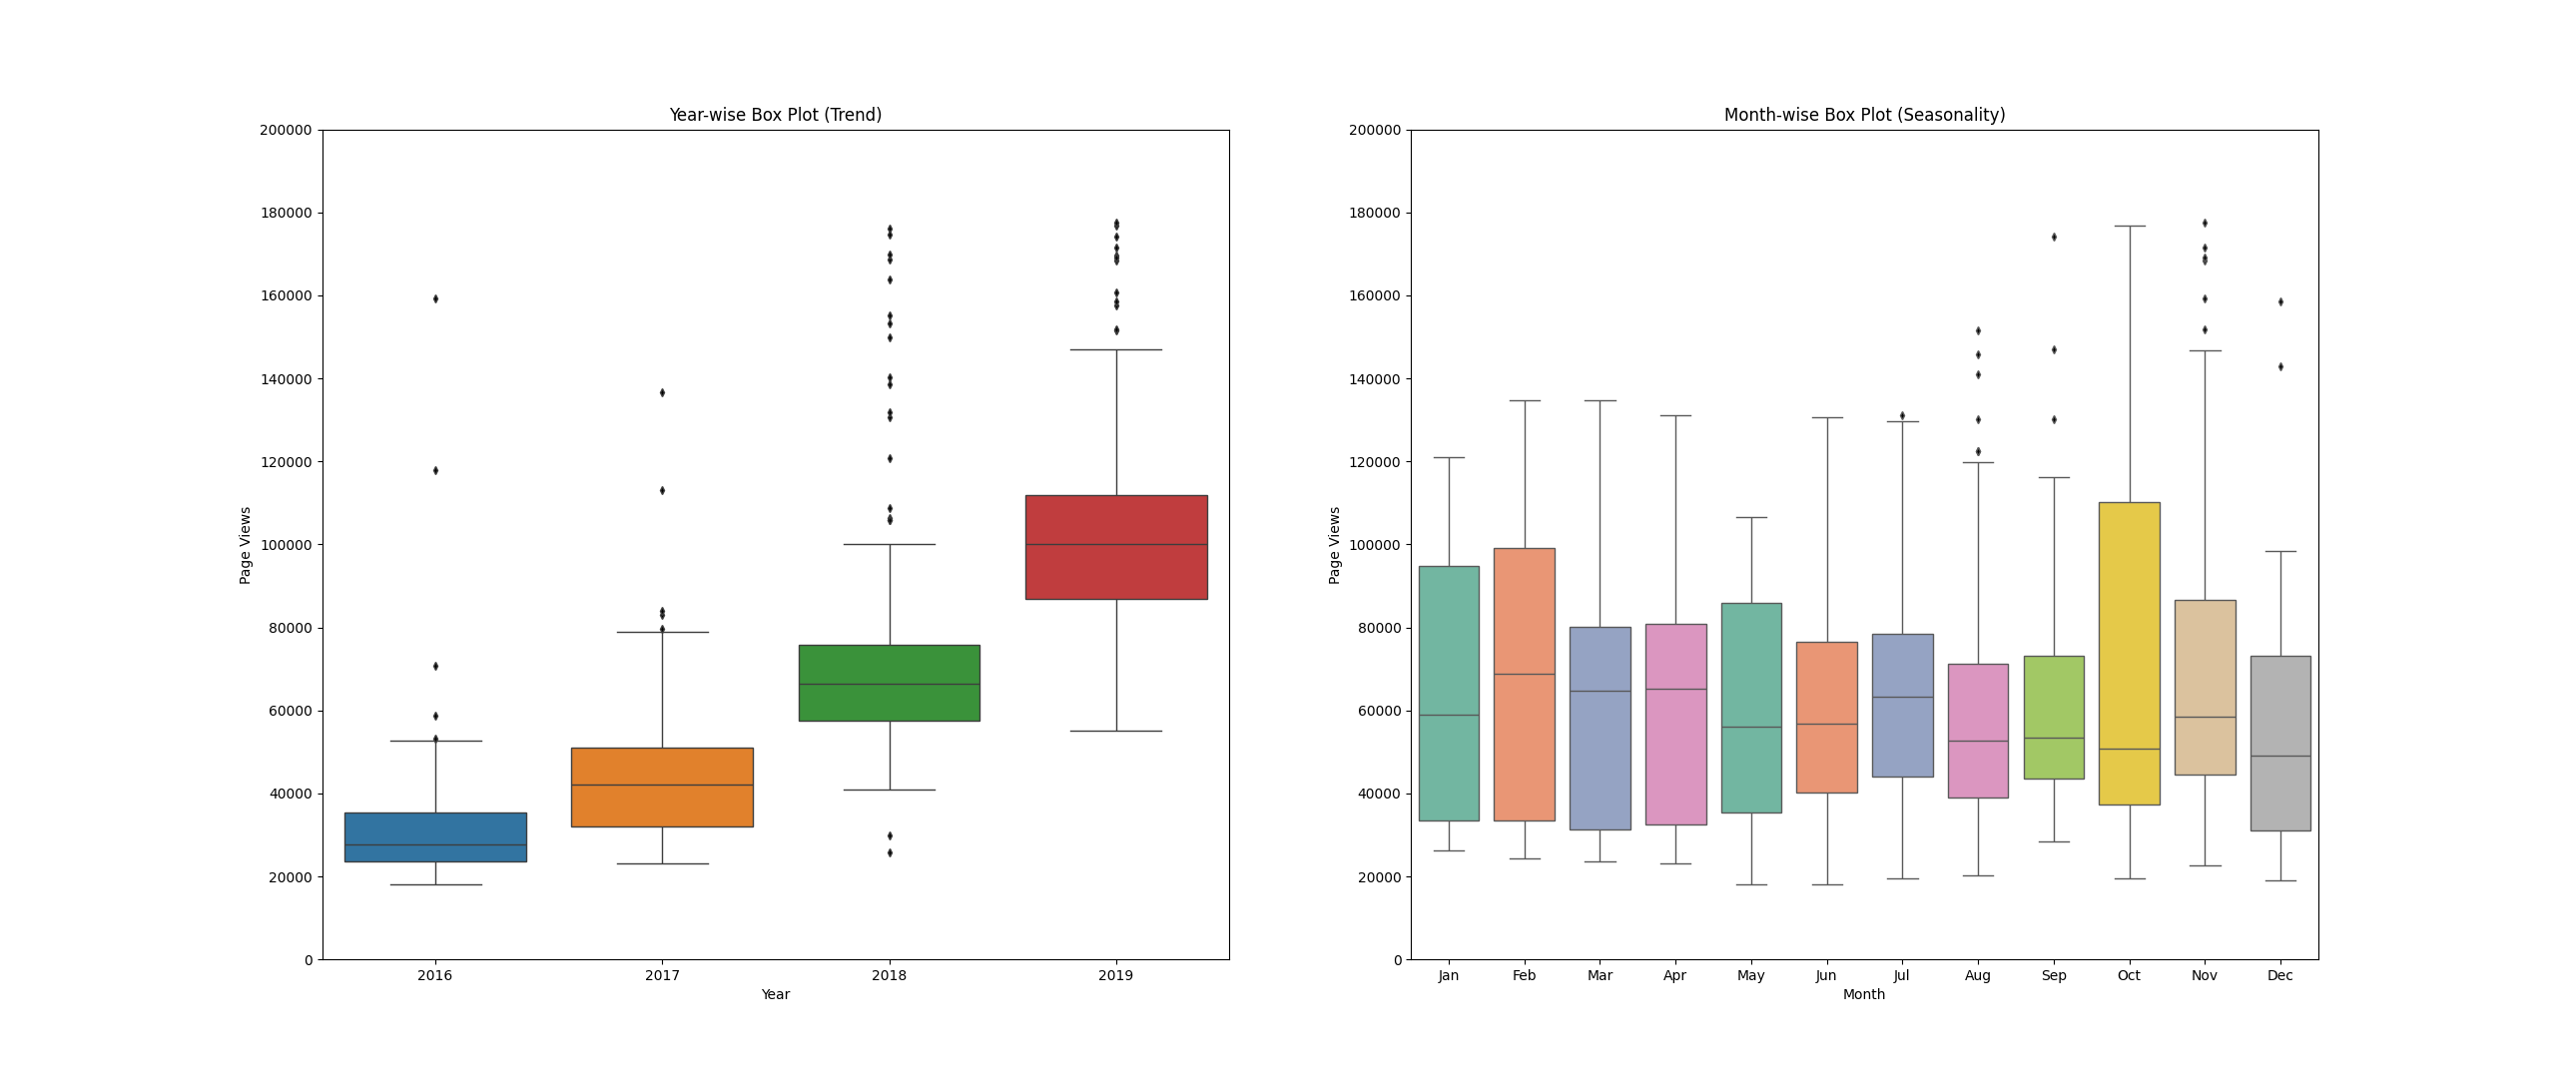
In this project I used pandas to read and work with data from a .csv file containing the number of page views each day on the freeCodeCamp forum from 2016-05-09 to 2019-12-03. Also, I used matplotlib and seaborn to make data visualizations and to see patterns on monthly and yearly scale in the page views. Below you can view the charts I built after the cleaning data process:
For more details about the project I invite you to read them on freeCodeCamp