Organizational departments - project is written in vue 2, vue-cli, and vuex. Materialize.css library
The language of the application is Polish
(Only for laptops and desktop computers (display size 13 and more). Not work on Internet Explorer and older versions of browsers)
The program is working with the xlsx file. The file must have the recommended format (an example can be downloaded here https://departments-1c007.web.app/import)
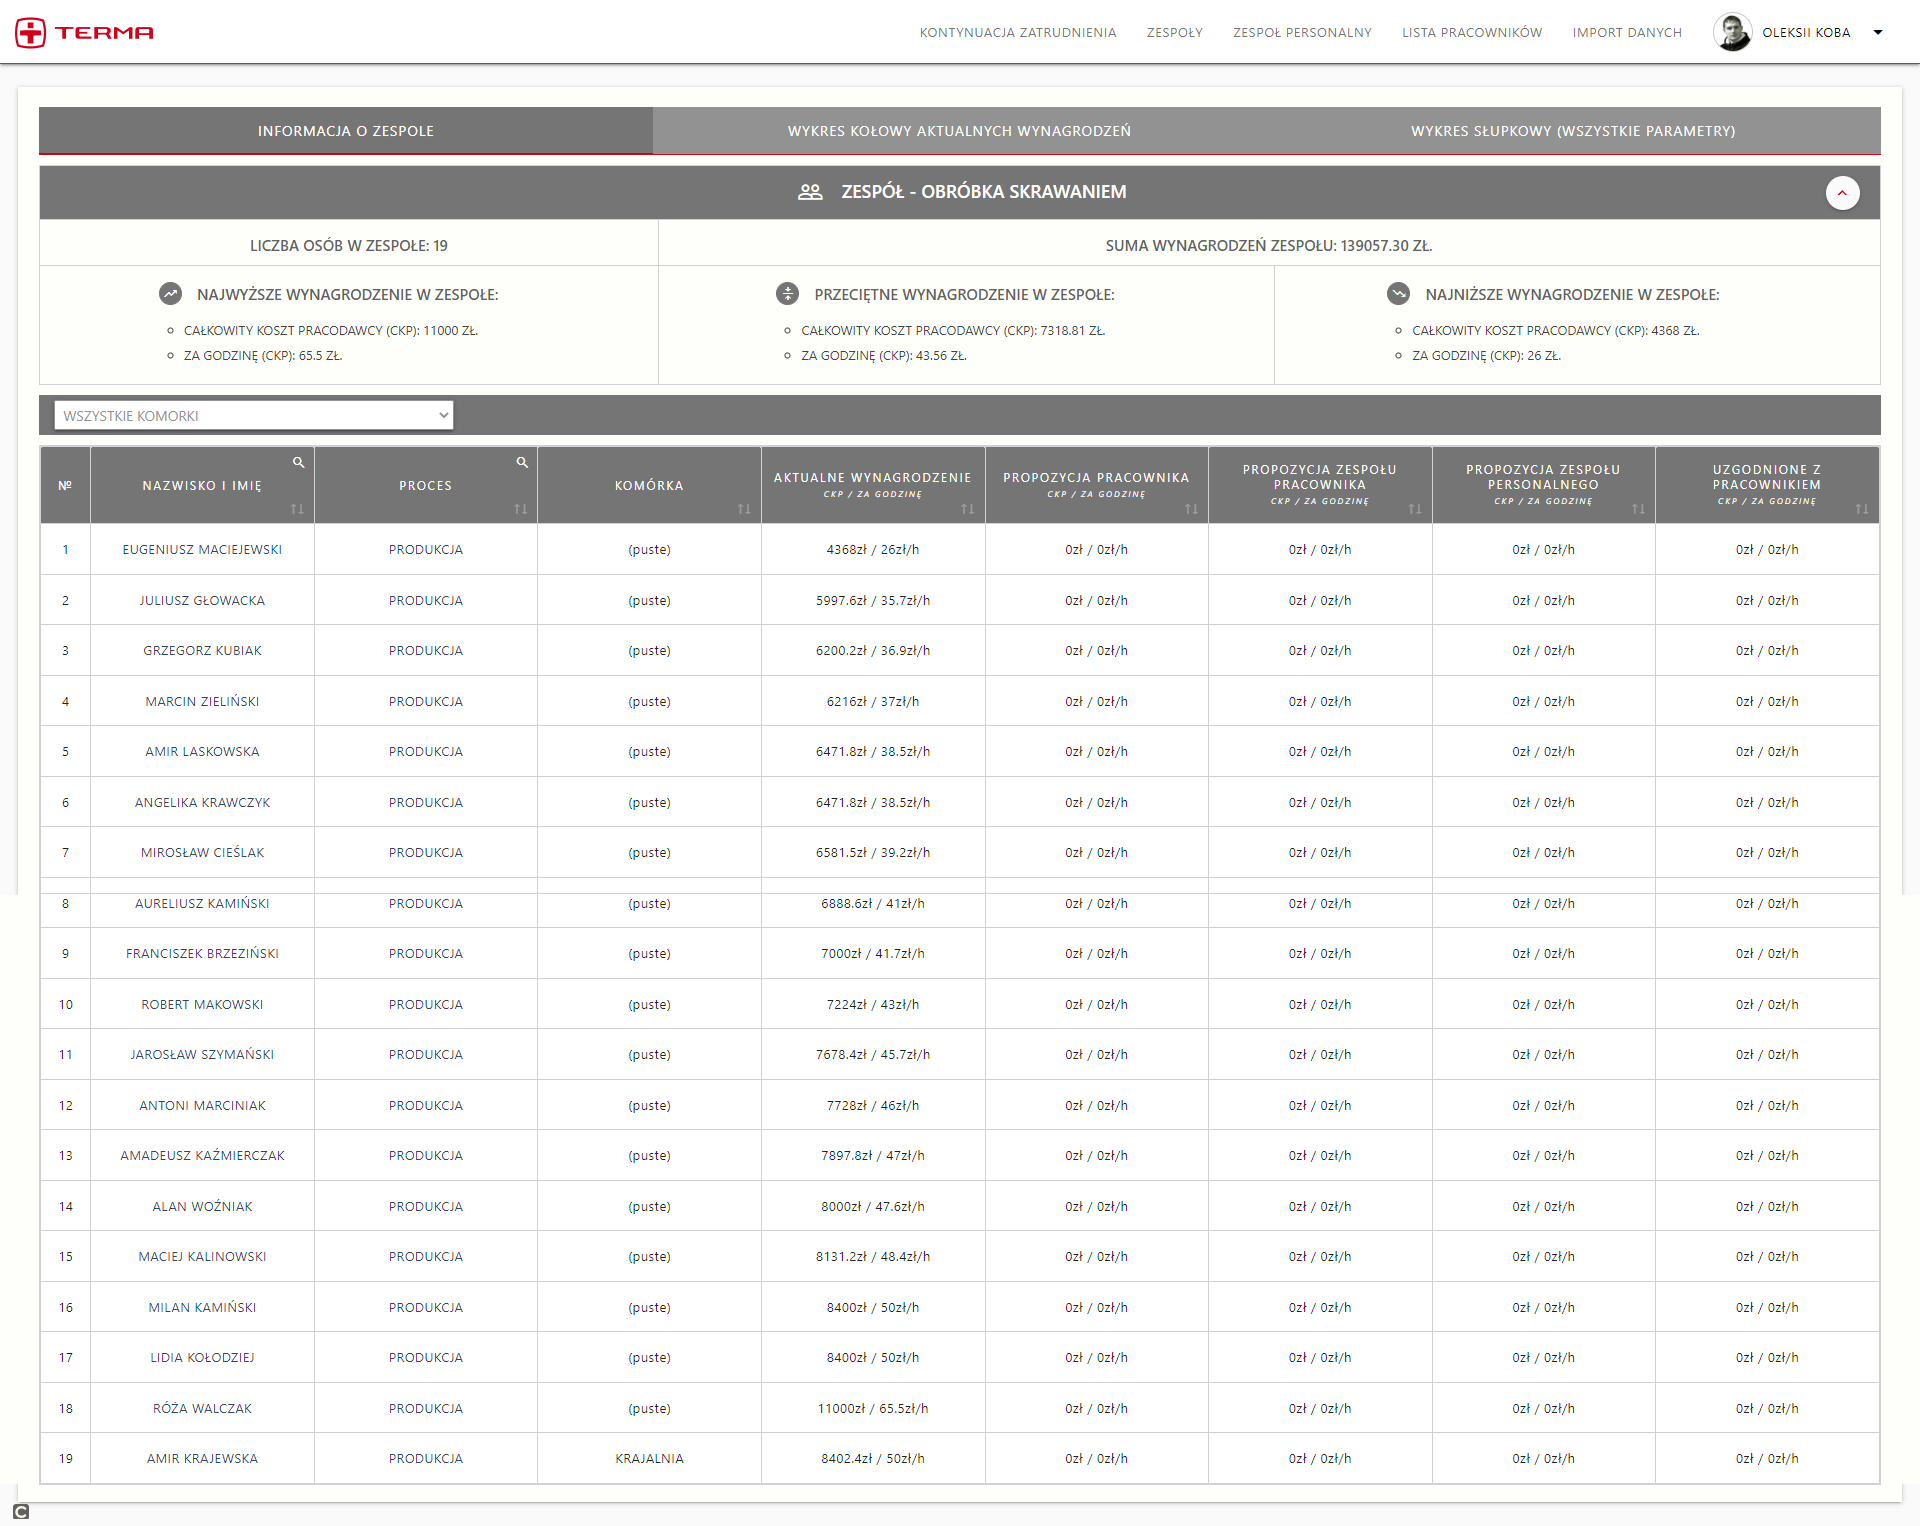
Information from the file is displayed as tables and graphs.
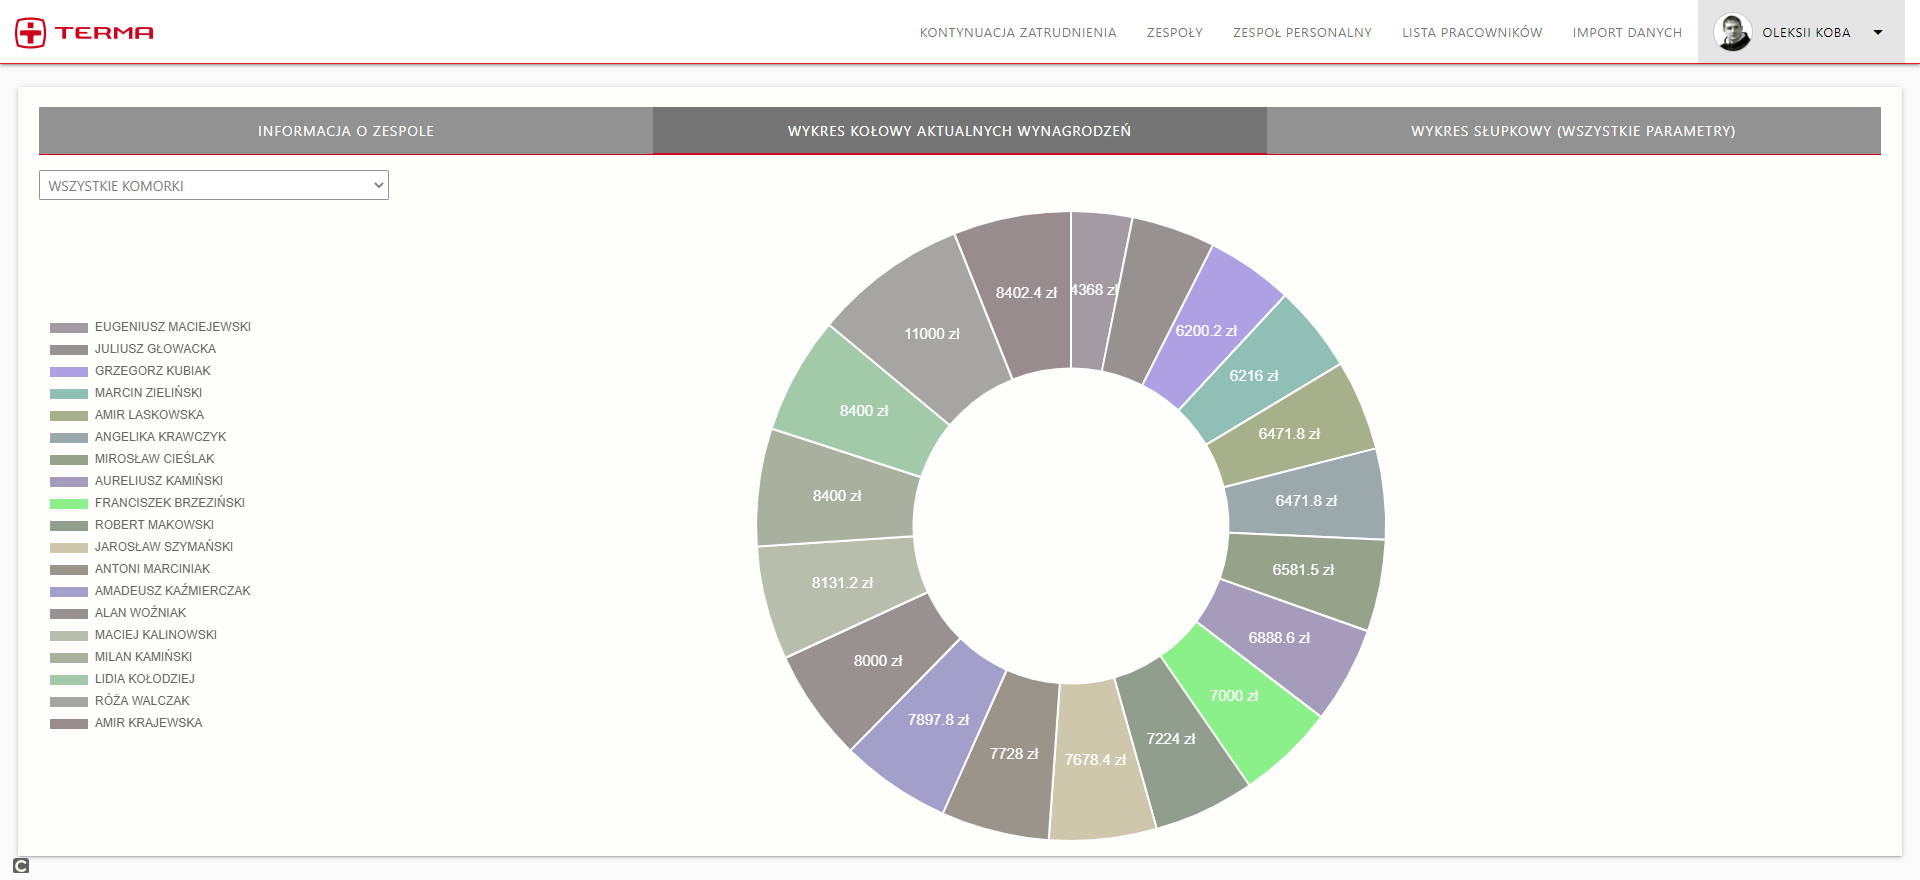
There are two types of graphs:
"Doughnut" for example https://departments-1c007.web.app/produkcja/produkty%20elektryczne and
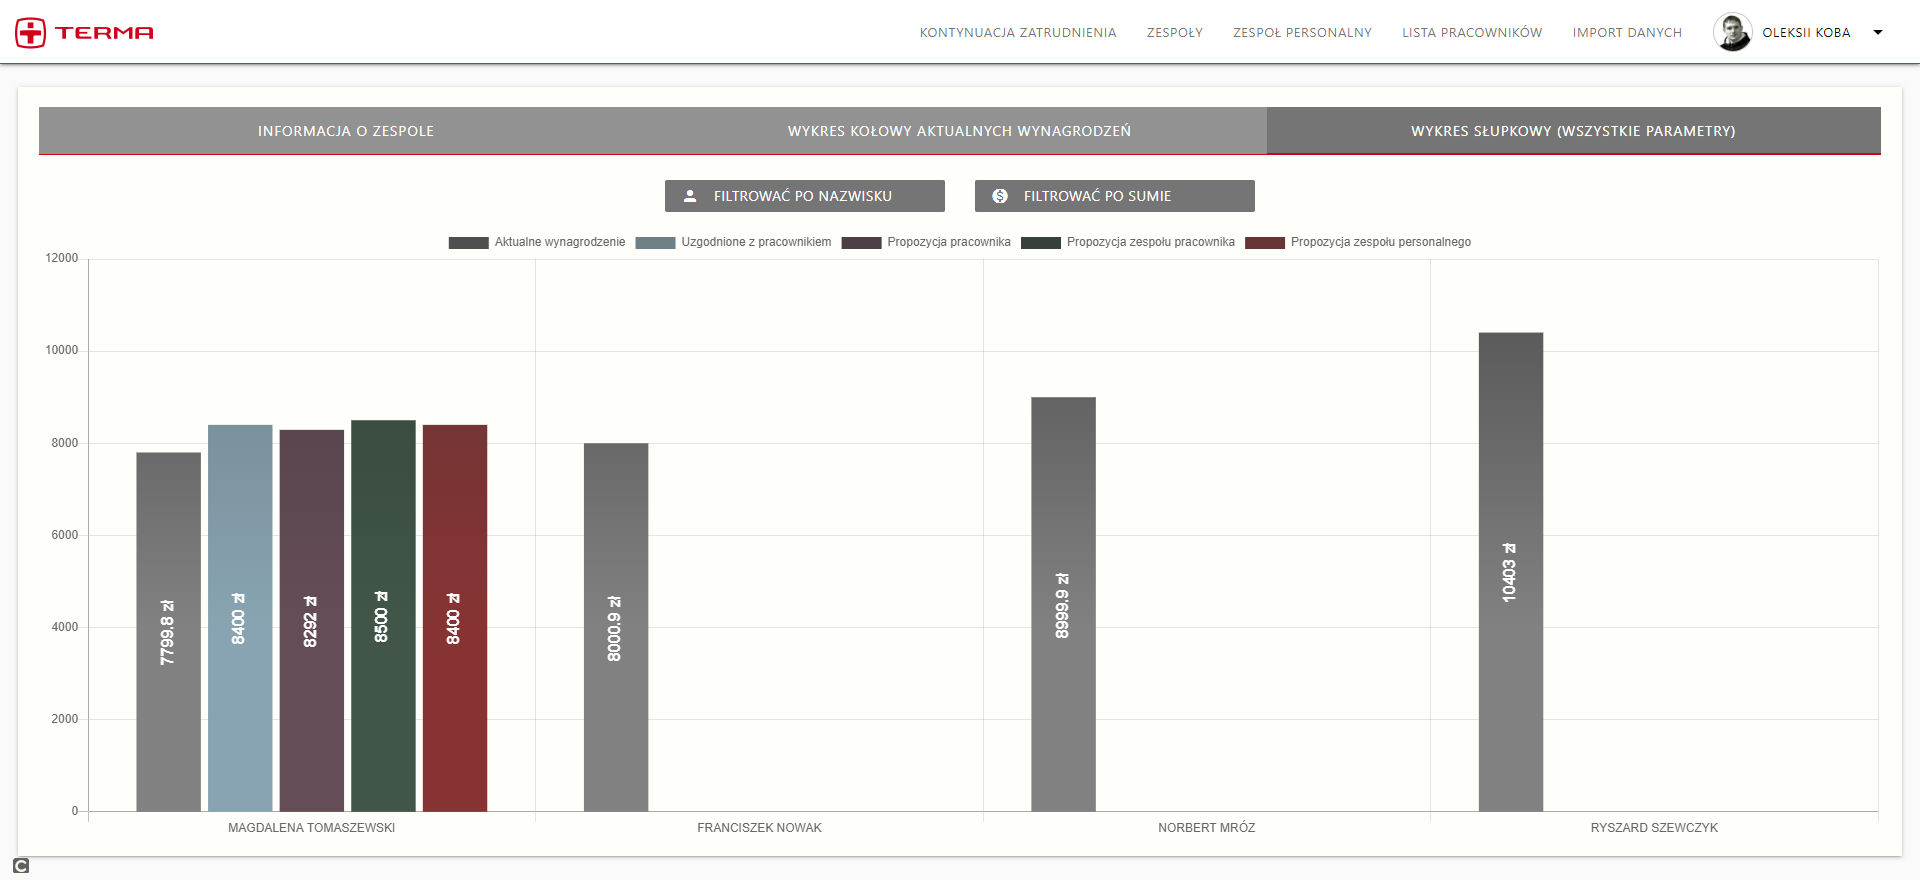
"Bar" for example https://departments-1c007.web.app/zesp%C3%B3%C5%82%20techniczny/utrzymanie%20ruchu).
You can sort from the date, from the name, from the departments, from the salary for the month and from the hours, and you can add photos of employees.
You can grouped by the departments and show how many employees you have in department, analyzed median salary.
You can compare the salary of new and old employees of the company in a way that is convenient for you on the graphs. In the graph, you can add and delete a part of the data for analysis.
Guest Account:
Email: admin80@gmail.com
Password: admin80
Project setup:
- npm install
Compiles and hot-reloads for development:
- npm run serve
Compiles and minifies for production:
- npm run build Customize configuration