Closed as not planned
Description
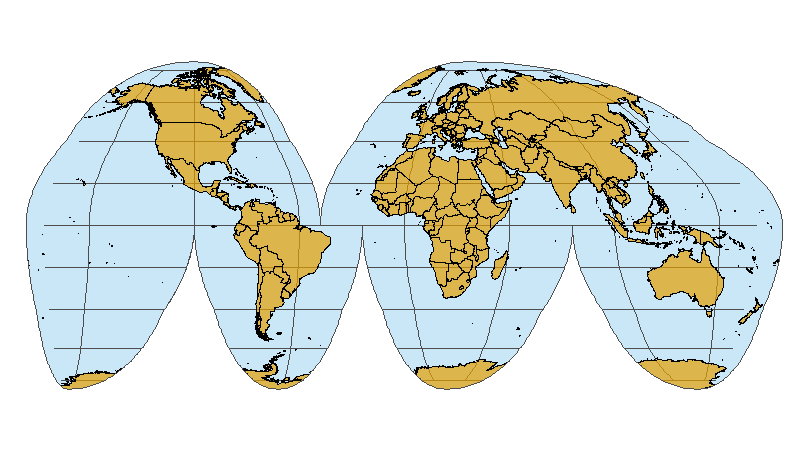
I've been trying to reproduce the Interrupted Goode homolosine example here. Everything seems to work fine, except that the map graticules (lat and long) don't extend to the limits like they do in the example pictures (this is after following that vignette to the letter):
I know that coord_sf() uses sf::st_graticule() to generate the graticules, but something else must be going on here, because when I plot lines generated from st_graticule(), it looks great. So coord_sf() must have a bug in the way it handles/plots the graticule data from st_graticule(). Here's a minimal reprex:
# with built-in graticules, graticules don't extend to plot limits
ggplot() +
    geom_sf(data = st_graticule(crs = "+proj=igh", lon = seq(-180, 180, 30), lat = seq(-90, 90, 30)), color = NA) +
    coord_sf(crs = "+proj=igh") +
    scale_x_continuous(NULL, breaks = c(seq(-180,180,30))) +
    scale_y_continuous(NULL, breaks = c(seq(-90,90,30))) +
    theme(panel.grid.major = element_line(color = "black"))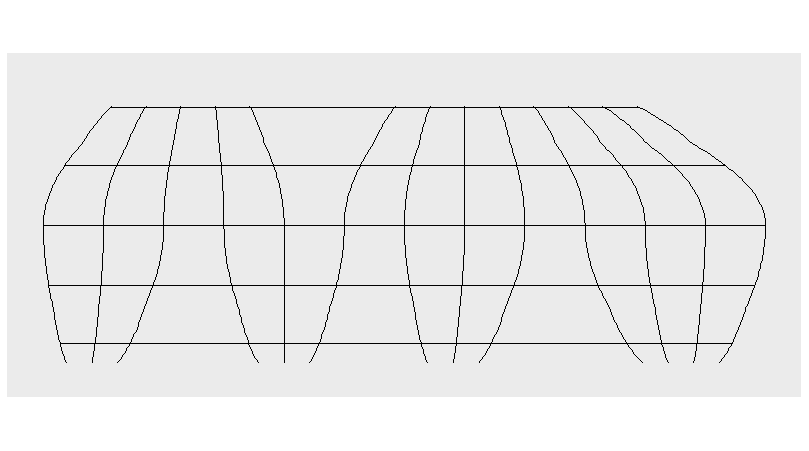
# with st_graticule, lines extend to plot limits
ggplot() +
    geom_sf(data = st_graticule(crs = "+proj=igh", lon = seq(-180, 180, 30), lat = seq(-90, 90, 30))) +
    coord_sf(crs = "+proj=igh") +
    theme(panel.grid.major = element_blank())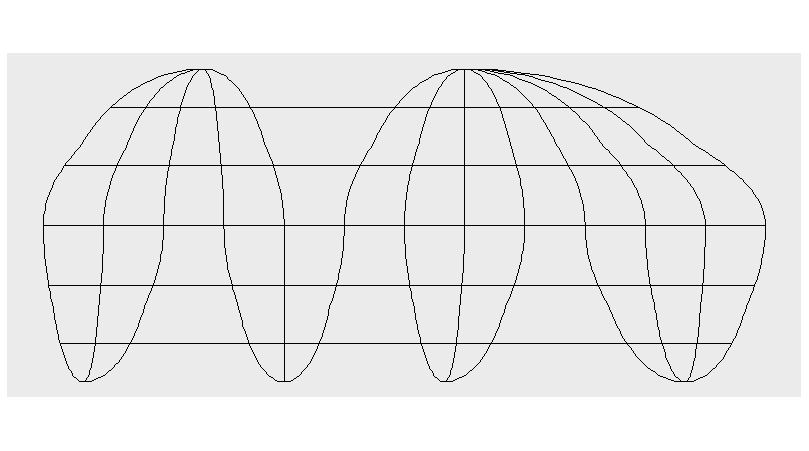
As far as I can tell, these two examples are intended to give the exact same visual output, but they don't.