Description
Consider the following plot:
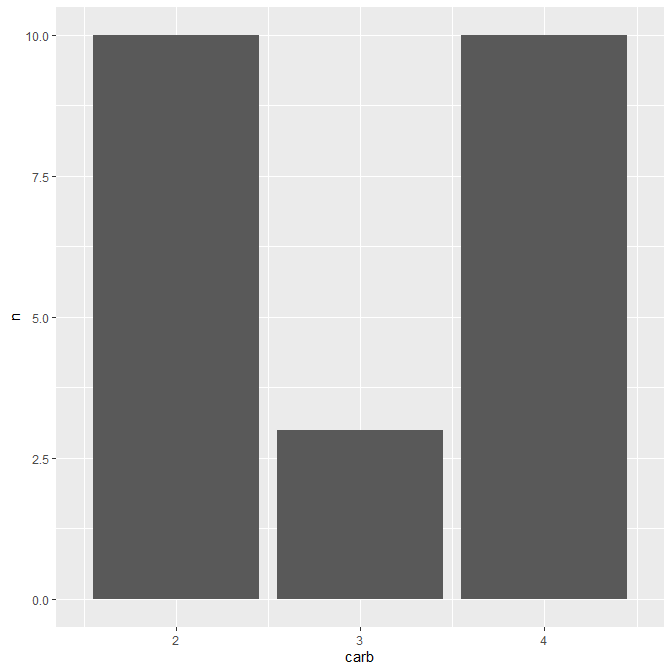
library(ggplot2)

ggplot(mtcars, aes(x = carb)) +
  geom_bar(stat = "count") +
  scale_x_continuous(limits = c(2, 4))
The bars centered at 2 and 4 are dropped. As documented in #2887, this is because the limits are not adjusted for the width of the bars. The bar centered on 2 actually extends back to ~1.5, and the bar centered on 4 actually extends to 4.5. Users do get some warnings:
Warning messages:
1: Removed 9 rows containing non-finite values (stat_count).
2: Removed 2 rows containing missing values (geom_bar).
The second warning alludes to the bars being dropped because they extend outside the specified axis limits. However, this isn't a sufficient explanation of what is happening because users may be specifying limits because they want bars outside of the axis limits to be dropped (and thus they expect to see the warnings), but don't understand why columns that appear to be inside the axis limits are also dropped.
suggestion: Improve the error message to note when columns are dropped because the column width is outside of the range (e.g. the column centered on 2), as opposed to when the entire column is outside of the range (e.g. the column centered on 1).
Finally, consider this solution to the issue:
ggplot(mtcars, aes(x = carb)) +
  geom_bar(stat = "count") +
  # expand axis limits to accommodate column width
  scale_x_continuous(limits = c(1.5, 4.5))
Warning message:
Removed 9 rows containing non-finite values (stat_count).
Is this solution the preferred approach to resolving the issue, or is this relying on undocumented/unreliable behavior?