-
|
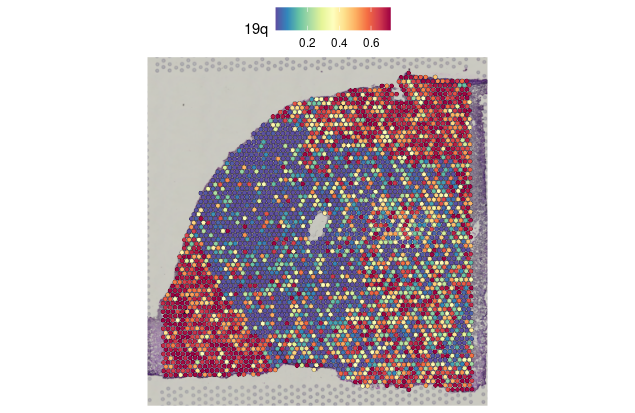
I was trying to work with my spatial data and I am not able to make a custom coloring scheme work with spatial data? What am I doing wrong?
|
Beta Was this translation helpful? Give feedback.
Replies: 1 comment
-
|
So |
Beta Was this translation helpful? Give feedback.
colsentry from theSpatialPlot()documentation:So
cols = c("grey88", "firebrick4")is not a valid parameter choice here for plotting a feature