Digging into price data issue #664
Replies: 1 comment
-
|
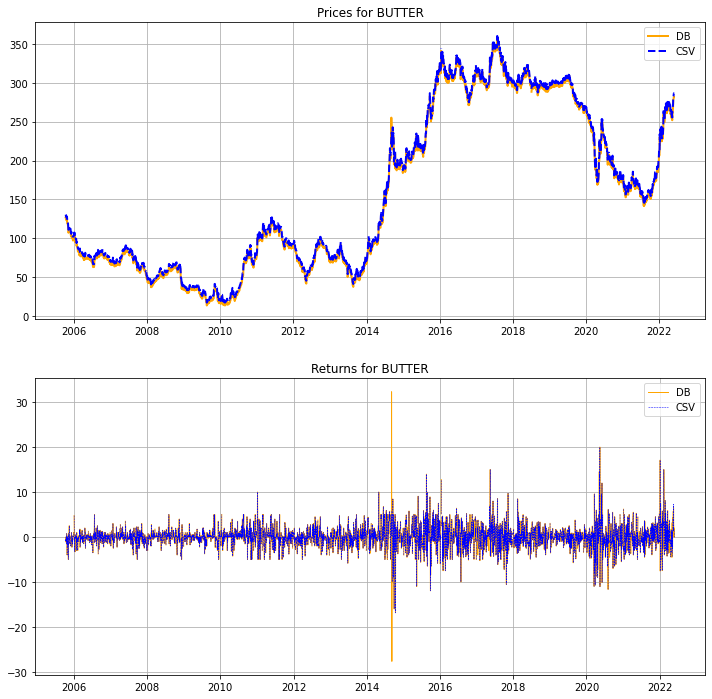
Hi Andy Thank you for pointing this out. Your gist was a easy and great tool to look through the data! It does not look like my data was affected by the rounding issue. But I did find an unexpected spike in several of the returns series. I have looked into it, but unable to see that the spike is a consequence of the panama stiching. It might be that it is in fact an artifact of the stiching, but thought I should post here, in case it was not. I understand that repo data will not be equal to the current data, since rolling will have shifted the levels of earlier contract' price series. But I am unable to see how some of the jumps in the price series was calulated by the Here is the spike graphed;
and here is the sliced_return and sliced_prices dfs from your code, for the time intervall in question
I do not see why the spike should occur at this position. The spike comes from the difference between the 4th and the 5th, while a roll occurs on the 7th, as seen in the multiple prices BUTTER.csv repo data: 2014-09-04 10:00:00,,20140900,271.95,20141000,,20141100 I am wondering if recalculation of the adjusted prices somehow introduce a skew of the prices relative to the index. I have looked closely at the |
Beta Was this translation helpful? Give feedback.
Uh oh!
There was an error while loading. Please reload this page.
-
Hi All
I recently spent some time chasing down a data issue. This posts describes the issue and solution, in case it helps anyone else. It also serves as an apology, as I caused the problem and it may affect others. I was experimenting with the new DO code, with vanilla futures instruments, and trying to run some backtests with some newly imported data from a new source. The price data was from Norgate. Running the backtests, I was seeing extremely slow performance. The script was running something like:
The script would hang at around 40% on 'Optimising positions'. At first I thought it had crashed, but I left it running one day and it did eventually finish after two hours or so. The stats were awful, something like 0.16 Sharpe, and the curve not pretty:
I started digging, tweaking the config, simplifying rules, removing instruments, removing weightings etc etc. It became clear the problem must be data related, because the system worked fine if I swapped out my database data for the supplied CSV prices, whatever the config. I created a script that compared my imported Norgate prices from the database, to the supplied CSV data:
https://gist.github.com/bug-or-feature/a3b2b80156cb0d75b3b49d451d8bcefc
For each instrument, the script calculates correlations for DB and CSV sourced adjusted prices, and for returns. And also spits out the start dates for each source, and the difference between them. The output for my data looked like:
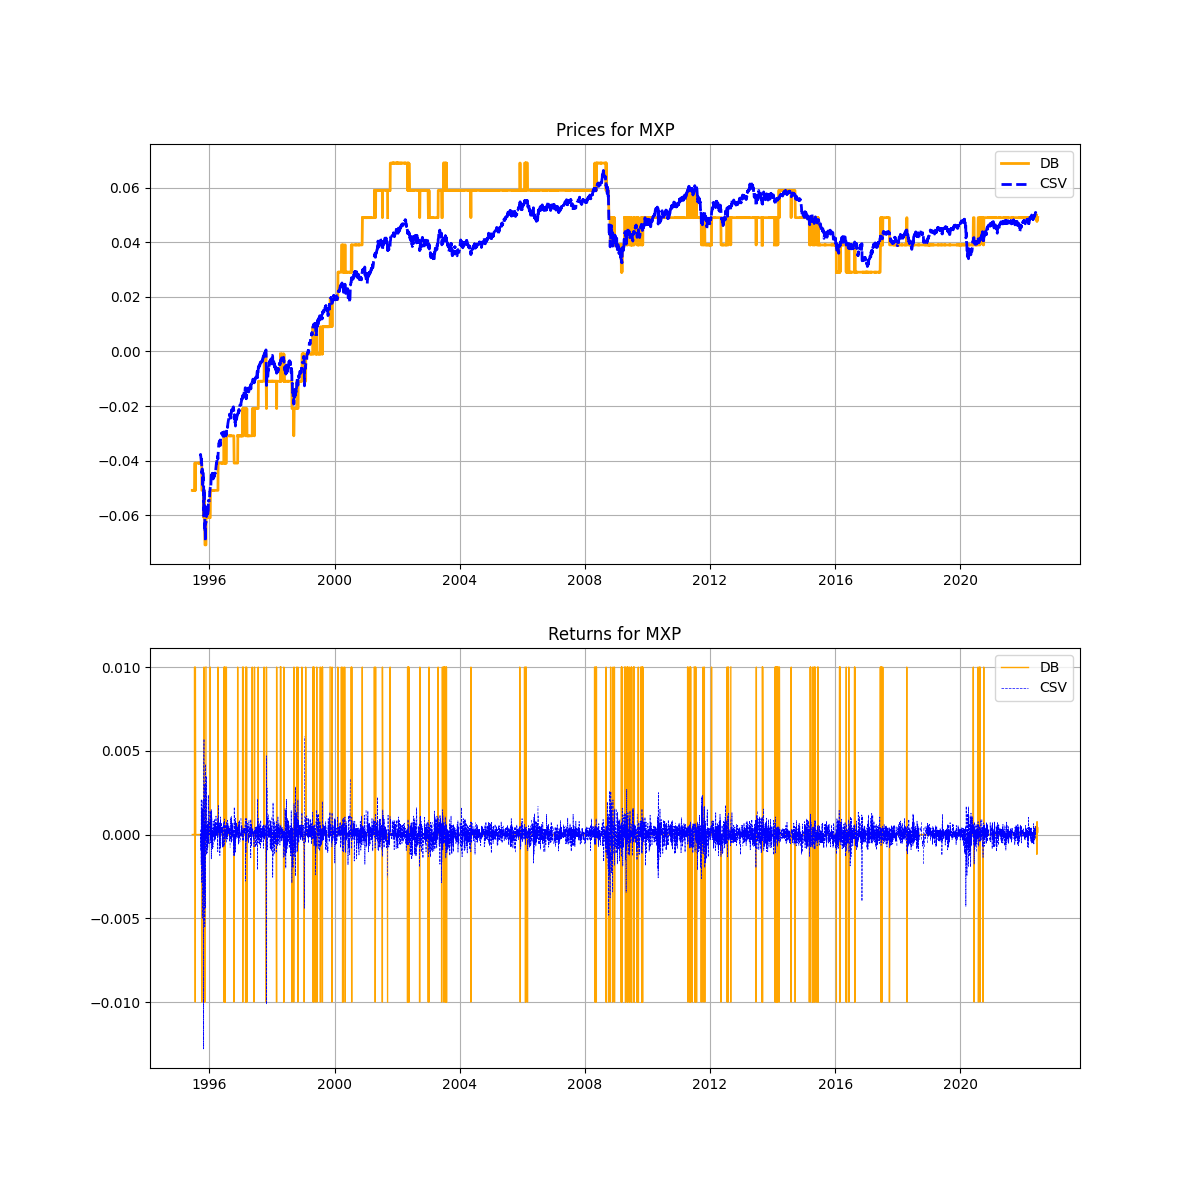
To dig deeper, you can also plot the correlations on a graph for an individual instrument. The worst one from the table above looks like:
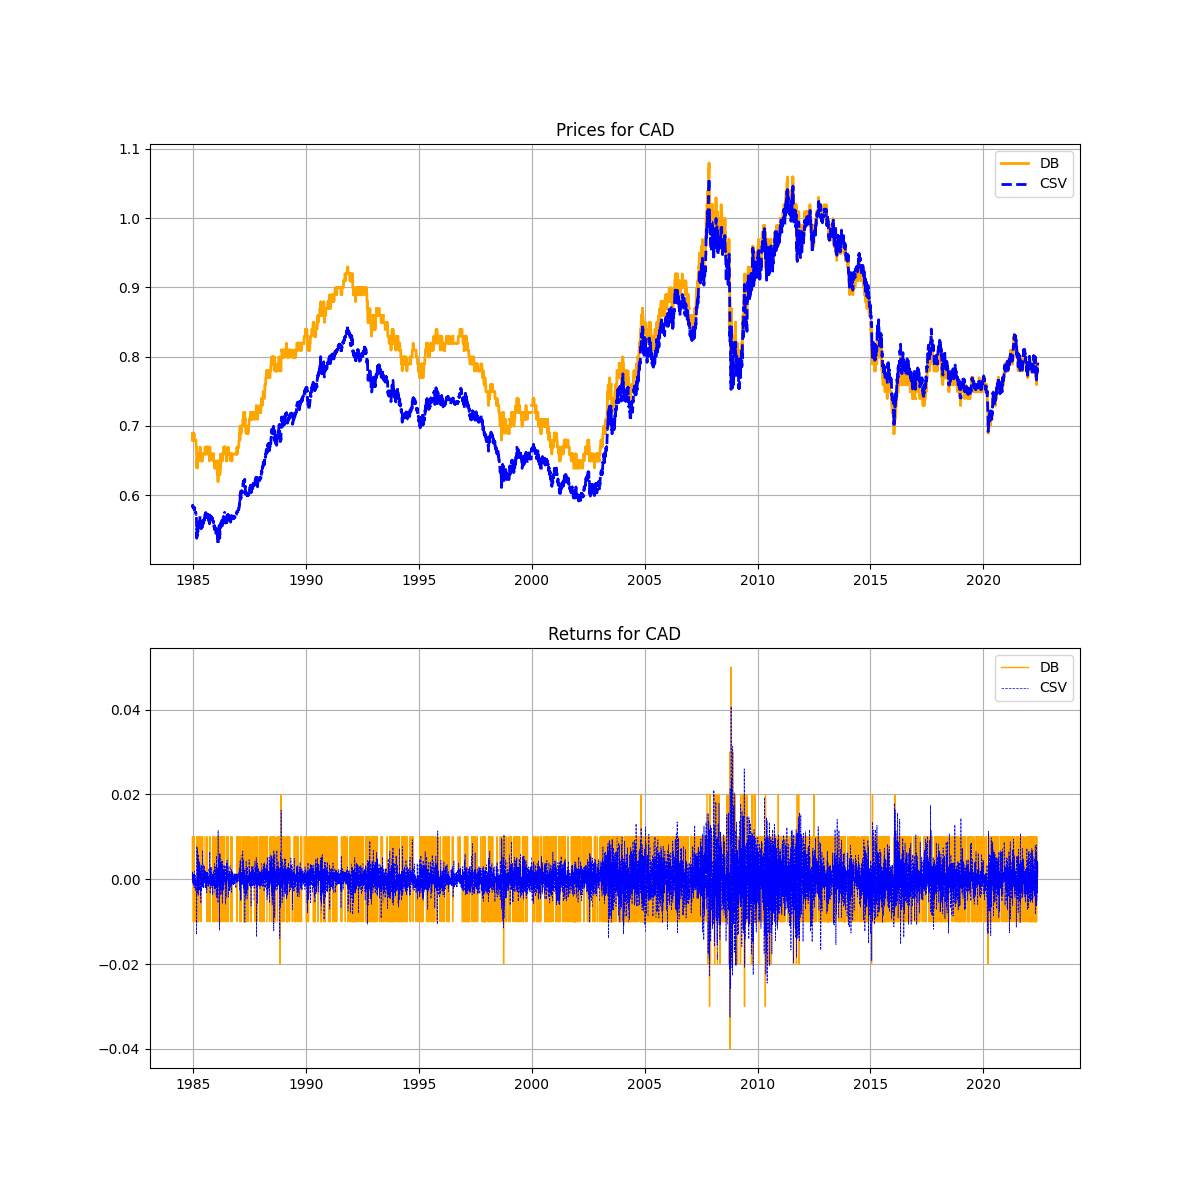
and for CAD
The orange line in the MXP price graph reminded me of another graph I had seen showing notional position against buffered rounded positions.... and then the penny dropped. Rounding! This issue was the culprit, I must have imported those prices when that rounding issue was still active. Re-importing the data without rounding gives
Much better. If you imported any new instruments when #629 was active (between 16 April and 10 June 2022), you may want to check your data, especially those with below zero or low price numbers, like some FX
Beta Was this translation helpful? Give feedback.
All reactions