Multiple subplots
You can use the subplot method.
require 'gr/plot'

x = [1,2,3,4,5,6,7,8,9,10]
y = x.shuffle

GR.barplot x, y, GR.subplot(2, 2, 1)
GR.stem    x, y, GR.subplot(2, 2, 2)
GR.step    x, y, GR.subplot(2, 2, 3)
GR.plot    x, y, GR.subplot(2, 2, 4)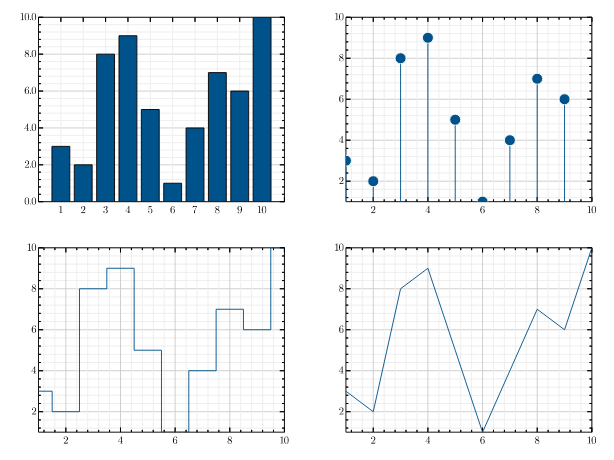
subplot returns a simple hash like this. Why does the GR.rb subplot simply return a Hash, unlike GR.jl? This is because the position of the subplot is better when it can be fine-tuned by a human being. Tweak the position of the subplot by changing the numbers in the Hash.
GR.subplot(2,2,1)
=> {:subplot=>[0.0, 0.5, 0.5, 1.0], :clear=>true, :update=>false}